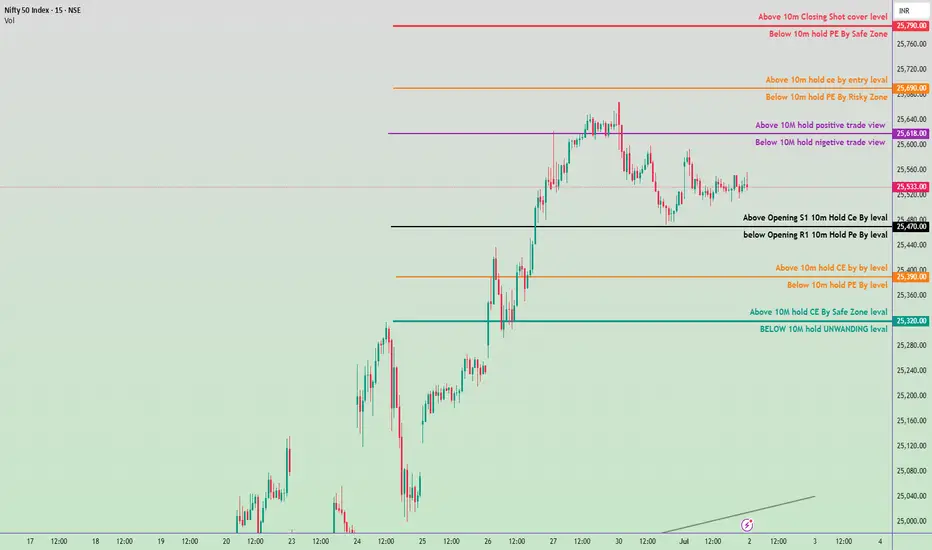
Nifty 50 Intraday Trade Plan 2nd july 2025🔼 Bullish Zones (Calls/CE preferable)
Above ₹25,790 → Closing Shot cover level
Above ₹25,760 → Hold PE by Safe Zone ends
Above ₹25,690 → Entry level for CE (Calls)
Above ₹25,618 → 10M hold positive trade view
Above ₹25,470 → Opening S1 | 10M Hold CE by level
Above ₹25,390 → 10M hold CE by Buy level
Above ₹25,320 → 10M hold CE by Safe Zone level
🔽 Bearish Zones (Puts/PE preferable)
Below ₹25,760 → Hold PE by Safe Zone starts
Below ₹25,690 → Risky Zone for PE
Below ₹25,618 → 10M hold negative trade view
Below ₹25,470 → Opening R1 | 10M Hold PE by level
Below ₹25,390 → 10M hold PE by level
Below ₹25,320 → UNWINDING level (Strong support loss)
📌 Trade Plan Guidelines
🔹 Above ₹25,618 with volume: Favor CE (calls), look for targets up to ₹25,690–₹25,790.
🔹 Below ₹25,470 with confirmation: Favor PE (puts) toward ₹25,390–₹25,320.
🔹 Avoid trading between ₹25,470–₹25,618 if price is consolidating — this is a neutral “no trade zone”.
📉 Below ₹25,320, expect strong unwinding.
Intraday
25,600 Resistance Holding Strong | Option Chain Signals Bearish For Intraday (5-Min Chart)
1. VWAP (Volume Weighted Average Price)
Use: Institutional buying/selling level
Watch:
Price above VWAP → bullish
Price below VWAP → bearish
Sideways around VWAP → consolidation
✅ Great for scalping & breakout trades.
For Swing Trading (3-Hour Chart)
1. MACD (12,26,9)
Use: Trend confirmation & momentum
Watch:
Bullish crossover (MACD line crosses above signal line) = possible up move
Bearish crossover = possible down move
MACD histogram momentum shows strength/weakness.
2. 200 EMA (Exponential Moving Average)
Use: Long-term trend
Above 200 EMA → bullish bias
Below → bearish
Acts as dynamic support/resistance.

Nifty 50 – Tomorrow’s Intraday Trade Plan (1st July 2025)
🔴 Bullish Zones (Call Option Focus)
₹25,790.00 – Above 10M Closing Shot Cover Level
₹25,770.00 – Above 10M Hold CE by Entry Level
₹25,700.00 – Above 10M Hold CE by Entry Level
₹25,590.00 – Above 10M Hold Positive Trade View
₹25,413.00 – Above Opening S1 10M Hold CE by Level
₹25,290.00 – Above 10M Hold CE by Level
₹25,113.00 – Above 10M Hold CE by Safe Zone Level
🔵 Bearish Zones (Put Option Focus)
₹25,790.00 – Below 10M Hold PE by Safe Zone
₹25,690.00 – Below 10M Hold PE by Risky Zone
₹25,590.00 – Below 10M Hold Negative Trade View
₹25,363.00 – Below Opening R1 10M Hold PE by Level
₹25,250.00 – Below 10M Hold PE by Level
< ₹25,113.00 – Below 10M Hold = UNWINDING Zone

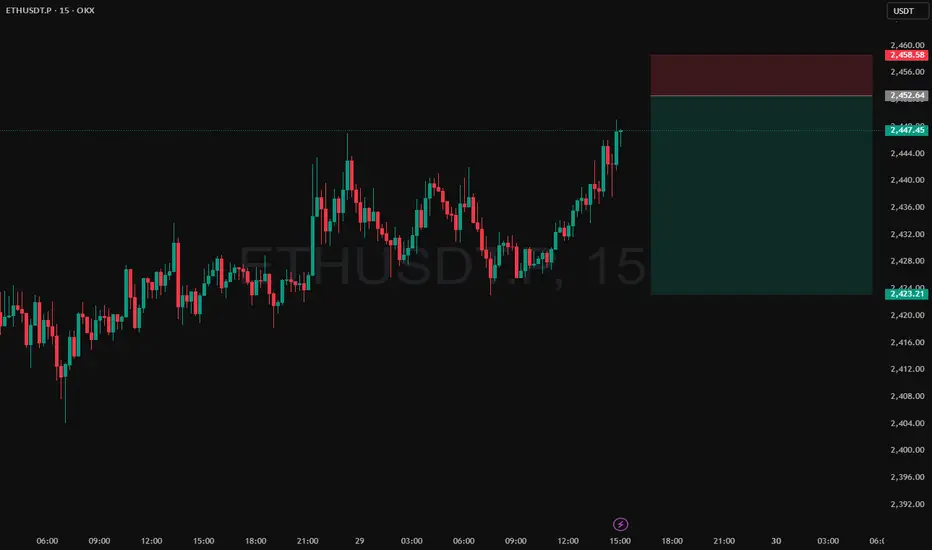
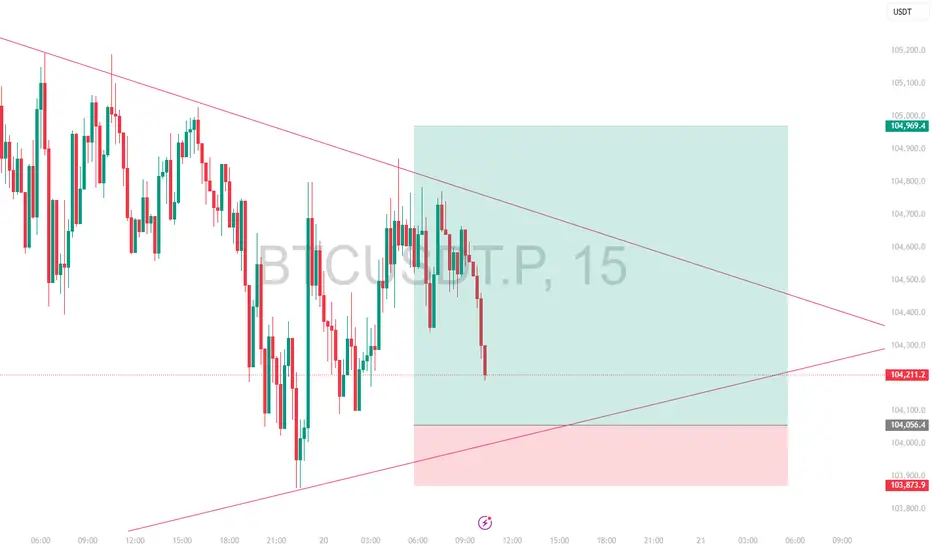
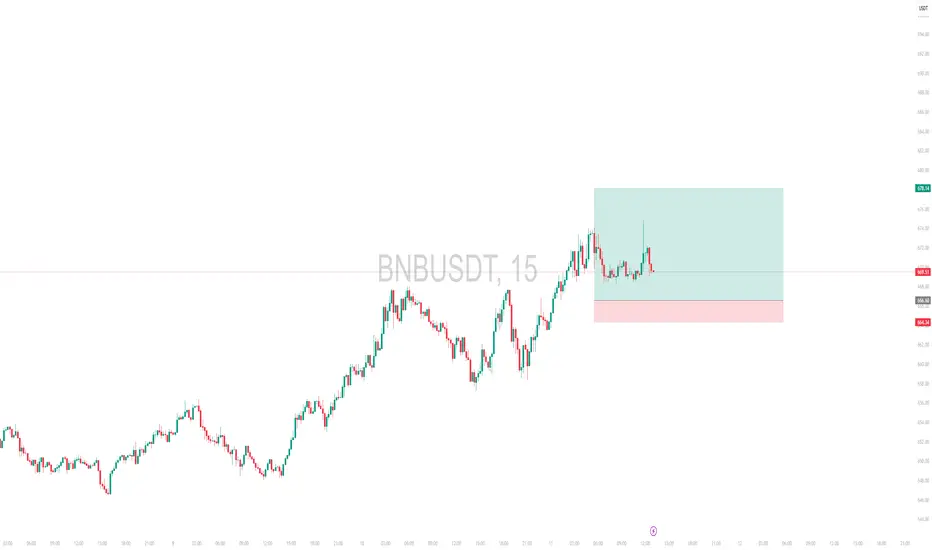
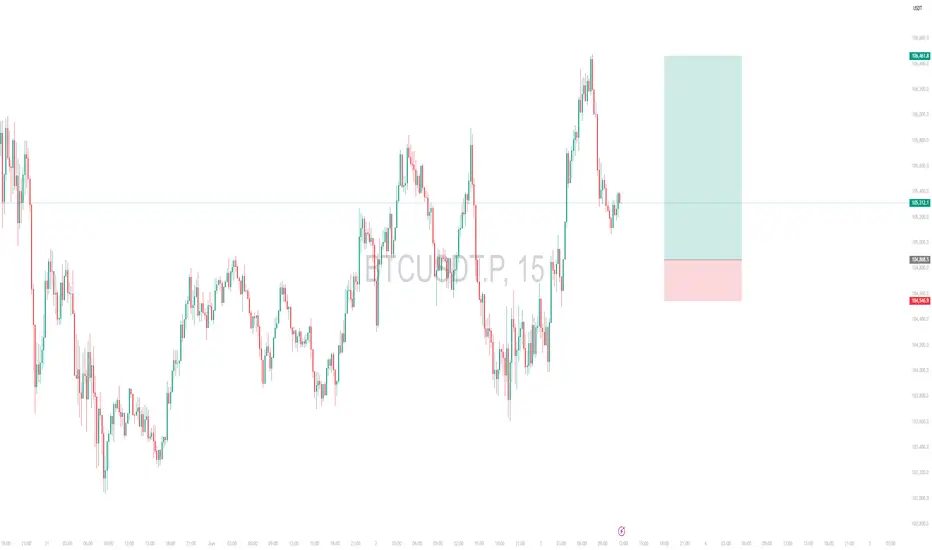
Intraday Short Setup | June 29th 2025 | Valid Until Daily ClosePrice has pushed into a potential intraday Pivot supply zone (red box) where sellers may step in. This trade is based on the expectation of a rejection from this area.
Entry: Red box — a short entry zone aligned with overhead supply
Stop Loss: Above the red zone (invalidates the setup)
Target: Green box — area to consider partial/full exit based on momentum
Risk-reward is favorable with a tight invalidation and clean downside target
Price may stall or reverse near the red box, creating short opportunity
Note:
This is an intraday trade idea that expires at 00:00 UTC (Daily Candle Close). Re-evaluate the setup if price remains indecisive near the entry zone close to that time.
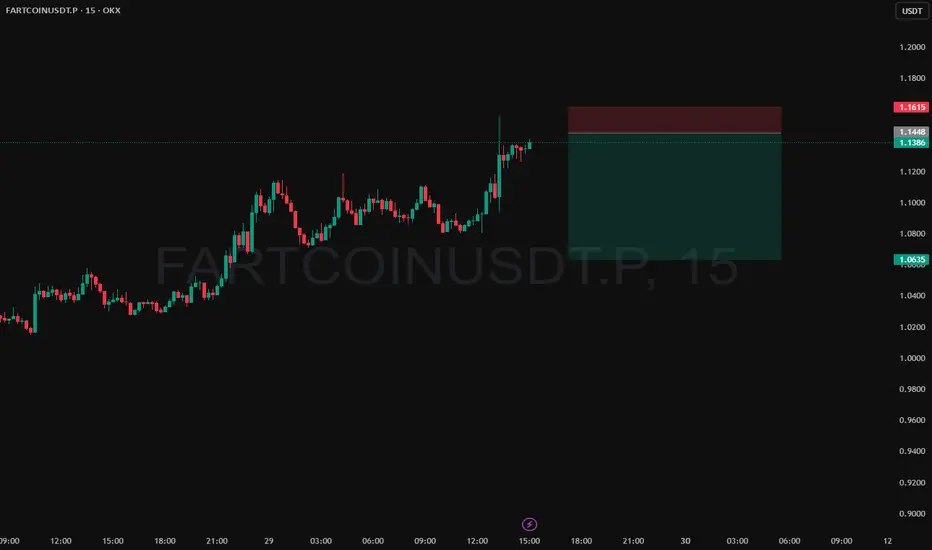
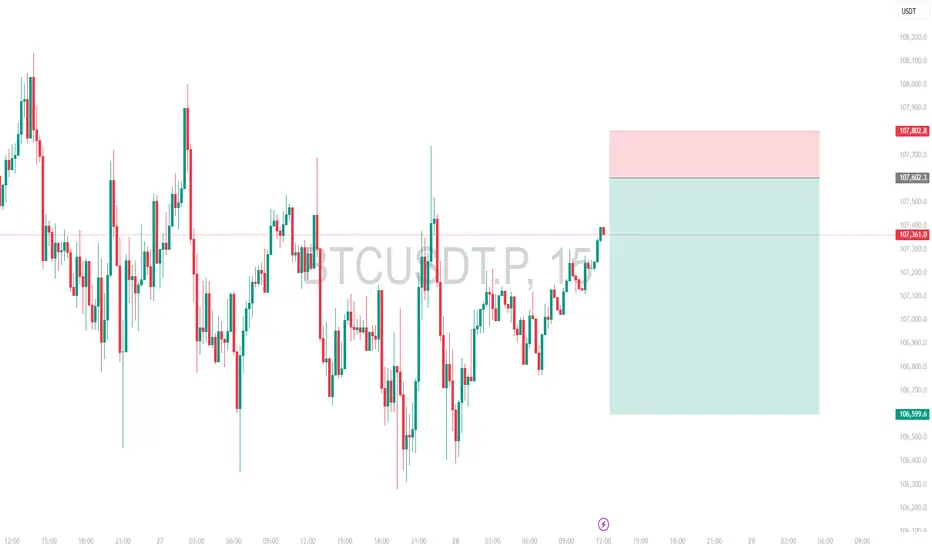
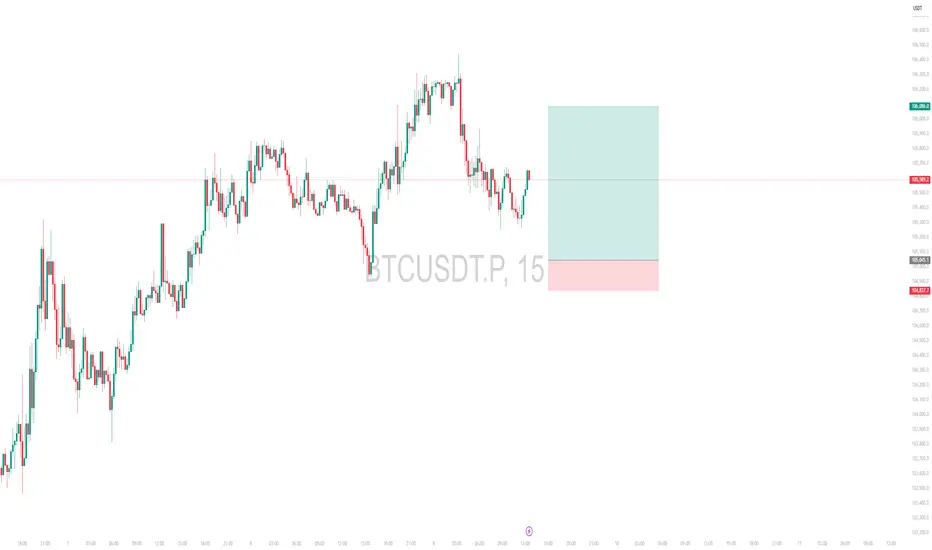
Intraday Short Setup | June 28th 2025 | Valid Until Daily ClosePrice has pushed into a potential intraday Pivot supply zone (red box) where sellers may step in. This trade is based on the expectation of a rejection from this area.
Entry: Red box — a short entry zone aligned with overhead supply
Stop Loss: Above the red zone (invalidates the setup)
Target: Green box — area to consider partial/full exit based on momentum
Risk-reward is favorable with a tight invalidation and clean downside target
Price may stall or reverse near the red box, creating short opportunity
Note:
This is an intraday trade idea that expires at 00:00 UTC (Daily Candle Close). Re-evaluate the setup if price remains indecisive near the entry zone close to that time.
Nifty 50 Intraday Trade Plan for June 27, 2025✅ Bullish Trade Plan (Call Option / CE)
Above 25478 hold
🔹 Level: Above Opening S1 10m Hold CE By level
🔸 Action: Buy CE if price sustains above this level
🔸 Target 1: 25,638 – Above 10M hold positive trade view
🔸 Target 2: 25,770 – Above 10m hold CE by entry level
🔸 Target 3: 25,880 – Below 10m hold PE by Safe Zone
🔸 Target 4: 25,900 – Above 10m Closing Shot cover level
❌ Bearish Trade Plan (Put Option / PE)
Below 25,638
🔹 Level: Below Opening R1 10m Hold PE By level
🔸 Action: Buy PE if price falls below this level
🔸 Target 1: 25,378 – Below 10m hold PE By level
🔸 Target 2: 25,178 – Above 10M hold CE By Safe Zone level

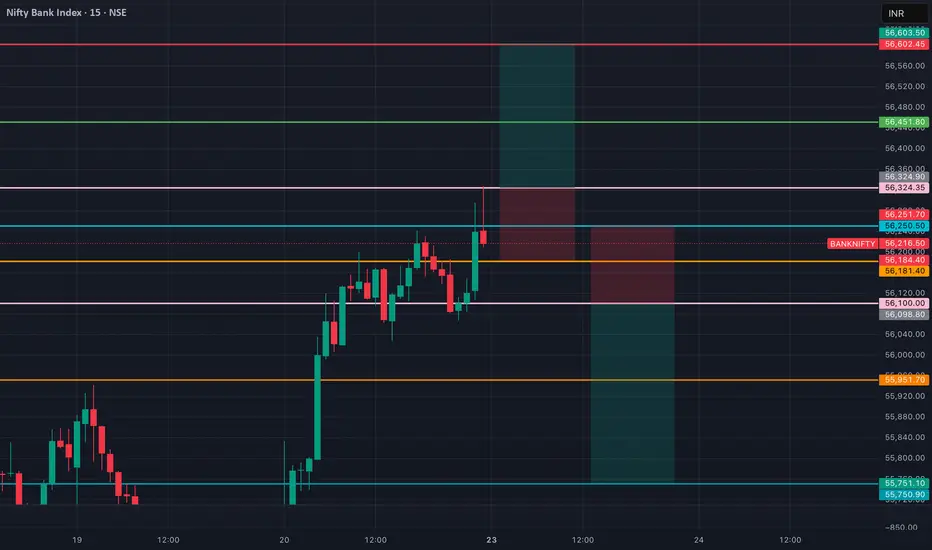
BANK NIFTY Levels for Intraday (Educational Purpose) 23/05/2025 📈 BankNifty Intraday Trade Setup – 23/06/2025 (Monday)
🕒 Timeframe: 1-Min Chart
📊 Market Sentiment: Cautiously Bullish | High Volatility Expected
🔼 Buy Above: 56,320 (sustained breakout)
🎯 Target 1: 56,420
🎯 Target 2: 56,550
🛑 Stop Loss: 56,180
⚠️ Confirm with strong volume and EMA crossover
🔽 Sell Below: 56,050 (breakdown below demand zone)
🎯 Target 1: 55,920
🎯 Target 2: 55,780
🛑 Stop Loss: 56,200
⚠️ Entry valid only after 5-min candle closes below 56,050
📍 Key Levels to Watch:
🔹 Resistance: 56,300 – 56,400
🔹 Support: 56,050 – 55,900
🔹 Demand Zone: 55,700 – 55,600
🔹 Supply Zone: 56,400 – 56,550
📌 Pro Tips for Monday:
✅ Track global cues (esp. geopolitical tensions)
✅ Use VWAP and RSI for extra confirmation
✅ No overtrading on breakout traps
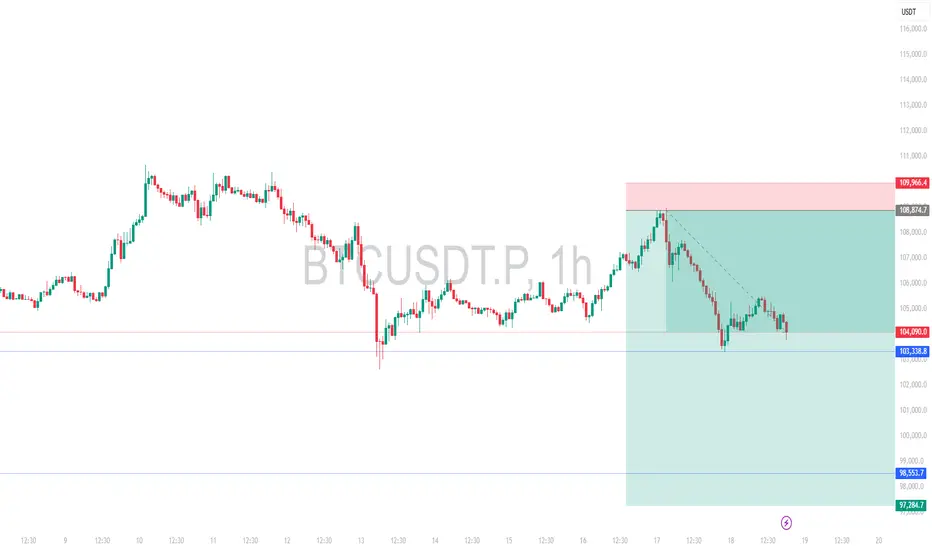
Weekly Short Setup | Valid Until Weekly CloseI have been in this trade for sometime now with first TP taken. Due to uncertainty globally, I am not posting any intraday charts.
Stay safe, save capital is the motto right now.
Note:
This is an weekly setup and idea that expires at Weekly Candle Close. Re-evaluate the setup if price remains indecisive near the entry zone close to that time.
Intraday Long Setup | June 20th 2025 | Valid Until Daily ClosePrice retraced to a strong pivot zone.
Structure remains bullish with potential for continuation after pullback.
Tight risk control.
Watch for price reaction within the red zone. Entry only if confirmation appears
The setup expires at end of the daily candle close.
MaxHealth good to keep on radar NSE:MAXHEALTH
Good to keep on the radar
Always respect SL & position sizing
===================
Trade Secret By Pratik
===================
Disclaimer
SEBI UNREGISTERED
This is our personal view and this analysis
is only for educational purposes
Please consult your advisor before
investing or trading
You are solely responsible for any
decisions
you take on basis of our research

Intraday Long Setup | June 11th 2025 | Valid Until Daily ClosePrice retraced to a strong pivot zone.
Structure remains bullish with potential for continuation after pullback.
Tight risk control.
Watch for price reaction within the red zone. Entry only if confirmation appears
The setup expires at end of the daily candle close.

Intraday Long Setup | June 11th 2025 | Valid Until Daily ClosePrice is retracing to a strong pivot zone.
Structure remains bullish with potential for continuation after pullback.
Tight risk control.
Watch for price reaction within the red zone. Entry only if confirmation appears
The setup expires at end of the daily candle close.
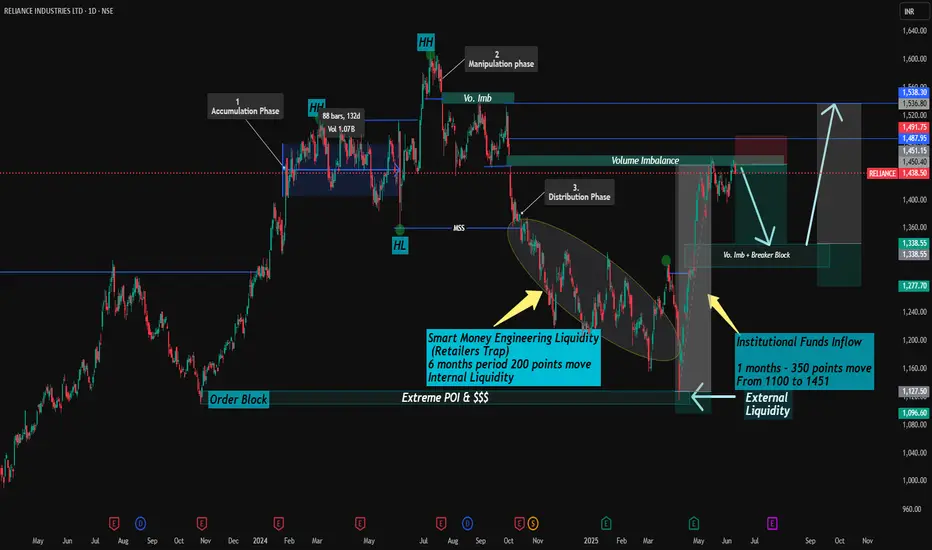
Reliance industries ltd. Deep AnalysisSharing my Analysis on Reliance (RIL). (Only for Education Purpose)
This analysis is based on Higher Time Frame (Daily)
Past Move scenario ----
1. If we see on chart, after 3rd oct. 2024, Price has completed major liquidity sweep below internal lows followed by Market Structure Shift (Marked as MSS) and for that it took 6 months.
2. After that External liquidity sweep been performed near to 1100 levels which is also marked as Extreme POI which triggered an impulse move of 350 points with funds inflow which pushed price to 1451 levels. (Here it just took 1 months only)
Current Move Scenario ----
===upside there we saw volume imbalance + Breaker block where price is making resistance or rejecting upside move.
(Potential Short Term Supply Zone 1450-1488 levels)
Expected Short Term Bias ---
Downside levels --- 1335 (Breaker Block + Discount Zone)
Upside Resistance ---- Cross of Order block range 1496
Expected Long Term Bullish Bias -- Likely after Retracement to downside Vo. Imbalance and + Breaker block
Re-Entry Long Zone - 1335-1350
Upmove expected to 1500 Imbalance levels
above that Final External Liquidity zone to 1560
Steps --- Accumulation ---Expansion ---Re accumulation, targeting External Liquidity.
Everything mentioned on chart itself.
{Above Views are only for Education purpose and do not consider it as any Advisory. Consult your Financial Advisor before investments in any securities.}
YOur Views or Comments are Welcomed.
Intraday Long Setup | June 9th 2025 | Valid Until Daily ClosePrice is retracing to a strong pivot zone (marked by the red box).
Structure remains bullish with potential for continuation after pullback.
The green box represents a high-probability long opportunity with tight risk control.
Watch for price reaction within the red zone. Entry only if confirmation (e.g., bullish engulfing, strong wick rejections) appears.
The setup expires at end of the daily candle close.
Intraday Long Setup | June 9th 2025 | Valid Until Daily ClosePrice is retracing to a strong pivot zone.
Structure remains bullish with potential for continuation after pullback.
Tight risk control.
Watch for price reaction within the red zone. Entry only if confirmation appears
The setup expires at end of the daily candle close.
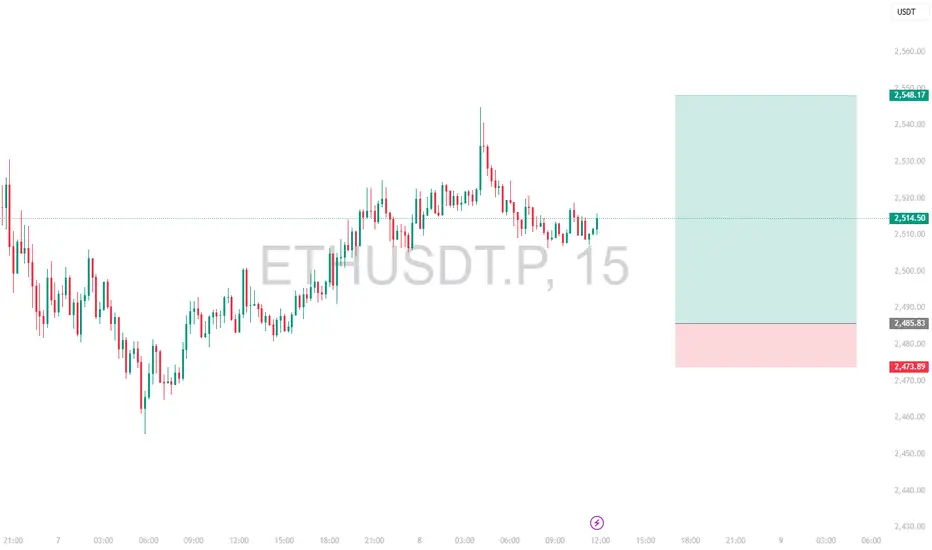
Intraday Long Setup | June 8th 2025 | Valid Until Daily ClosePrice is retracing to a strong pivot zone (marked by the red box).
Structure remains bullish with potential for continuation after pullback.
The green box represents a high-probability long opportunity with tight risk control.
Watch for price reaction within the red zone. Entry only if confirmation (e.g., bullish engulfing, strong wick rejections) appears.
The setup expires at end of the daily candle close.

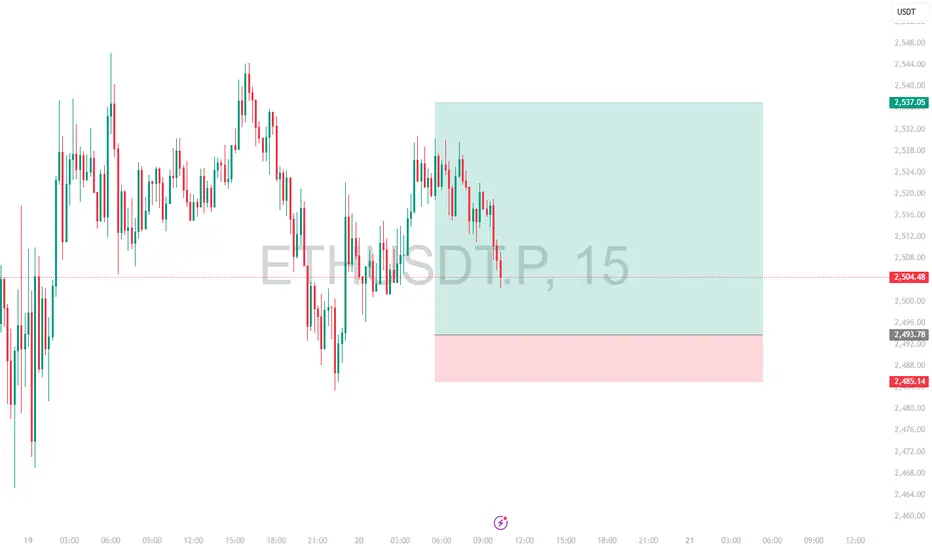
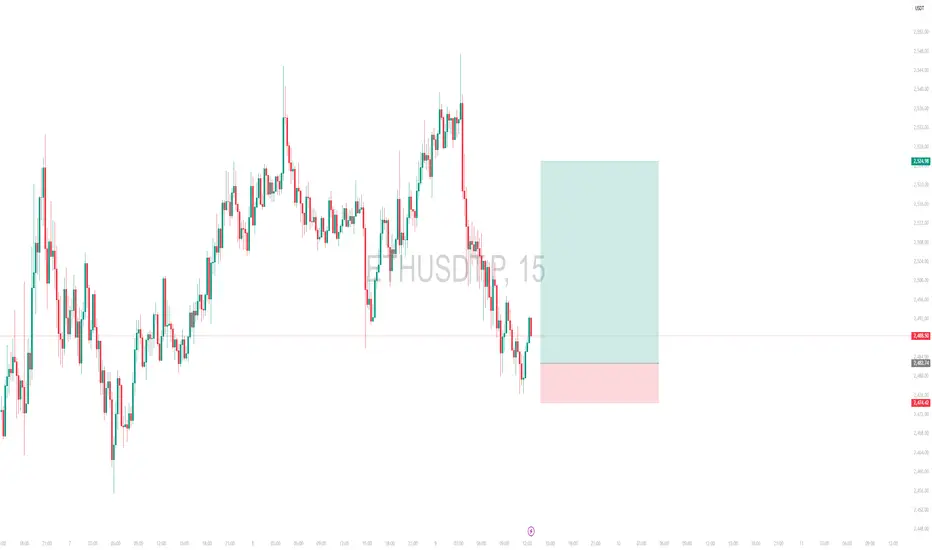
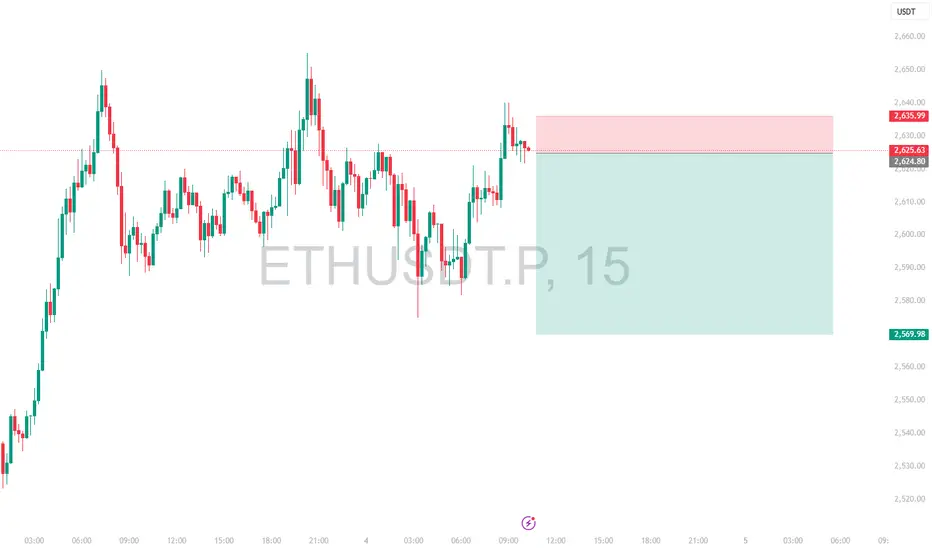
Intraday Short Setup | June 4th 2025 | Valid Until Daily ClosePrice has pushed into a potential intraday Pivot supply zone (red box) where sellers may step in. This trade is based on the expectation of a rejection from this area.
Entry: Red box — a short entry zone aligned with overhead supply
Stop Loss: Above the red zone (invalidates the setup)
Target: Green box — area to consider partial/full exit based on momentum
ETHUSDT has shown a strong bounce but is now approaching a key pivotal resistance zone
Risk-reward is favorable with a tight invalidation and clean downside target
Price may stall or reverse near the red box, creating short opportunity
Note:
This is an intraday trade idea that expires at 00:00 UTC (Daily Candle Close). Re-evaluate the setup if price remains indecisive near the entry zone close to that time.
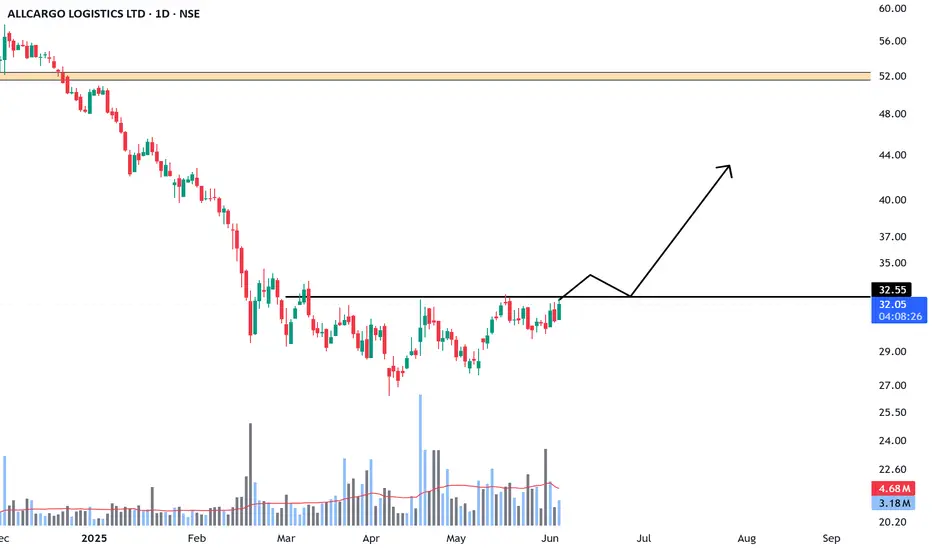
ALLCARGONSE:ALLCARGO
Good to keep on the radar
It's on the verge of BO...
Almost 70% down from ATH
Always respect SL & position sizing
========================
Trade Secrets By Pratik
========================
Disclaimer
NOT SEBI REGISTERED
This is our personal view and this analysis
is only for educational purposes
Please consult your advisor before
investing or trading
You are solely responsible for any decisions you take on the basis of our research.
Intraday Long Setup | June 3rd 2025 | Valid Until Daily ClosePrice is retracing to a strong pivot zone (marked by the red box).
Structure remains bullish with potential for continuation after pullback.
The green box represents a high-probability long opportunity with tight risk control.
Watch for price reaction within the red zone. Entry only if confirmation (e.g., bullish engulfing, strong wick rejections) appears.
The setup expires at end of the daily candle close.
Intraday Long Setup | June 4th 2025 | Valid Until Daily ClosePrice is retracing to a strong pivot zone (marked by the red box).
Structure remains bullish with potential for continuation after pullback.
The green box represents a high-probability long opportunity with tight risk control.
Watch for price reaction within the red zone. Entry only if confirmation (e.g., bullish engulfing, strong wick rejections) appears.
The setup expires at end of the daily candle close.
