VWAP Flip Strategy–Most Accurate Setup for Intraday Trend Shift!Hello Traders!
One of the cleanest signs of intraday trend shift happens right at the VWAP — the volume-weighted average price. Most traders use VWAP as a trend guide, but they miss one powerful signal called the VWAP Flip .
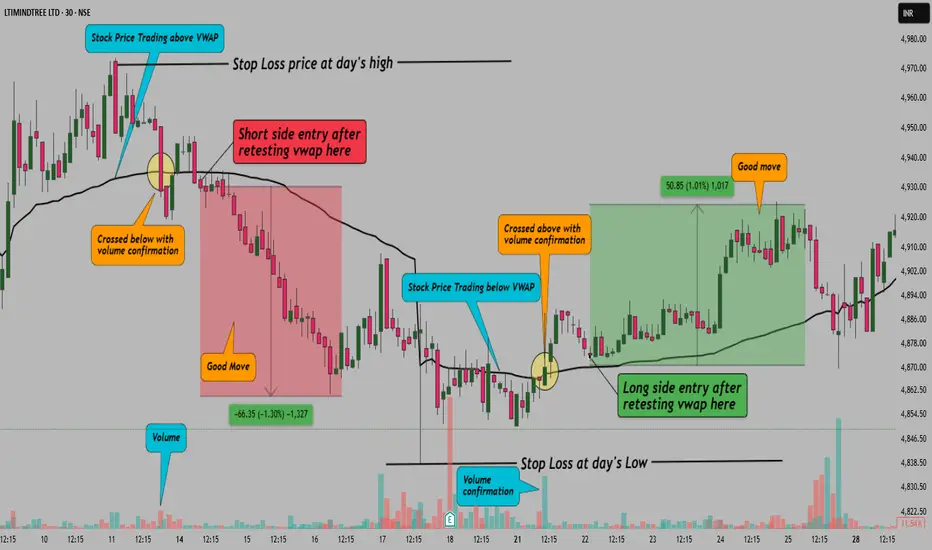
When price flips from staying below VWAP to breaking above and holding — or vice versa — it often marks the start of a fresh trend. And if volume supports the move, the accuracy becomes even stronger.
What is the VWAP Flip?
It’s when price has been consistently staying on one side of VWAP, and then crosses over with conviction and starts respecting the other side.
For example, if price was trading below VWAP all morning and then breaks above with a solid candle, retests, and holds — that’s a bullish VWAP flip.
Why This Strategy Works
VWAP reflects average trader sentiment: When price flips above, it shows buyers are gaining strength
It filters false breakouts: Flip + retest helps avoid fake moves during sideways markets
Volume confirms conviction: A flip with increasing volume shows strong intent behind the shift
How to Trade the VWAP Flip
Step 1: Identify whether price is respecting VWAP from one side
Step 2: Wait for price to flip — clean break and candle close on opposite side
Step 3: Look for a retest of VWAP. Entry should be near VWAP with small stop loss
Step 4: Exit at previous day’s high/low or next support/resistance zone
Entry + SL + Target (Example Setup):
Entry: On candle close and retest above VWAP
Stop Loss: Below retest candle low
Targets: 1:2 RR minimum or trail till trend continues
Note:
This setup has been identified using the 5-minute timeframe, as it offers better intraday structure for the VWAP Flip strategy. However, since TradingView does not allow drawings below 15-minute timeframe for sharing or publishing, I initially marked the levels and structure on the 5-minute chart, took a screenshot, and then placed it over the 30-minute chart for visual representation.
Rahul Tip:
Use VWAP Flip only in trending environments. Avoid it in flat days. Combine it with 5 EMA or volume spikes for extra confirmation. Also, mark high-impact news times to avoid random flips.
Conclusion:
VWAP Flip is one of the cleanest, low-risk, high-reward intraday setups when used with proper structure and confirmation. Practice spotting it in real time — and it might become your new favorite setup.
Have you used VWAP Flip before? Let me know your win rate or drop a chart example in comments.
Intradaysetup
Trading the Dip: My Nifty Options Setup for This Gap Down MarketHello Traders!
Hope you all are doing good.
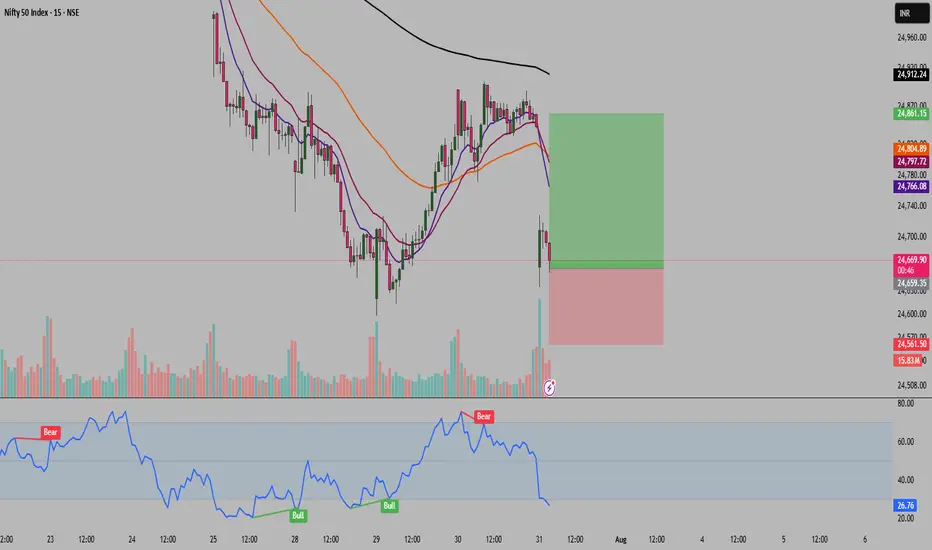
Today Nifty opened with a significant gap down. The reason? Fresh news about the US under Donald Trump’s policy imposing a 25% tariff on Indian goods. This triggered panic among investors, and we saw aggressive selling at the open.
But I believe this reaction could be short-lived. Local DIIs have been showing strong buying interest every single day, and I expect them to support the market again today. That’s why I’m looking for a potential intraday recovery from lower levels.
So instead of joining the panic, I’m planning a contra trade on Nifty.
Trade Setup: Buying naked Ce with stop loss
Buy Nifty 7th August 24650 CE, now at 180
Add 1 More lot around 155-160 levels if price dropss
Keep stop loss around 120
Targets will be 210/246/290++
Another Trade Setup: Options writing(selling) with hedging strategy
Bullish Iron Condor Setup (Neutral-to-Bullish View):
For traders who prefer risk-defined strategies, I’ve also deployed a bullish iron condor with a limited risk, targeting consolidation or moderate recovery by expiry.
Sell: 2x 25050 CE @ 44.45
Buy: 2x 25300 CE @ 17.30
Buy: 2x 24550 PE @ 103.60
Sell: 2x 24800 PE @ 217.95
Note:- All Strike from 7th Aug expiry
Key Metrics:
Max Profit: 21,225
Max Loss: 16,275
Breakeven Range: 24659 to 25191
Max RR Ratio: 1:1.3
Margin Required: ~2 lakhs Rs.
The idea here is to stay profitable if Nifty consolidates or mildly recovers over the next few sessions. If there’s no deep fall or sharp rally, this setup will benefit from theta decay and defined movement.
Risk Management Notes:
Strict stop loss is a must. Do not hold beyond SL under any condition
This is a contra trade, so avoid heavy positions
Recommended quantity: 1 or 3 lots only
Rahul Tip:
Market reacts fast to global headlines, but strong hands don’t panic. If your view is backed by logic and risk is managed, sometimes going against the crowd gives the best opportunities.
Conclusion:
The dip was sharp, but the reaction might be overdone. Let’s watch for signs of intraday strength. If buyers step in, this call option trade can work out well. Trade light, and trade with discipline.
Disclaimer: This idea is for educational purposes only. Do your own research before taking any trade.
Opening Range Breakdown – Intraday Bears’ Favorite Setup!Hello Traders!
Today, let’s explore one of the most reliable setups for intraday traders – the Opening Range Breakdown (ORB) . This strategy is widely used by professional traders to catch early downside momentum when the market shows weakness right after opening. If executed correctly, it offers quick profits and tight risk management. Let’s break down how it works and how to trade it with confidence.
What is Opening Range Breakdown (ORB)?
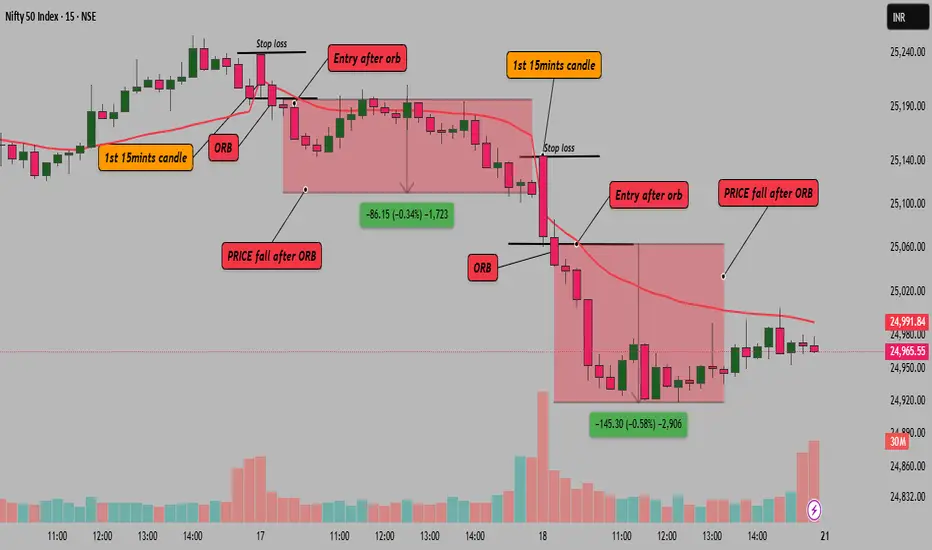
The ORB strategy focuses on the first 15 to 30 minutes of market open . The idea is to mark the high and low of this initial range and look for a breakdown below the low – which signals bearish pressure. This setup works best on volatile days or when there’s negative sentiment in global cues.
Mark the Opening Range:
Track the high and low of the first 15 or 30 minutes of the market open.
Wait for a Breakdown Candle:
Look for a strong bearish candle closing below the opening range low with rising volume.
Enter on Confirmation:
Take a short entry just below the breakdown candle with stop-loss above the opening range high.
Target Previous Day’s Support or VWAP:
Your exit target could be based on previous day’s support, VWAP, or risk-reward ratio like 1:2.
Volume Confirmation is Key:
Avoid low volume breakdowns. Strong volume is what separates real breakdowns from fake-outs.
Ideal Conditions for ORB
Gap Down Open or Weak Global Cues – ORB works well when sentiment is already negative.
High Beta Stocks or Indices like BankNifty – These respond sharply to breakdowns.
No Major Support Below the Breakdown Level – Clean charts increase trade reliability.
Risk Management Tip
Keep your position size small and risk predefined. Don’t chase entries. Let the candle confirm the breakdown and only then execute.
Conclusion:
ORB is a favourite among experienced traders due to its simplicity and effectiveness. If you’re an intraday bear looking for high-probability setups, Opening Range Breakdown is something you must master.
Have you used ORB before? Let me know your experience or results in the comments!
“Ghost Wick” Rejection Setup – Invisible Candle Setup from LTF!Hello Traders!
Today, let’s explore a powerful intraday price action concept that most traders completely miss — the “Ghost Wick” Rejection Setup . These are subtle but strong rejections that only show up on 1-min or 2-min charts , often disappearing or getting absorbed on 5-min or higher timeframes. If you’ve ever felt like your breakout failed but others caught it — this is what they saw!
What is the Ghost Wick Rejection Setup?
Appears Only on Lower Timeframes: You’ll notice sharp rejections with long wicks on 1-min or 2-min charts — but those wicks vanish on higher timeframes.
Happens at Key Levels: These setups often occur around VWAP, supply/demand zones, or previous highs/lows.
Used by Scalpers & Smart Money: Institutions and pro scalpers use these short-term traps to grab liquidity and reverse quickly.
How to Trade the Ghost Wick Setup
Watch Key Zones on 1–2 Min Chart: Look for long rejection wicks forming right at structure (VWAP, previous day’s high, etc.).
Wait for Confirmation Candle: Once the wick forms, wait for a strong opposite candle with higher volume or engulfing structure.
Enter with Tight SL: Enter at close of the confirmation candle. Place SL just above the wick (for shorts) or below (for longs).
Target Logical Zones: Go for quick 1:2 or 1:3 scalps — next support/resistance or VWAP reversion.
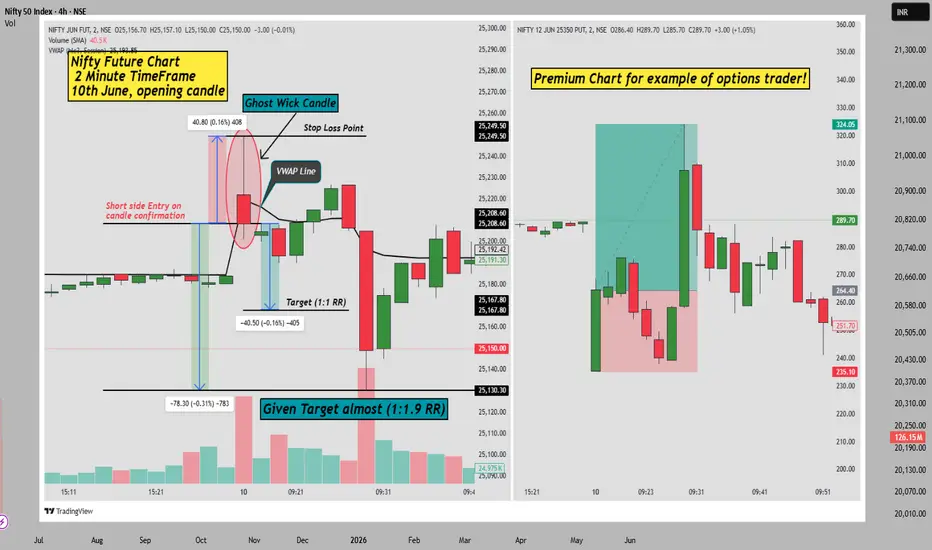
Real Example from Nifty Future Chart – 2 Min Timeframe (10th June Opening Candle)
In the chart above, you’ll see how a sharp rejection candle formed exactly at the VWAP line , followed by a breakdown. The “ghost wick” rejection triggered a precise short trade with a clean move downwards. The setup achieved nearly 1:1.9 RR , showing how accurate this rejection can be when spotted early.
Options Premium Chart on right side (Nifty 25350 PE)
To show how it impacts option Traders or scalpers — the 25350 PE premium spiked right after this rejection, hitting an exact 1:2 Risk-Reward target . It’s a perfect demonstration of how this setup works even for options traders, especially those trading momentum scalps.
Why This Setup Works
Retail Traders Miss It: Most people trade 5-min or 15-min charts and never see this trap setting up.
Algos Trigger Liquidity: These rejections are engineered to trap early breakout traders and reverse with force.
Scalping Precision: This setup allows tight stop losses with high R:R in just a few candles.
Rahul’s Tip
Use this only in high-volume environments — like market open or near key news events. Also, confirm with levels marked from higher timeframe. Don’t scalp in the middle of nowhere!
Conclusion
The “Ghost Wick” Rejection Setup is an advanced scalping trick that can massively improve your accuracy. It’s invisible to most — unless you’re watching closely on LTFs. Once you master it, you’ll never see price action the same way again.
Have you noticed ghost wicks before? Drop a 🕯️ in the comments if you’ve traded one!
If you found this post valuable, don't forget to LIKE and FOLLOW!
I regularly share real-world trading setups, actionable strategies, and learning-focused content — all from real trading experience , not theory. Stay connected if you're serious about growing as a trader!
Master This 9-21 EMA Setup & Ride Every Intraday Trend Like Pro!
Hello Traders!
If you’ve ever struggled to time entries during fast-moving markets, today’s post is for you. The EMA 9-21 Bounce Setup is a momentum-based strategy that gives high-probability entry points — especially in trending markets. Whether you’re a day trader or swing trader, mastering this EMA combo can help you ride the trend with better precision.
What is the EMA 9-21 Bounce Setup?
EMA 9 & EMA 21 Combination: These two exponential moving averages help identify short-term trend direction and dynamic support/resistance.
Bounce Confirmation: When price pulls back to the zone between EMA 9 and EMA 21 and shows a bullish or bearish reversal candle (like a hammer or engulfing), it often indicates continuation.
Trend Filter: Only trade in the direction of the overall trend (i.e., price above both EMAs in uptrend, below both in downtrend).
Live Chart Example from 20–21 May 2025 (Nifty50 Index):
Bearish Setup – 20th May, 11:15 AM:
-EMA 21 crossed above EMA 9 → Bearish crossover
-Price traded fully below both EMAs
-Index fell –246 pts (-0.99%)
-PE 24900 Option shot up +46.65%
Bullish Setup – 21st May, 9:30 AM:
-EMA 9 crossed above EMA 21 → Bullish crossover
-Price stayed above both EMAs
-Index gained +202 pts (+0.82%)
-CE 24900 Option gave +62.90% return
How to Trade It Effectively
Entry Point: Wait for the price to touch the EMA 9–21 zone and form a bullish reversal pattern (for long trades) or bearish pattern (for short trades).
Stop Loss: Place below the most recent swing low or high (depending on trade direction), slightly beyond the EMA 21.
Profit Target: Use previous swing highs/lows or a fixed risk-reward (like 1:2 or 1:3), depending on market volatility.
Volume Confirmation: Look for a volume spike on the bounce candle for stronger confirmation.
Why It Works So Well in Fast Markets
Dynamic Support/Resistance: EMAs adapt quickly to price movement, giving real-time guidance.
Momentum-Friendly: This setup thrives when trends are strong and pullbacks are short-lived.
Quick Signals: Perfect for scalpers and intraday traders needing fast setups in volatile sessions.
Rahul’s Tip
Avoid sideways markets! This strategy works best when there’s momentum. Always confirm the trend on a higher timeframe and never chase — wait for the bounce to come to your zone.
Conclusion
The EMA 9-21 Bounce Setup is a powerful addition to any trader’s toolkit. Simple, effective, and clean — it allows you to enter high-probability trades with confidence during trending markets.
Have you used this EMA combo in your strategy? Let’s discuss your experience in the comments!
If you found this post valuable, don't forget to LIKE and FOLLOW!
I regularly share real-world trading setups, actionable strategies, and learning-focused content — all from real trading experience, not theory. Stay connected if you're serious about growing as a trader!

CHoCH + FVG = Institutional Entry Point for Option Traders!Hello Traders!
Today, we’re diving into one of the most powerful Smart Money Concepts — combining CHoCH (Change of Character) with FVG (Fair Value Gap) to identify high-probability institutional entry zones. This setup works brilliantly for both equity and option traders , especially when you want to catch the move before the breakout.
What is CHoCH (Change of Character)?
CHoCH occurs when the market shifts from a bearish to bullish structure or vice versa. It marks the first sign that market structure is shifting , and smart money is potentially stepping in.
What is a Fair Value Gap (FVG)?
An FVG is an imbalance between buyers and sellers. When price moves sharply in one direction, it leaves behind an area (usually 1-2 candles) with no trading activity — that’s the gap smart money fills later to enter or add positions.
Why This Combo Works Like Magic
CHoCH gives confirmation that market direction is changing.
FVG gives the entry zone where big players are likely to buy or sell again.
High Risk-Reward : You’re entering close to where institutions enter — not chasing breakouts.
Ideal for Option Traders looking for momentum entries at discounted zones.
How to Trade This Setup
Wait for a CHoCH on the 5min/15min chart.
Mark the FVG zone created after CHoCH.
Enter near the FVG zone with confirmation (rejection candle, volume spike, or VWAP bounce).
Place stop loss below the FVG and target swing high or based on option premium chart.
Rahul’s Tip
Don’t just chase the breakout. Learn to identify where smart money accumulates before the rally. CHoCH + FVG = sniper-level precision for option scalpers.
Conclusion
This setup is becoming a go-to for institutional-style intraday traders. It’s clean, logical, and extremely efficient when executed with discipline. Start spotting these patterns and backtest your entries — you’ll be amazed by the results!
Have you tried CHoCH + FVG before? Let me know your experience in the comments!

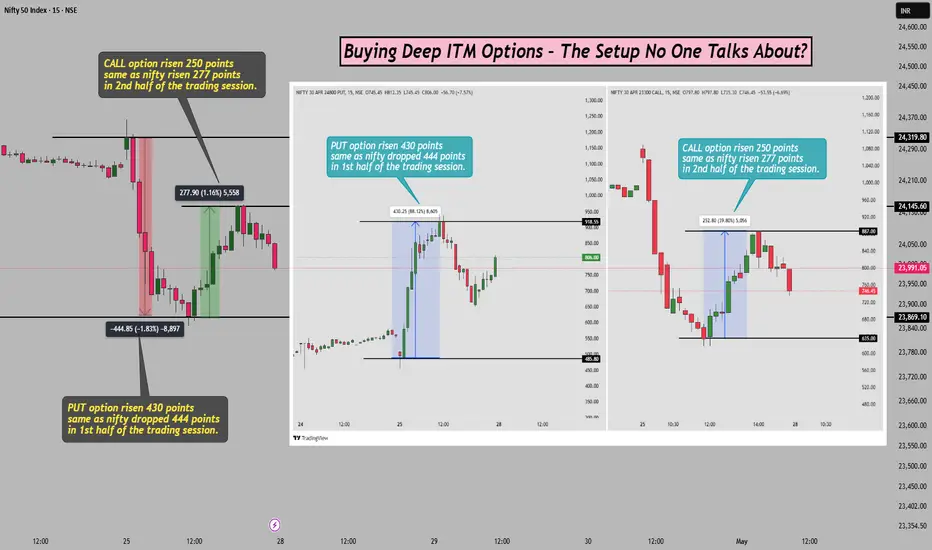
Buying Deep ITM Options – The Setup No One Talks About?Hello Traders!
When it comes to option buying, most traders are obsessed with OTM and ATM strikes for low premium and high returns. But very few talk about the hidden power of Deep In-The-Money (ITM) Options . Today, I’ll share a high-conviction directional setup where buying deep ITM options gives cleaner execution, better control, and higher probability of success — especially when you’re confident in trend direction.
Why Deep ITM Buying is a Game-Changer
Delta Advantage (0.8 to 1.0): Deep ITM options move almost 1:1 with the underlying, giving stock-like movement with less capital.
Less Impact of Theta Decay: Since time value is minimal, decay doesn’t hurt as much as OTM options.
Better Risk Management: With high delta and low extrinsic value, your SL and targets become more accurate.
The Ideal Setup to Buy Deep ITM Options
Step 1 – Identify a Strong Trending Day
→ Look for higher highs + higher lows (for longs), or lower highs + lower lows (for shorts)
Step 2 – Entry on Break + Retest or Trend Continuation Candle
→ Use price action patterns like bullish engulfing or breakout of flag pattern
Step 3 – Choose Deep ITM Option with 0.8–1 Delta
→ E.g., if Nifty is at 23,800, pick 23,300 CE or lower and do same for PE side as well.
→ You’re treating it like equity but with leverage
Step 4 – Risk-Reward & SL
→ SL just below structure (candle or VWAP)
→ RR should be minimum 1:2
Real Example(Nifty Chart Study)
On 25th April 2025, during the first half of the session, Nifty dropped by 444 points , and the Deep ITM PUT Option (24800PE) moved up by 430 points .
Later in the second half of the session, Nifty recovered by 277 points , and the Deep ITM CALL Option (23300CE) moved up by 250 points .
Notice how the Deep ITM options mirrored the index move almost 1:1, showcasing high delta impact with precision.
When NOT to Use This Strategy
Choppy or Low Volume Days: Deep ITM options need strong movement — sideways markets will kill the move.
High IV Environment (VIX > 15): Entry premiums may be inflated, making SL management tricky.
Rahul’s Tip
“If you’re 80% confident in your directional view, go Deep ITM instead of gambling with OTM.”
It’s how pros manage both reward and risk without getting crushed by decay.
Conclusion
Deep ITM Option Buying is rarely discussed but extremely powerful when used with clean setups and directional conviction. It behaves like equity, gives better control, and is ideal for short-duration intraday moves with high accuracy.
Have you ever tried Deep ITM options? Share your experience — let’s learn from each other in the comments!
If you found this post valuable, don't forget to LIKE and FOLLOW !
I regularly share real-world trading setups, actionable strategies, and learning-focused content — all from real trading experience, not theory. Stay connected if you're serious about growing as a trader!
The VWAP Bounce Strategy – BankNifty Traders’ Favourite Setup!Hello Traders!
If you love trading BankNifty, then you must’ve heard of the VWAP Bounce Strategy . It’s one of the most popular and reliable intraday setups used by professional traders. Simple to spot, easy to execute, and highly effective during strong trending days. Today, I’ll explain exactly how to use the VWAP bounce strategy to enter high-probability trades — with confidence and clarity.
What is VWAP & Why It Works?
VWAP (Volume Weighted Average Price) acts as a dynamic support or resistance level during intraday moves.
Institutional traders and smart money often watch VWAP for mean reversion entries or trend continuation setups .
In BankNifty, VWAP bounces happen frequently due to high volatility , offering clean risk-reward trades.
How to Trade the VWAP Bounce Strategy
Step 1 – Wait for a Trend to Establish
→ Price must be trading clearly above or below VWAP to confirm trend bias.
Step 2 – Let Price Pull Back to VWAP
→ Watch for a healthy retracement after a strong move. VWAP should act as a bounce zone.
Step 3 – Confirmation Candle Near VWAP
→ Look for a bullish/bearish engulfing, pin bar, or hammer candle on VWAP.
Step 4 – Entry, SL & Target
→ Enter after confirmation candle closes
→ SL: Below/above the candle or VWAP
→ Target: Recent high/low or 1:2 RR
Check the BANKNIFTY Chart above for practical example
When NOT to Trade This Setup
Inside CPR Day: Sideways market with no momentum? Avoid it.
Choppy Price Action Around VWAP: No clean bounce = no trade.
News-Driven Volatility: Sudden spikes may break VWAP unpredictably.
Rahul’s Tip
“VWAP bounce works best when there’s clean trend & confidence from smart money.” Combine with volume and candle structure — and never force the trade.
Conclusion
The VWAP Bounce Strategy is loved by intraday traders for a reason — it provides structure, clarity, and clean entries . Especially in fast-moving indices like BankNifty, it can be your edge if traded with discipline.
Have you tried this strategy? Share your win/loss experience in the comments — let’s grow together!

The Expiry Day “Premium Decay Trap” – This Setup Can Save You!Hello Traders!
Thursday comes, volatility spikes, and suddenly your option premium starts vanishing. Sound familiar? That’s the Expiry Day Premium Decay Trap — a classic scenario where most option buyers get trapped, and smart option sellers quietly eat the premium. Today, I’ll share a simple setup to avoid this trap and trade expiry days smartly .
Why Expiry Days Are Dangerous for Buyers
Rapid Theta Decay: Time value melts fast, especially in the second half of the day.
False Breakouts Trap Buyers: Market shows breakout moves, only to reverse within minutes.
Low VIX + High OI = STUCK OPTIONS: When volatility is low and OI is high, premiums don’t expand even with movement.
The Safe Setup to Trade Expiry Days
Step 1 – Wait for First 15-30 Min Candle to Form
→ Don’t rush in. Let price discovery settle.
Step 2 – Mark High/Low & CPR Levels
→ Use those as breakout zones. Avoid trading inside a narrow range.
Step 3 – Confirm with Option Chain
→ Entry only if there’s OI unwinding on one side and buildup on the other .
Step 4 – Trade Near ATM Options (Avoid Deep OTM)
→ Only buy when there's a confirmed breakout with volume.
Step 5 – Quick Entry, Quick Exit
→ No holding dreams. Exit at 30–40% move or when structure breaks.
Pro Tip for Sellers
Short Straddles/Strangles Work Best After 11:30 AM
→ Let direction settle, then start writing premiums once movement fades.
Always Use SL or Hedge Legs
→ One big move can wipe out entire profits — expiry day is not a gamble!
Rahul’s Tip
Don’t chase expiry moves. Let the market give you the setup — not your emotions. Entry after confirmation saves capital and confidence.
Conclusion
Expiry days are premium-eating monsters for careless buyers . But if you follow structure, watch OI, and stay quick on execution — you can still trade profitably and safely.
What’s your expiry day setup? Drop it in the comments and let’s grow together!

Doji Sandwich + Volume Spike = 10/10 Trades If You Spot It RightHello Traders!
Today, let’s talk about a highly underrated but powerful candlestick pattern — the Doji Sandwich . When this pattern appears with a volume spike , it can give you a high-probability breakout or breakdown setup . If you’ve ever missed strong moves because of late entries, this one’s for you.
Let’s decode how to spot it, trade it, and why it works so well.
What is the Doji Sandwich Pattern?
Structure: The pattern consists of three candles — a strong candle (bullish or bearish), followed by a Doji , and then another strong candle in the same direction as the first.
Indecision Trap: The Doji shows indecision, but the follow-up candle confirms that the previous trend will continue.
Reliability Boost: When supported by a volume spike on the third candle, it becomes a powerful confirmation of trend continuation.
How to Trade the Doji Sandwich Setup
Entry: Enter on the breakout of the third candle (closing above or below the Doji range).
Stop Loss: Place your stop loss just below the Doji (in bullish case) or above it (in bearish case).
Volume Confirmation: Make sure the third candle is accompanied by a visible volume spike — this confirms institutional activity.
Ideal Timeframe: 15min, 1hr, or Daily chart — depending on your trading style (intraday or swing).
When Does It Work Best?
Near support/resistance zones — as a continuation signal.
After a short pullback or consolidation .
In trending markets where volume confirms momentum.
Rahul’s Tip
Always combine price pattern + volume confirmation. A Doji Sandwich alone is good, but with a volume spike — it’s fire🔥. Don’t just watch it — prepare for it.
Conclusion
The Doji Sandwich pattern is one of those rare 10/10 setups when spotted correctly with volume. Simple, clean, and powerful — it can help you catch big moves early. Add it to your watchlist strategy, and you’ll never ignore this combo again!
Have you ever traded this pattern? Share your experience below, and let’s learn from each other!

Coforge Intraday SetupCoforge looks bullish above previous day high for atleast 1% target with SL given in chart.
After 1% can be trailed using 13 ema as stop loss on 5 min time frame.
Disclaimer: Only for entertainment purposes, not an investment advice.

HAL 28Nov | HourlyHAL is in bullish setup
Higher High Higher Low
Leading Diagonal Formation
Alert: MACD divergence
Previous day high can be a good entry for 4534-50-84 SL 4435
Disclaimer: Not Buy/Sell recommendation or advice. Just for educational/entertainment purpose.
For any market related decisions contact your financials advisor.

TorrntPharma Intraday 26 NovBullish setup with HH HL and trading above all EMA 13-48 on 5 and 15 min timeframe.
Long on Yesterday high with SL today day low for 1% gains min as target 1 and then trailing with 13 ema.
Only Long above yesterday high break of 5 min. If today low break first trade invalid.
Disclaimer: Only for entertainment purposes, not an investment advice.

BANKNIFTY Weekly swingsBanknifty is near it's base formation and one can follow these levels for intraday and for upcoming weeks. Mark on your charts for study.
NOTE: I'm not a SEBI REG. Study before investing.

Trent - Best Intraday stocks for tomorrow 14 Oct 2024 Trent has outperformed Nifty in past days and there is high probability of continuation of its performance.
So for tomorrow in my opinion it will be best for intraday trading but when to trade?
Condition 1- If price falls or opens gapdown then it will best to buy after support creation.
Condition 2- if opens flat or Little gapdown and moves upside towards previous trading sessions resistance then, price should take a halt at resistance levels then it will be good opportunity to buy at resistance break.
Condition 3- if price opens Gapup and creates a selling swing and test previous trading sessions resistance (which may act as a support) then after creating support or W PATTERN price will bounce

Bank Nifty Intraday ChartBanknifty Trading Between 41620-41250 level. If Breakdown we can see 41000 and lower. If Breakout Come 42000 and above can see.


TATACONSUMER 15M HEAD & SHOULDER SETUPA head and shoulders pattern—considered one of the most reliable trend reversal patterns—is a chart formation that predicts a bullish-to-bearish trend reversal.

Sun Pharma intraday trade setupTrading idea - Sun pharma - Intraday for 25 Apr
Buy Trade setup
buy above 927
SL - 924
Target - 931 / 938
Sell Trade Setup
Sell below 914
SL 917
Target 906

Intraday Trade For 21-4-22Intraday Trade in Sail.
- Falling wedge pattern with major support.
- Divergence at lower timeframe indicates breakout.
- For safer side take the entry after Breakkout.
- Aggressive trader take trade at conversion point also as there is 2 confirmations(major support and Bullish divergence).
Thankyou.

Nifty 50 setup today (22 Mar 22)Today Nifty values :
if the nifty value go upwards , the value might reach 17145
if the nifty value go downward , the value might reach 16900

Nifty 50 setup today (21 Mar 22)Today Nifty values :
if the nifty value go upwards , the value might reach 17355
if the nifty value go downward , the value might reach 17100

Bank Nifty value today (21 Mar 22)Today Banknifty values :
if the Banknifty value go upwards , the value might reach 36600
if the Banknifty value go downward , the value might reach 35800
