VWAP Flip Strategy–Most Accurate Setup for Intraday Trend Shift!Hello Traders!
One of the cleanest signs of intraday trend shift happens right at the VWAP — the volume-weighted average price. Most traders use VWAP as a trend guide, but they miss one powerful signal called the VWAP Flip .
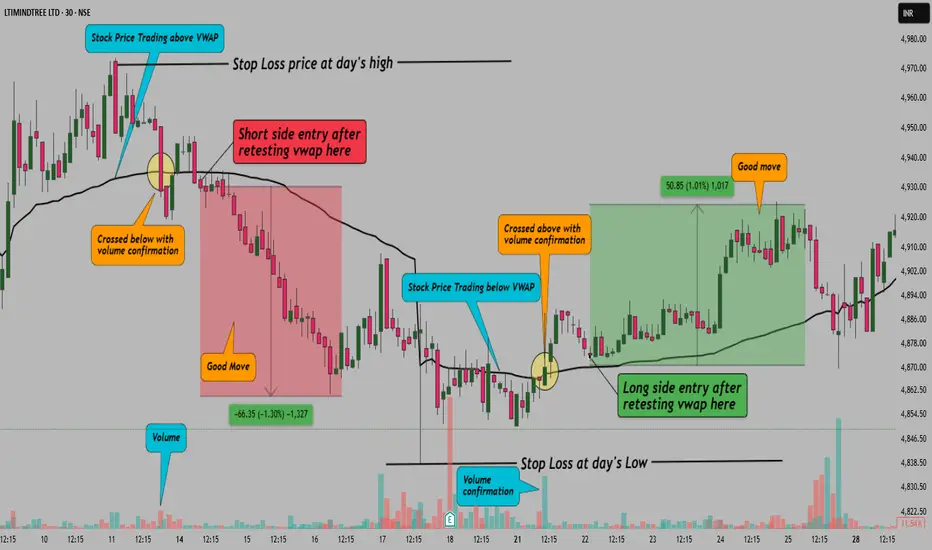
When price flips from staying below VWAP to breaking above and holding — or vice versa — it often marks the start of a fresh trend. And if volume supports the move, the accuracy becomes even stronger.
What is the VWAP Flip?
It’s when price has been consistently staying on one side of VWAP, and then crosses over with conviction and starts respecting the other side.
For example, if price was trading below VWAP all morning and then breaks above with a solid candle, retests, and holds — that’s a bullish VWAP flip.
Why This Strategy Works
VWAP reflects average trader sentiment: When price flips above, it shows buyers are gaining strength
It filters false breakouts: Flip + retest helps avoid fake moves during sideways markets
Volume confirms conviction: A flip with increasing volume shows strong intent behind the shift
How to Trade the VWAP Flip
Step 1: Identify whether price is respecting VWAP from one side
Step 2: Wait for price to flip — clean break and candle close on opposite side
Step 3: Look for a retest of VWAP. Entry should be near VWAP with small stop loss
Step 4: Exit at previous day’s high/low or next support/resistance zone
Entry + SL + Target (Example Setup):
Entry: On candle close and retest above VWAP
Stop Loss: Below retest candle low
Targets: 1:2 RR minimum or trail till trend continues
Note:
This setup has been identified using the 5-minute timeframe, as it offers better intraday structure for the VWAP Flip strategy. However, since TradingView does not allow drawings below 15-minute timeframe for sharing or publishing, I initially marked the levels and structure on the 5-minute chart, took a screenshot, and then placed it over the 30-minute chart for visual representation.
Rahul Tip:
Use VWAP Flip only in trending environments. Avoid it in flat days. Combine it with 5 EMA or volume spikes for extra confirmation. Also, mark high-impact news times to avoid random flips.
Conclusion:
VWAP Flip is one of the cleanest, low-risk, high-reward intraday setups when used with proper structure and confirmation. Practice spotting it in real time — and it might become your new favorite setup.
Have you used VWAP Flip before? Let me know your win rate or drop a chart example in comments.
Intradaystrategy
EMA Pullback Entry – The Cleanest Setup for Trend Followers!Hello Traders!
In today’s post, let’s explore one of the most reliable and beginner-friendly setups — the EMA Pullback Entry . If you’re a trend follower looking for clear, rule-based entries , this strategy will become a go-to in your toolkit. It helps you avoid chasing breakouts and instead ride strong trends with precision entries during pullbacks .
What is EMA Pullback Entry?
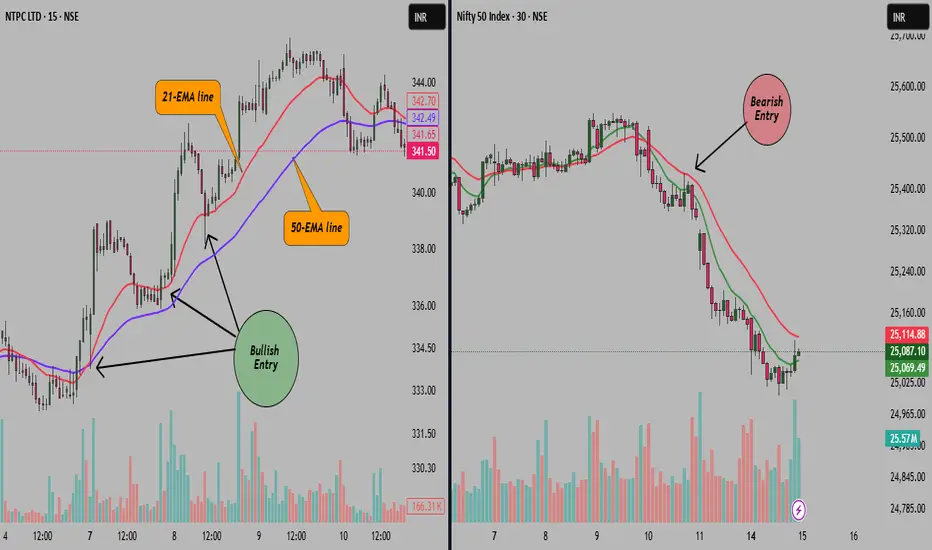
It’s a trend continuation strategy where traders use Exponential Moving Averages (EMAs) — typically the 21 EMA and 50 EMA — to identify the trend and wait for the price to retrace (pull back) into the moving average zone before continuing in the direction of the trend.
How to Trade the EMA Pullback Setup
Identify the Trend: Use a 21 EMA and 50 EMA on your chart. A bullish trend is confirmed when 21 EMA is above 50 EMA and price stays above both. Opposite for bearish.
Wait for a Pullback: Let the price retrace toward the EMAs without breaking below/above them significantly.
Look for Confirmation Candle: Wait for a bullish (or bearish) confirmation candle near EMAs — like a Pin Bar, Engulfing, or Doji rejection.
Entry & Stop Loss: Enter after confirmation. Place a stop-loss just below the pullback low (for long) or high (for short).
Target: Aim for previous swing high/low or use 1:2 risk-reward ratio.
Why It Works
Trend Is Your Friend: You’re trading with the trend, not against it.
Clear Visual Clarity: EMAs help you spot dynamic support/resistance zones.
Disciplined Entry: You wait for price to come to you, not chase it.
Rahul’s Tip
“The best trades often come to those who wait.” Don’t jump on every candle — let the price respect your EMAs, then strike.
Conclusion
The EMA Pullback Entry is a simple yet powerful setup that can give you high-probability trades in trending markets. Whether you trade intraday or swing, this strategy can help you time entries better and stay disciplined.
Have you tried this setup? Share your experience or ask questions in the comments – let’s grow together!
NIFTY Index Intraday Levels(For Educational purpose) 23/05/2025📈 Nifty Intraday Trade Setup – 23/06/2025 (Monday)
🕒 Timeframe: 1-Min Chart
📊 Market Outlook: Volatile with directional bias
🔼 Buy Above: 25,150 (with strong volume)
🎯 Target 1: 25,220
🎯 Target 2: 25,300
🛑 Stop Loss: 25,070
⚠️ Entry only after 5-min candle closes above 25,150
🔽 Sell Below: 24,960 (on breakdown)
🎯 Target 1: 24,880
🎯 Target 2: 24,800
🛑 Stop Loss: 25,040
⚠️ Only if price fails to hold 25,000 zone
📍 Key Levels to Watch:
🔹 Resistance: 25,150
🔹 S/R Flip Zone: 25,000 – 25,040
🔹 Support: 24,880 – 24,800
🔹 Demand Zone: 24,680
📌 Pro Tips:
✅ Watch opening 15 mins carefully
✅ Use VWAP & EMA (20/50) for trend confirmation
✅ Trade with discipline, not emotion

NIFTY BANK Intraday levels (Educational purpose only)📈 Upside Trade Setup (Long Entry):
Buy Above: 55,850
Entry Confirmation: 1-minute candle close above 55,850 with volume
Targets:
🎯 Target 1: 55,950
🎯 Target 2: 56,050
🎯 Target 3: 56,160
Stop Loss: 55,780
📉 Downside Trade Setup (Short Entry):
Sell Below: 55,700
Entry Confirmation: Strong red candle close below 55,700
Targets:
🎯 Target 1: 55,600
🎯 Target 2: 55,500
🎯 Target 3: 55,400
Stop Loss: 55,780

How to Use India VIX to Size Your Positions!Hello Traders!
Position sizing is one of the most ignored aspects of trading, yet it’s what separates consistent traders from gamblers. Today, let’s talk about a powerful tool many overlook: India VIX . When used correctly, VIX helps you adjust your position size based on market volatility , keeping your risk in check and improving your win rate.
What is India VIX?
India VIX = Volatility Index: It measures the expected volatility in Nifty for the next 30 days based on options pricing.
Higher VIX = Higher Fear: A rising VIX indicates uncertainty, panic, and more wild moves.
Lower VIX = Calm Markets: A falling VIX reflects confidence, low volatility, and tight price action.
Why Position Sizing Should Depend on VIX
High VIX Days (Above 16–18): Markets are more volatile. Reduce your position size to control your stop-loss risk.
Low VIX Days (Below 12–13): Markets are calmer. You can size up slightly because expected range is tighter.
Helps Avoid Overleveraging: Using the same lot size in all volatility zones is a recipe for disaster.
Rahul’s Easy VIX-Based Sizing Rule
VIX < 13 → Normal Size
→ You can use your standard lot size, as market is stable.
VIX 13–17 → 75% Size
→ Slightly reduce position to handle range expansion.
VIX > 17 → 50% or Less
→ Market is aggressive, reduce size and tighten risk control.
Real Impact on Traders
Avoid Big Drawdowns: A good trade in high VIX can still hurt due to huge slippage or wide stop-losses.
Smoother Equity Curve: Smaller positions in wild markets help protect capital, while bigger trades on calmer days optimize returns.
Confidence to Hold Longer: You can hold with peace of mind when sizing matches market mood.
Conclusion
India VIX is not just an index — it’s a risk barometer. Use it to fine-tune your trade size, especially if you're trading options, intraday setups, or expiry-based strategies. Don’t just focus on entries — manage your size smartly and stay in the game longer!
How do you adjust your size during high volatility? Let’s discuss in the comments!

Golden Rejection Candle Strategy–Catch Explosive Intraday Moves!Golden Rejection Candle Strategy – Catch Explosive Intraday Moves Like a Pro!
Hello Traders!
Are you tired of buying options and watching premiums die slowly?
Or chasing breakouts that reverse the moment you enter?
Here’s your solution – the Golden Rejection Candle Strategy , designed especially for option buyers who want timed entries, fast momentum, and defined risk .
What is a Golden Rejection Candle?
A special candlestick that forms when price hits a strong level (like VWAP, trendline, or demand/supply zone) and gets instantly rejected.
It leaves behind a long wick (shadow), showing that buyers or sellers stepped in with force .
This candle often marks the start of a sharp intraday reversal .
It's not just a random wick — it’s a smart money footprint .
Live Chart Example – Nifty Spot vs Option Premium (23950 CE)
Date: 9th May 2025
Timeframe: 1 min (Spot), 1 min (Options)
Spot Chart Setup: Nifty approached a marked green support zone and created a strong wick rejection with a small body candle — classic sign of buyers defending the level.
Confirmation Candle: The next candle broke above the rejection candle’s high, confirming the reversal setup.
Premium Reaction: On the 1-min ATM Option chart (23950 CE), premiums jumped from 270 to 344 – a clean 26% gain within minutes.
Risk-Reward Snapshot: Entry was at breakout, SL just below rejection wick, and target hit in a single momentum burst — the kind of move option buyers live for.
How to Trade It as an Option Buyer
Choose the Right Strike: Use ATM or slightly ITM options to get faster movement when price reverses.
Entry Strategy: Wait for the next candle to break the rejection candle’s high/low. No break = No trade.
SL Placement: Keep it just beyond the wick. Small loss if wrong, big reward if right.
Exit Plan: Aim for intraday resistance/support or spike-based exits — option premiums often give quick moves post-rejection.
What NOT to Do:
Don’t enter on the rejection candle itself — wait for confirmation.
Avoid trading this pattern in low volume or middle of the range.
Don’t hold blindly — if premium spikes, take the money and run!
Rahul’s Tip:
“Sudden reversals are where option buyers make money — not slow trends. The rejection candle shows intent. The breakout shows confirmation. Combine both.”
Conclusion:
The Golden Rejection Candle Strategy gives you an edge that most random trades lack — timing, context, and structure.
If you're an option buyer, this can be your go-to setup to avoid traps and enter only when smart money steps in.
No more guessing. No more fear.
Just clean, price-action-based entries that make sense.
👇 Have you ever used rejection-based setups? Drop your favorite trade below! Let’s learn together.
If you found this post valuable, don't forget to LIKE and FOLLOW!
I regularly share real-world trading setups, actionable strategies , and learning-focused content — all from real trading experience , not theory. Stay connected if you're serious about growing as a trader!

Fear-Greed Loop–How Your Mind is Programmed to Fail in Trading!Hello Traders!
Today, let’s break down one of the most powerful traps in trading psychology – the Fear-Greed Loop . This loop is why so many traders lose money, even with good setups and solid strategies. Understanding this can be the difference between being stuck in emotional trades and becoming a consistent trader.
What is the Fear-Greed Loop?
The Fear-Greed Loop is a cycle that most retail traders fall into:
Greed takes over when the market moves in your favor, making you ignore your targets and hold for “just a bit more.”
Fear kicks in when the market reverses, and instead of exiting with small gains or small losses, you freeze, hoping it will bounce back.
This leads to poor decisions, such as revenge trading, early exits, and holding onto losing trades.
How to Break the Loop
Set predefined rules for entries, exits, and stop-loss. Don’t rely on emotions.
Use position sizing that keeps your mind calm, even when trades don’t go your way.
Journal your emotions after each trade – this reveals recurring patterns and helps fix behavior.
Don’t chase profits . Consistency and discipline bring long-term gains, not excitement.
Rahul’s Tip
When in doubt – pause . The best traders don’t trade all the time, but they’re always watching, learning, and acting only when the odds are in their favor.
Conclusion
If you keep losing despite having good setups, the problem may not be the strategy – it’s the loop. The Fear-Greed cycle is built into us , but the pros learn to master it. Now it’s your turn to take control.
Have you experienced this loop before? How did you overcome it? Drop your thoughts in the comments!

Why Market Moves Against You After Entry–It’s Not a Coincidence!Hello Traders!
Ever felt like the moment you enter a trade, the market just turns against you? You’re not alone. Today, we’ll break down why this happens and how you can avoid getting trapped. This common phenomenon is not just bad luck — it’s often a result of liquidity hunting, stop-loss triggering, and retail behavior predictability .
The Real Reason Behind Entry Reversals:
Liquidity Zones Near Obvious Entry Areas: Most traders enter at breakout or breakdown levels with tight stop-losses. Market makers and institutions know this and target these zones to fill their large orders.
Stop-Loss Clusters = Opportunity: When many traders place SLs at the same level, it creates a liquidity pool. Big players trigger these to generate volatility and enter at better prices.
Retail Predictability: Most traders use similar strategies – entering on breakout candles, using fixed SLs, or chasing momentum. Algos are trained to identify these patterns and act accordingly.
No Confirmation Entry: Entering without waiting for confirmation — like candle close, volume spike, or retest — increases the chances of being trapped.
How to Avoid Getting Trapped:
Don’t Enter at Obvious Levels: Instead of breakout candle entry, wait for retest or structure confirmation.
Use Liquidity Awareness: Identify where other traders may be placing SLs — avoid entering right before those levels.
Watch Volume and Price Behavior: Sharp moves on low volume are often traps. Entry should align with volume strength.
Wait for Retests: A retest after breakout/breakdown gives better R:R and filters out fakeouts.
Conclusion:
The market isn’t random — it’s designed to hunt the predictable. If you want to stay ahead, start thinking like the smart money. Avoid entering at the obvious point, understand where liquidity lies, and build a habit of confirmation-based trading.
Have you ever faced a market reversal just after your entry? Let’s talk about your experience and how you manage such traps in the comments below!

11:30 AM Secret: Intraday Reversal Strategy That Actually Works!Post 11:30 AM Reversal Strategy for Intraday Traders
Hello Traders!
If you’ve been trading intraday for a while, you’ll know one thing — after the initial morning volatility, the market often slows down… and then suddenly, around 11:30 AM to 12:30 PM, something shifts. This is when many smart traders enter the game using the Post 11:30 AM Reversal Strategy . Today, let’s decode this powerful and often overlooked setup that can help you catch trend changes with great timing!
Why the 11:30 AM Time Slot Matters
Volume Stabilizes: By 11:30 AM, the morning rush has faded, and smart money starts positioning.
Morning Trend Exhaustion: Early trends often reverse around this time, especially if driven by emotion or news.
Institutional Activity Begins: FII and DII orders start reflecting in price action from late morning onward.
How to Trade the Post 11:30 AM Reversal
Step 1 – Identify Overextended Morning Move
→ Look for a strong trend from market open that seems to be losing steam by 11:15–11:30 AM.
Step 2 – Look for Reversal Candlestick Pattern
→ Watch for doji, hammer, inverted hammer, or engulfing candle around key support/resistance zones.
Step 3 – Confirm with Volume or RSI Divergence
→ Volume drying + divergence in RSI/MACD = extra confirmation of possible reversal.
Step 4 – Plan Entry, SL, and Target
→ Entry after confirmation candle close
→ Stop Loss: Just below/above the reversal candle
→ Target: VWAP, previous day high/low, or risk-reward 1:2
Live Chart Example
In the attached Nifty chart, look how: On multiple days, the 11:30 AM candle marked major reversal points.
RSI divergence (bearish & bullish) around that time added confirmation.
Each reversal led to 80–230+ point moves post 11:30 AM, making this a high-probability window to watch.
When This Setup Works Best
On Trend Days with Sharp Morning Moves
→ Works well when the market stretches too far, too fast by 11:30 AM.
On News or Event-Driven Opens
→ If early move was driven by gap-up/down or news, reversals often happen in late morning.
Rahul’s Tip
“Don’t chase early volatility — observe the market structure till 11:30 AM, then trade with clarity and precision.”
This one habit can change your intraday game forever.
Conclusion
The Post 11:30 AM Reversal Strategy is a timing-based edge that allows you to trade like a sniper, not a machine gun. Add it to your intraday toolbox and use it with discipline and confirmation — you'll be surprised how often it works!
Have you ever noticed this timing-based shift in trend? Let’s discuss your experience in the comments!
If you found this post valuable, don't forget to LIKE and FOLLOW !
I regularly share real-world trading setups, actionable strategies, and learning-focused content — all from real trading experience, not theory. Stay connected if you're serious about growing as a trader!

Sell Options After 12:30 PM? Use This “Theta Killer” Setup!Hello Traders!
We all know that time decay (Theta) accelerates in the second half of the trading day — especially post 12:30 PM. But most traders either miss this golden window or use the wrong strategy. Today, I’m sharing my favorite “Theta Killer” Setup to sell options with high confidence after 12:30 PM , using pure logic, structure, and risk control.
Why Post 12:30 PM is a Sweet Spot for Option Sellers
Theta Decay Accelerates: Option premiums melt faster in the 2nd half, especially on expiry week.
Market Direction is Often Clear: By now, breakouts have happened or ranges are set.
Low Volatility = Premium Traps: Perfect time to eat theta with minimal risk.
The “Theta Killer” Strategy – Step by Step
Step 1 – Identify a Stable Range or Confirmed Trend
→ If market is sideways, look for VWAP + CPR compression .
→ If trending, identify break-retest zones.
Step 2 – Check OI Data & VIX
→ Low VIX (<14) + OI buildup on both CE & PE sides = perfect theta trap.
Step 3 – Deploy Short Straddle or Strangle
→ Choose ATM (Straddle) or OTM (Strangle) strikes with high OI and low IV.
→ Make sure the range is unlikely to break in the last 2 hours.
Step 4 – Exit Rules
→ Exit by 3:10 PM or when you hit 60–70% profit
→ SL = 30% of combined premium or breakout of your defined range.
Bonus Tip – Hedge If Needed
Buy deep OTM CE & PE as insurance
Adjust position into Iron Fly if market starts compressing further
Rahul’s Tip
“Selling options post 12:30 isn’t about volume — it’s about timing decay.” Let the market do nothing… and you profit from it!
Conclusion
This “Theta Killer” post-lunch strategy is ideal for traders who want low-risk, time-decay-focused profits . It’s not about prediction — it’s about structure, timing, and letting Theta do the work.
Have you tried trading after 12:30 PM? What’s your go-to setup? Drop your style in the comments!

Trade Only 1 Setup a Day – Here’s the One I Use!Hello Traders!
Ever heard the phrase: “Less is more” ? That applies perfectly to intraday trading. Chasing multiple setups often leads to overtrading, emotional decisions, and avoidable losses . Today, I’ll share why I prefer trading just one high-quality setup a day — and the exact one I personally use to stay consistent and stress-free.
Why Just One Setup a Day Works Wonders
Focus = Better Execution: When you wait for your setup, you don’t get distracted by noise.
Avoids Overtrading: No revenge trades, no chasing — just clean, planned execution.
Improves Risk Management: With one trade, you manage position sizing, SL, and RR with more clarity.
The Setup I Personally Use (VWAP + CPR Rejection Strategy)
Step 1 – Mark CPR + VWAP Zones
→ CPR gives range reference, VWAP shows volume-weighted fair value.
Step 2 – Wait for Rejection or Reversal from Zone
→ Look for price rejecting CPR or VWAP with a strong reversal candle (e.g., engulfing, pin bar, etc.)
Step 3 – Entry with Confirmation + SL
→ Enter only after breakout candle closes beyond the rejection level
→ SL = just above/below the zone
→ Target = 1:2 or nearest support/resistance
Why I Stick to This Setup
It Works Across Indices: Bank Nifty, Nifty, and even stocks.
Clear Risk-Reward Ratio: I know my exit before I enter.
Less Screen Time, More Peace: Once the trade is done, I’m done.
Rahul’s Tip
The market gives hundreds of signals, but only a few are clean. Trade one that fits your rulebook and let the rest go. Discipline > Drama.
Conclusion
You don’t need 10 trades a day to be profitable. You just need one trade with logic, structure, and discipline . Master one setup, build confidence, and let consistency build your capital.
What’s your favorite intraday setup? Drop it in the comments and let’s share ideas!

Coforge Intraday SetupCoforge looks bullish above previous day high for atleast 1% target with SL given in chart.
After 1% can be trailed using 13 ema as stop loss on 5 min time frame.
Disclaimer: Only for entertainment purposes, not an investment advice.

PNB, Intraday View for 5-JulyContinuously the price is facing resistance from the level of 122 and the price has failed to close above the level of 122. But today we have a very weak negative candle. So, the trend is negative with weak strength.
Disclaimer: This is my pre market analysis and my trading journal. Not a suggestion to buy or sell.

HDFC Analysis for 2nd January 2024HDFC follow a trendline as per I draw.
Nearest strong Support at :1696
If tomorrow price break the trend line then your buying entry will be available after price settle up 1705.
Next Support area 1684.55
MACD and RSI is indicate bearish for intraday.
In a day timeframe Log term HDFC is bullish . If you are an investor then you can buy on dip.

TMB Tamilnadu Merch BankWatchout for the Levels in #TMB Bank. wait for the price for come to the Levels mentioned in chart and also Price action to execute the trades.
Maintain Stoploss !

D E E P A K N T RDEEPAKNTR broke above ascending wedge pattern on hourly chart with good volumes.
Could be bought wih mentioned stoploss & target.

Siemens Analysis Stock is trading in higher high pattern maintaining supportive trendline, follow chart for proper support and resistance levels. Ready to break ATH.

Castrol India Analysis Stock has given huge BO on daily chart with strong volume, follow chart for proper entry and exit levels.

Tata Steel Analysis Stock is near to BO level on daily chart with good volume build up, follow chart for proper support and resistance levels.

Nifty March Futures analysis on 30m and 4h time frameTechnical Data - Negative (30m and 4h charts)
Intraday Chart
The price is far away from 20ema line. Both of them will try to touch each other by Time Wise Correction or Price Wise Correction.
So on intraday level a small recovery might be seen.
Swing Chart
On 4h chart the technical data shows the weakness in the chart. A new low of this swing can be tested this week.
Thanks
Er. Simranjit Singh Virdi

Sbin Intraday Chart Sbin Intraday Chart. Stock near Resistance zone. If Breakout Come we can see 570,580+ target.

Most Easy N Profitable StrategyThis is most easy n Very Powerful profitable strategy specially for Intraday OPTIONS Traders & Scalpers.... Just know how to use it correctly....

Bank Nifty Intraday ChartBanknifty Trading Between 41620-41250 level. If Breakdown we can see 41000 and lower. If Breakout Come 42000 and above can see.
