Texmaco Rail 30 mins TF Price Action AnalysisAnalysis is valid for 30th Jan to 7th Feb trading week only
Refer to the trading logic and entry / exit levels shown on the chart
Happy trading!
Intradaytrade

Intraday Long Setup | Jan 28th 2026 | Valid Until Daily ClosePrice might retrace to a strong pivot zone.
Structure remains bullish with potential for continuation after pullback.
Tight risk control.
Watch for price reaction within the red zone. Entry only if confirmation appears
The setup expires at end of the daily candle close.

Next week: Will gold listen to the Fed… or the White House?🔎 Context
Next week could be highly volatile as monetary policy and geopolitics converge.
Donald Trump signaled a potential 100% tariff on Canadian goods if Canada moves closer to trade deals with China—raising trade-war risks.
At the same time, military assets are being deployed en masse around Iran, heightening concerns that tensions could escalate.
👉 Safe-haven flows may return, with gold potentially opening the week gap-up and early buying.
🧠 Quick take
Primary trend: Bullish
At elevated prices: a short, sharp shakeout is possible to absorb liquidity
No top/bottom calls—watch price reactions at key zones
📌 Key levels to watch
🟢 Supports: 4920–4900 | 4890–4882 | 4850–4830 | 4660–4640
🔴 Observation resistances: 5006–5030–5090 | 5110–5115 | Current ATH
🎭 Weekly scenarios (reference only)
Early week: Gap-up / early push
Pre-FOMC: Chop & liquidity sweep
Then: Deep shakeout or base-building and continuation
👉 Distribution at the top—or just a pause before the next leg higher?

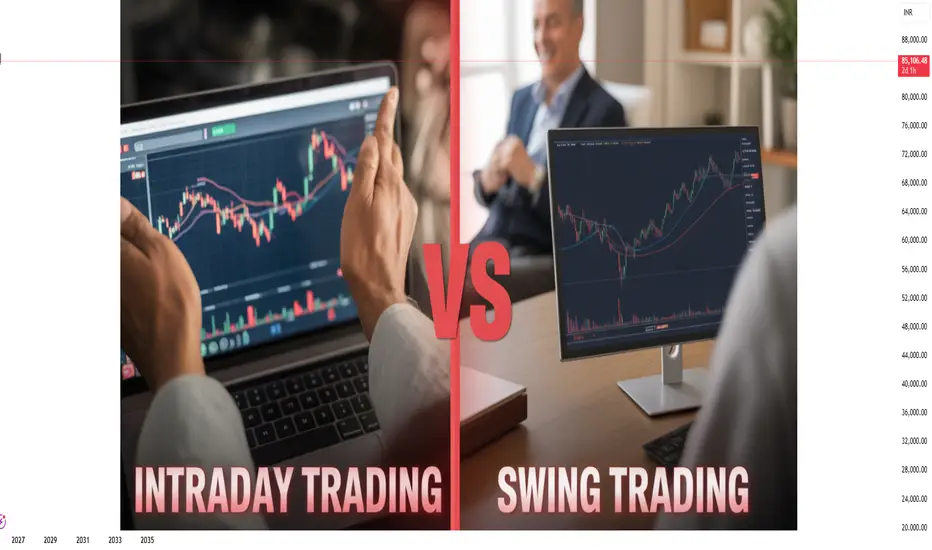
Intraday Trading vs. Swing Trading: A Detailed Comparison1. What Is Intraday Trading?
Intraday trading, also known as day trading, involves buying and selling financial instruments within the same trading session. All positions are closed before the market closes, and no trades are carried overnight.
Intraday traders profit from small price fluctuations using high volume, leverage, and precise timing. The focus is on short-term momentum, liquidity, and volatility.
Key Characteristics of Intraday Trading
Trades last from a few seconds to a few hours
No overnight risk
High frequency of trades
Requires continuous screen monitoring
Strong dependence on technical indicators
Sensitive to news and market sentiment
2. What Is Swing Trading?
Swing trading aims to capture short- to medium-term price swings over several days to a few weeks. Positions are held overnight and sometimes across market cycles.
Swing traders rely on trend analysis, support and resistance levels, and market structure rather than minute-to-minute price action.
Key Characteristics of Swing Trading
Trades last from 2 days to several weeks
Positions are held overnight
Lower trade frequency
Less screen time required
Combination of technical and fundamental analysis
Focus on broader market trends
3. Time Frame and Trade Duration
Intraday Trading
Time frames used: 1-minute, 5-minute, 15-minute charts
Trades aim to capture quick price movements
High pressure due to fast decision-making
Traders must act instantly on signals
Swing Trading
Time frames used: Daily, 4-hour, and weekly charts
Trades allow time for trends to develop
More patience required
Decisions can be planned after market hours
4. Capital Requirement and Leverage
Intraday Trading
Often requires higher capital
Leverage is commonly used
Brokers offer margin benefits for intraday trades
Small adverse moves can cause quick losses
Swing Trading
Lower leverage compared to intraday
Less dependence on margin
Suitable for traders with moderate capital
Lower risk of forced liquidation
5. Risk Exposure and Volatility
Intraday Trading Risks
Sudden price spikes
Slippage during high volatility
Emotional stress due to rapid price movement
Overtrading risk
Swing Trading Risks
Overnight gap risk
News and earnings impact
Broader market risk
Requires wider stop-losses
Despite overnight risk, swing trading often has better risk-to-reward ratios than intraday trading.
6. Profit Potential and Consistency
Intraday Trading
Smaller profits per trade
Requires many successful trades for consistency
High transaction costs (brokerage, taxes)
Suitable for traders seeking daily income
Swing Trading
Larger profit targets
Fewer trades, higher quality setups
Lower transaction costs
Better suited for wealth building
7. Technical Analysis Tools Used
Common Intraday Indicators
VWAP (Volume Weighted Average Price)
Moving Averages (9, 20 EMA)
RSI (short-period)
MACD (fast settings)
Order flow and volume profile
Common Swing Trading Indicators
Support and resistance
Fibonacci retracement
Trendlines and channels
RSI (14-period)
Moving averages (50, 100, 200)
Swing traders rely more on price action and structure, while intraday traders focus on speed and momentum.
8. Psychological Demands
Intraday Trading Psychology
High stress and pressure
Requires emotional discipline
Fear and greed act faster
Quick recovery from losses is essential
Swing Trading Psychology
Requires patience and trust in analysis
Managing uncertainty overnight
Avoiding panic due to short-term noise
More suitable for calm personalities
Psychology often determines success more than strategy.
9. Lifestyle and Time Commitment
Intraday Trading
Full-time commitment
Requires presence during market hours
Not suitable for working professionals
Highly demanding mentally
Swing Trading
Part-time friendly
Ideal for professionals and students
Analysis can be done after market hours
Better work-life balance
10. Market Conditions Suitability
Intraday Trading Works Best When:
Market is highly volatile
Strong intraday trends exist
Liquidity is high
News-driven moves occur
Swing Trading Works Best When:
Clear trends are present
Markets are stable
Volatility is moderate
Broader market direction is defined
11. Taxation and Costs (General View)
Intraday trading usually attracts higher taxes and transaction costs
Frequent trading increases brokerage expenses
Swing trading is more tax-efficient due to lower turnover
(Tax rules vary by country and should be checked locally.)
12. Who Should Choose Intraday Trading?
Intraday trading is suitable for traders who:
Can dedicate full market hours
Handle high stress and fast decisions
Have strong discipline and execution skills
Prefer daily profit opportunities
13. Who Should Choose Swing Trading?
Swing trading is suitable for traders who:
Prefer planned trades
Have limited time during market hours
Aim for higher risk-reward trades
Want consistent growth with lower stress
14. Intraday vs. Swing Trading: Key Differences Summary
Aspect Intraday Trading Swing Trading
Holding Period Same day Days to weeks
Risk High, fast Moderate
Screen Time Very high Low
Leverage High Low
Stress Level High Moderate
Suitable For Full-time traders Part-time traders
Conclusion
Both intraday trading and swing trading are effective trading styles when practiced with discipline, proper risk management, and a clear strategy. Intraday trading offers faster feedback and daily opportunities but comes with higher stress and execution risk. Swing trading provides more flexibility, better risk-reward potential, and a balanced lifestyle but requires patience and the ability to handle overnight uncertainty.
There is no universally superior trading style. The best approach is the one that matches your personality, capital, time availability, and psychological comfort. Many successful traders even combine both styles, using intraday trades for short-term opportunities and swing trades for broader market moves.

XAUUSD (Gold) | Technical Outlook | 12th Jan'2026XAUUSD (Gold Spot) | Technical Outlook | 12th Jan'2026
Gold is trading near 4,593, gaining +1.83% intraday and holding close to record highs around 4,601. The overall trend remains strongly bullish across all timeframes, with price well above all major moving averages. Momentum indicators continue to support the upside, while short-term indicators show overbought conditions, hinting at possible intraday pullbacks or consolidation before the next move higher.
Key Decision Zone: 4,570 – 4,585
Above 4,585, bulls stay in control with upside targets at 4,600–4,605, followed by 4,620 and 4,650. Below 4,570, short-term profit booking may extend toward 4,550, 4,520, and 4,500. Shorts should be treated as intraday only, as the higher-timeframe trend remains bullish.
Above 4,585 → Bullish 🐂
Below 4,570 → Short-term Bearish 🐻
⚠️ Disclaimer:
This analysis is for educational purposes only. Not a buy/sell recommendation. Trade with proper risk management.

Political instability can gold rebound to the previous ATH?Political instability: Venezuela’s President Maduro arrested – Can gold rebound to the previous ATH?
1️⃣ Market Context
The overall structure remains bullish.
Price is undergoing a short-term correction after a strong volatile move.
The 4300 area is acting as a key support zone.
RSI shows buy–sell convergence; bulls are gradually absorbing bears, keeping downside pressure well controlled.
2️⃣ News & Fundamental Factors
Geopolitical tension: Venezuela attacked by the U.S., President arrested and transferred to the U.S.
Expectation of a gap and bullish move in gold in the upcoming session.
Current news flow continues to support a positive outlook for gold.
3️⃣ Main Scenario
Priority scenario: Price holds above 4300 and resumes the bullish structure.
Key intraday levels to watch:
Support: 4300–431X, 4270–4275
Resistance: 4370–4375, 4402–4404
Focus on shallow pullbacks in line with the main trend.
4️⃣ Trading Strategy (Intraday / Weekly)
Trend-following remains the core approach, while being prepared for minor pullbacks to avoid missing moves.
Closely monitor price reactions at:
4300: Nearest support, currently holding well.
437X: Potential intraday reaction zone.
Always wait for price action confirmation, avoid entries in the middle of the range.
5️⃣ Extensions & Notes
If 4300 breaks decisively:
Deeper correction toward 427X, 425X
Further extension to 417X, a zone worth watching for swing opportunities.
Volatility remains high → risk management is the top priority.
✨ Wishing everyone a profitable new week.

Chumtrades XAUUSD Weekly Key Levels
Bias: Still favor BUY with the primary trend, watching for pullbacks to lower levels.
Support zones
4307 – 4300 (near-term support, key area to watch)
4260 – 4255 – 4250 (intermediate support)
4178 – 4168 (deep support, strong demand)
Resistance zones
4404 – 4413
4445 – 4465
4500 (ATH)
Weekly / Intraday scenario
Market is likely to trade in a range today.
Expected range:
Lower bound: 4300
Upper bound: 4513
👉 Overall strategy: Monitor price reaction at support zones, especially 4300 and below.

Chumtrades XAUUSD Any pullback is an opportunity to buy higher.This morning’s move was a corrective sell-off, best understood as profit-taking from BUY-side, not a trend reversal.
The overall structure remains within a rising trend channel, with no sign of a structural break → BUY bias stays intact, looking to buy pullbacks in line with the trend.
🟢 Key Support Zones
447x: near-term support (4476 – 4472 – 4470)
4450 – 4455
4430 – 4435
🔴 Key Resistance Zones
4548 – 4550
4560 – 4565
4599 – 4600 (upper resistance)
📌 Additional Note
453x is a mid-zone to watch closely for price reaction.
📊 Intraday Expectation
Price is expected to range sideways on the H2 timeframe
Range high: 4549
Range low: 4473
→ Possible BUY near the lower boundary and SELL near the upper boundary if the range holds.
⚠️ Risk Management
No major news at the moment; price is mainly driven by technical flows.
Holiday period → thin liquidity, higher risk of stop hunts.
Keep stops reasonable and avoid overtrading.
Wishing everyone a productive trading day.

BSE LTD Intraday| 23 Dec 2025| +45 Points Clean Short Setup23 Dec 2025 | Simple & Easy BTR Indicator Setup
Consistency comes from simplicity — and today BTR proved it again.
Another smooth intraday short trade executed perfectly in BSE LTD, with clear entry, logical stop-loss, and disciplined exit.
🔍 Trade Overview
• Stock: BSE LTD
• Date: 23/12/2025
• Timeframe: 15-Minute
• Indicator Used: BTR Indicator ONLY
🔴 Entry Logic (Short)
✔ BTR generated a clear BEARISH signal
✔ Breakdown after rejection from higher levels
✔ Momentum shifted completely in sellers’ favor
🔻 SHORT ENTRY: 2755
🛑 Stop-Loss (Risk First)
📌 SL placed above recent Swing High
📌 Clean structure-based stop
📌 No guesswork, no emotional SL movement
🎯 Exit Execution
✔ Follow the system, follow the exit
✔ Price continued lower smoothly
🟢 EXIT BOOKED: 2715
📉 TOTAL PROFIT: +45 POINTS
🧠 Why This Trade Was Easy
✔ Clear BTR signal
✔ Strong bearish follow-through
✔ Proper SL placement
✔ No over-trading, no indicator clutter
📌 Strategy Rule
❌ No prediction
❌ No noise
❌ No multiple indicators
✅ Only BTR Indicator
✅ Follow entry & exit rules
✅ Trade becomes effortless
🔥 Final Thought
Trading is not about being right every time —
it’s about executing the same edge repeatedly.
BTR continues to deliver high-probability intraday setups in both directions.
📊 Follow for daily BSE intraday trades
💬 Comment / DM if you want to trade using BTR Indicator
Simple Rules. Clean Charts. Consistent Profits. 📉📈 NSE:BSE
📌 You can find the BTR Indicator in my TradingView profile → Scripts section
👉 Open my profile
👉 Go to Scripts / Indicators
👉 Add BTR Indicator to your chart
👉 Trade with zero noise & clear signals
Follow BTR. Follow Discipline. Trade Simple. ✅
If you want, I can also give you:
• A pinned profile bio line
• A comment reply template for followers
• A step-by-step “How to use BTR” post
Just tell me 👍

BSE Intraday Trade — 18 Dec 2025BTR Bullish Setup + Fibonacci Precision | +30 Points Booked
Once again, BTR Indicator delivered a clean bullish intraday opportunity in BSE Ltd, proving the strength of rule-based trading over emotions.
This trade was further refined using Fibonacci Retracement, which helped in defining clear entry confidence, precise stop-loss, and a high-probability exit zone.
🔍 Trade Details
• Stock: BSE Ltd
• Timeframe: 15-Minute
• Setup Type: Bullish (BTR Confirmed)
• Market Condition: Pullback into Demand Zone
🟢 Entry Logic
✔ BTR generated a bullish signal inside a strong demand zone
✔ Price respected 0.5 – 0.618 Fibonacci retracement
✔ Strong bullish candle confirmed buyer presence
🟢 Buy Entry: Near 2670 zone
🎯 Exit & Target Planning
📌 Fibonacci Extension Used for Exit
• 1.618 Fib Level acted as a high-probability exit zone
• Price reacted immediately from this level
🔴 Exit Booked Near: 2700 zone
📈 Net Gain: +30 Points (Intraday)
🧠 Why This Setup Worked
✔ BTR provided directional clarity
✔ Fibonacci gave structure for SL & Exit
✔ Demand zone ensured low-risk entry
✔ System-based exit avoided overtrading
📌 Key Takeaway
Profitable trading is not about prediction.
It’s about alignment:
Signal + Structure + Risk Control
BTR does exactly that — again and again.
📊 Follow for daily intraday trade ideas
💬 DM for BTR Indicator & complete trading rules
Trade what you see. Exit where the system tells you. Stay disciplined. 🔥📈
#BSE #NIFTY #INTRADAY #BULISH #BUY #BSESTOCK #BSEINDIALTD

Chumtrades XAUUSD Trading Plan NF todayMarket Psychology
Expect price to range sideways before a clear breakdown.
Market is waiting for NFP, smart money stays cautious → focus on range trading (4330–4280).
🔴 Resistance (Key Resistance)
4335 – 4340
4318 – 4322
Support (Key Support)
4260 → Short-term lower range
424X → Swing BUY zone
4204 → Deep pullback, strong swing BUY area
🎯 Trading Expectation
Before news:
Trade the range
Sell high – Buy low
Avoid FOMO in the middle
After news / Breakdown:
Look for deep BUY entries
Focus on 424X – 4204

Chumtrades XAUUSD Trading PlanMarket Context
During Friday’s session, after the previous range breakout, the market saw strong profit-taking pressure from buyers.
Large capital exits triggered a sharp sell-off of ~96 prices, while the 426X base zone supported price very well.
Overall structure remains bullish.
👉 Session Expectation
Price is likely to move in a sideways range, with the upper–lower boundary around 423X – 428X (personal expectation).
🟢 Key Support Zones
• 4280 – 4282
• 4264 – 4266
• 4255 – 4257
• Deeper support: 424X
🔴 Key Resistance Zones
• 4330 – 4336
• 4347 – 4351 (±4353)
Good day, traders 🤝

#NIFTY Intraday Support and Resistance Levels - 15/12/2025A flat opening is expected in Nifty, with price continuing to respect the same key levels observed in previous sessions. The index remains trapped inside a well-defined consolidation range, with 25,954–26,051 acting as the immediate supply–demand zone. The lack of fresh momentum indicates that the market is waiting for a decisive trigger before choosing direction.
On the upside, a sustained move above 26,050 will be the first sign of strength. If Nifty manages to hold above this level, long opportunities can open up toward 26,150, 26,200, and 26,250+, aligning with the upper resistance zone marked on the chart. Any breakout above this zone should ideally be supported by strong volume for confirmation.
On the downside, failure to hold the consolidation zone and a move below 25,950–25,900 may invite selling pressure. In such a scenario, short trades can be considered with downside targets at 25,850, 25,800, and 25,750-, where previous buying interest was seen. Until a clear breakout or breakdown occurs, traders should expect range-bound movement, focusing on level-based trades with disciplined risk management.

[INTRADAY] #BANKNIFTY PE & CE Levels(15/12/2025)A flat opening is expected in Bank Nifty, indicating a continuation of the ongoing range-bound structure. Price is currently trading between the immediate resistance zone of 59,450–59,550 and the support zone near 59,050, showing clear signs of consolidation after the recent volatile moves. This zone has repeatedly acted as a decision area where both buyers and sellers are active, suggesting that directional clarity will come only after a decisive breakout or breakdown.
On the upside, a sustained move above 59,550 will signal strength and can be used as a buying opportunity in buying, with upside targets placed at 59,750, 59,850, and 59,950+. A strong hold above this resistance can invite fresh momentum-driven buying, pushing Bank Nifty back toward the psychological 60,000 zone.
On the downside, if the index slips below 59,450–59,400, selling pressure may increase. In that case, selling can be considered, with downside targets at 59,250, 59,150, and 59,050-. The 59,050 level remains a crucial support, and any breakdown below this zone may accelerate further weakness. Until a clear breakout occurs, traders should expect range-bound price action with intraday opportunities near the mentioned levels, keeping strict risk management in place.

ChumTrades XAUUSD intraday outlookXAUUSD – Intraday Plan (M15)
Market Context
Price is currently ranging in a very tight consolidation.
Momentum is weak → market favors intraday range trading rather than chasing breakouts.
Short-term structure remains intact; focus on price reaction at key levels.
Daily Strategy
Main approach: trade the range, trade the reaction.
Buy at predefined support / Fibonacci zones, sell at clear resistance.
If a breakout occurs, wait for a retest before following the move.
Avoid entries in the middle of the range.
Key Buy Zones
4246 – 4244 (Fibo 0.5)
4236 – 4233 (Fibo 0.618)
4210 – 4208 (deep support reaction)
❌ Bullish structure invalidation:
M15 close below 4200
Key Sell Zones
4300 – 4305 (psychological resistance)
4310 (Fibonacci extension – reaction sell)
Special Notes (Friday)
No major economic news today, but it is Friday – end of week.
Price action may become choppy and unpredictable, especially during the US session (a pattern seen in recent weeks).
Risk management is key:
Focus on short-term trades
Take profits early
Avoid holding positions over the weekend
Good luck Bro !

Holding Breath for FOMC News - Will History Repeat?XAUUSD Trading Idea Today 10/12/25 (FOMC - Big News)
Will history repeat:
Before the news: Sideway | News release: prioritize SELL
Today's range: 417X–423X
Expectation: FOMC release leads to selling (Powell is usually hawkish → price drops like in September & October)
1) Intraday Trading (catching the Sideway range)
Upper range:
4218–4220
4230–4233
Lower range:
4170–4173
4180–4182
→ Morning & afternoon prioritize catching the range – trade within the range for safety before the news.
2) During the news (for those who trade the news)
Not suitable for those who are risk-averse, so you can skip if you can't handle it. Limit if you want to learn and profit using a very small account.
1) 4218–4220 (Risk-only) (if it doesn't break all day)
• High reaction area
• Safe → skip
• Risk → Probe sell, small SL
2) 4230–4233 (Main Sell)
• Strong resistance within the range
3) 4240–4244–424X (Best Sell)
• Liquidity zone
• If spike during/before news → High RR sell
3) Target down
TP1: 418X
TP2: 416X-5x
TP3: 409X (main target – swing + FVG + fibo)
4) BUY?
Attention area:
4150-52
4128-32
4102-96
5) Note on the news
This scenario holds if Powell maintains a hawkish tone.
If Powell is more "dovish" → it may go against expectations.
Risk-averse traders → do not trade the news.
News traders → use a small account to test market reactions.
Quick Summary
Before the news → Sideway, catch the range 417X–423X
News release → prioritize SELL
SELL zone: 4218, 4230–4233, 4240–4244
Main target: 409X
The price will move with each statement from the Fed Chairman and keep an eye on Trump too.
Wishing everyone a victorious day.

Will gold stay sideways before the rate announcement?WILL GOLD CONTINUE TO SIDEWAY BEFORE INTEREST RATE ANNOUNCEMENT? WHAT DO YOU THINK
2 projected scenarios THIS WEEK.
Scenario 1 – Gold moves sideways below 4,200 until close to FOMC
If the price stubbornly stays below 4,200, unable to break through → when FOMC erupts, there's a high chance gold will break through 4,200.
Target falls to: 4,000 – 4,050 → this is the beautiful zone to Buy swing
The nearest zone 409x might have a reaction, pay attention (this zone is for today before fedfundrate)
Scenario 2 – Early week gold strengthens back to 4,200
If early in the week gold recovers well, touching 4,200 → FOMC at this time will become a push to propel gold back up.
Near target: 4,360, returning to test the previous peak.
THE MOST IMPORTANT FACTOR: FED'S TONE.
A 0.25% reduction is almost certain.
But the story lies in what Powell will say.
If Powell is HAWKISH like:
“Only reducing this time, economy is strong, not considering QE yet…”
→ This is strong bad news for gold and the entire asset market.
Gold drops, coins drop, stocks drop...
If the FED softens a bit:
Just a little dovish → gold will bounce extremely fast, no time to react.
In summary for this week
Gold is compressing very strongly around 4,200
FOMC will decide the direction
Major volatility will definitely appear
Just wait for the price to react before taking action — follow the strategy, follow the discipline.
Trade well, everyone.

Intraday Trading vs Swing TradingIntroduction
Trading in financial markets can be broadly classified based on the holding period of positions. Among the most popular approaches are Intraday Trading and Swing Trading. Both strategies aim to profit from price movements in stocks, commodities, currencies, or derivatives, but they differ significantly in execution, time horizon, risk exposure, and required skill sets. Understanding these differences is crucial for traders to align their style with personal risk tolerance, market knowledge, and lifestyle.
Intraday Trading
Definition:
Intraday trading, often called day trading, involves buying and selling financial instruments within the same trading day. Positions are opened and closed before the market closes, ensuring no overnight exposure. The primary objective is to capitalize on small price fluctuations within the day.
Key Characteristics:
Time Horizon:
Trades last minutes to hours; rarely extend beyond one trading session. Traders monitor charts constantly, looking for quick opportunities.
Leverage:
Intraday traders often use leverage to amplify gains. While this can increase profits, it also magnifies potential losses.
Technical Analysis:
Decision-making heavily relies on technical indicators, charts, patterns, and volume analysis. Fundamental factors are less significant for short-term moves.
Liquidity:
High liquidity stocks are preferred to ensure positions can be entered and exited quickly without affecting price significantly.
Common Strategies:
Scalping: Making numerous trades to capture small price gaps.
Momentum Trading: Identifying strong trends and riding them for quick profits.
Breakout Trading: Buying/selling when price breaks key support/resistance levels.
Advantages:
Quick realization of profits.
No overnight risk due to market gaps.
High number of trading opportunities daily.
Risks and Challenges:
Requires constant attention and quick decision-making.
High transaction costs due to frequent trades.
Emotionally taxing; can lead to impulsive decisions.
Small errors can lead to significant losses due to leverage.
Ideal Trader Profile:
Intraday trading suits disciplined, experienced traders with access to advanced trading tools, strong risk management, and the ability to handle stress.
Swing Trading
Definition:
Swing trading involves holding positions for several days to weeks, aiming to capture medium-term price movements. Unlike intraday trading, swing traders accept overnight exposure and aim to profit from market swings rather than minute-to-minute volatility.
Key Characteristics:
Time Horizon:
Trades are held from a few days to several weeks. Swing traders monitor trends and patterns over longer time frames, such as daily or weekly charts.
Market Analysis:
Both technical and fundamental analysis play roles. Swing traders use chart patterns, trend lines, moving averages, and sometimes news events to guide trades.
Risk Exposure:
Positions are exposed to overnight market risks, such as news events or economic announcements that can cause gaps.
Position Sizing:
Typically, swing traders use moderate leverage or none, reducing risk of large losses.
Common Strategies:
Trend Following: Entering trades along the direction of a prevailing trend.
Counter-Trend Trading: Taking positions against short-term extremes in a larger trend.
Breakout and Pullback Trading: Capturing price movements after breaking support/resistance or after a retracement.
Advantages:
Less time-intensive than intraday trading.
Opportunities to profit from larger price moves.
Reduced stress compared to day trading.
More room for analysis and planning trades.
Risks and Challenges:
Exposure to overnight or weekend gaps.
Patience required; trades may take days to materialize.
Market reversals can erode profits.
Requires solid risk management to handle potential drawdowns.
Ideal Trader Profile:
Swing trading is suitable for part-time traders or those unable to monitor markets continuously. It requires patience, analytical skills, and emotional control to ride trends over days or weeks.
Key Differences Between Intraday and Swing Trading
Aspect Intraday Trading Swing Trading
Time Horizon Minutes to hours Days to weeks
Overnight Exposure No Yes
Focus Short-term price fluctuations Medium-term price trends
Leverage Often high Moderate or low
Analysis Mainly technical Technical + fundamental
Risk High due to leverage Moderate; exposure to overnight gaps
Profit Potential Small per trade; requires high frequency Larger per trade; fewer trades
Emotional Demand Very high Moderate
Tools Needed Real-time charts, fast execution platforms Charting software, research tools
Transaction Costs High due to frequent trades Lower due to fewer trades
Choosing Between Intraday and Swing Trading
Selecting the right trading style depends on several factors:
Time Commitment:
Intraday trading demands full-time monitoring. Swing trading can fit around a regular job.
Risk Appetite:
Traders seeking quick gains with tolerance for high risk may prefer intraday trading. Conservative traders or beginners may favor swing trading.
Capital Requirements:
Intraday trading may require more capital to maintain margin requirements. Swing trading generally needs less margin.
Personality:
Traders who enjoy fast-paced environments, quick decisions, and intense focus lean towards intraday trading. Those preferring research, patience, and a slower pace find swing trading more comfortable.
Market Conditions:
Highly volatile markets favor intraday trading, while stable trending markets are more suitable for swing trading.
Combining Both Approaches
Some traders combine intraday and swing trading strategies to balance risk and opportunity. For instance:
Intraday for quick profits: Exploiting short-term volatility.
Swing for medium-term positions: Capturing larger moves without daily stress.
This hybrid approach requires discipline, strong risk management, and clear rules for position sizing.
Risk Management Considerations
Regardless of style, risk management is critical:
Stop-Loss Orders:
Limit losses on each trade. Intraday traders may set tight stops; swing traders allow wider stops to account for volatility.
Position Sizing:
Avoid risking too much capital on a single trade. The common guideline is 1–2% of capital per trade.
Diversification:
Spread trades across multiple instruments to mitigate sector or stock-specific risks.
Emotional Control:
Emotional discipline is essential. Both styles demand strict adherence to trading plans and avoidance of impulsive decisions.
Conclusion
Both intraday trading and swing trading offer opportunities to profit in financial markets but cater to different trader profiles, time commitments, and risk tolerances. Intraday trading focuses on rapid, short-term gains requiring intense monitoring and quick execution, whereas swing trading emphasizes medium-term trends, patience, and less stressful decision-making.
Choosing between these styles requires honest self-assessment of skills, capital, emotional resilience, and available time. Many successful traders blend both approaches strategically, capturing short-term moves while holding selected positions over days for larger trends. Ultimately, success depends not just on style, but on disciplined execution, strong risk management, and continuous learning in ever-changing markets.
Gold LongIntraday Trade for Gold MCX a long from here may give us short bounce.
Entry- 129750-129700
SL- 129450-400
Targert- 130200
Disclaimer- This is just for education purpose.
Jai Shree Ram.

What do you think about gold’s movement today?Hello traders!
What do you think about gold’s movement today?
Market Context
This morning, the Fed Chair delivered a speech without mentioning any economic updates. Despite that, gold still showed a corrective move, indicating that the SELL side remains dominant at the moment.
Main Strategy for Today
🔴 Prefer SELL setups
Stop selling only if price breaks above 4,246 — a key level defended by sellers.
Consider SELL entries at the previous high 4,265.
Additional SELL reaction zone to watch: 4,227 – 4,225.
BUY on deeper pullbacks
Ideal BUY zone: 4,194 – 4,190
BUY zone: 4,209 – 4,206
→ Only BUY if strong support reactions or reversal patterns appear.
🎯 Risk Management
Stop Loss (SL): 100 pips
Take Profit (TP): 100 pips
→ Maintain consistent risk throughout the session.
Do you think gold will continue to face bearish pressure and break lower,
or will it bounce from these deeper support zones and regain momentum?

XAUUSD H1 – Double Tap Liquidity & Reentry Setup🕊️ Market Context
Gold just delivered a beautiful liquidity sweep from the highs at 4148, after multiple CHoCH–BMS transitions confirmed structural bullish intent.
We are now seeing price forming equal lows, tapping the buy zone (4090–4085) — a clean H1 demand block aligned with the 0.618 retracement.
💎 Technical Analysis (SMC Perspective)
Structure:
Higher-timeframe structure remains bullish, following multiple BMS breaks to the upside.
Current pullback is corrective — a typical liquidity sweep to rebalance inefficiency.
BUY ZONE: 4090 – 4085 (SL 4080)
→ H1 Demand (OB) + 0.618 Fib confluence.
→ Watching for M15 CHoCH confirmation before entering long.
Target: 4148
→ Buy-Side Liquidity (BSL) resting above previous highs — likely magnet for the next push.
🪶 Trading Plan
I’ll wait patiently for a clean sweep + M15 confirmation around 4085–4090 to re-enter long.
As long as price respects 4080, my bias remains bullish, targeting the next BSL @ 4148.
No trade if price fails to confirm on lower timeframe — patience over impulse. 💛
💭 Karina’s Note
This setup perfectly reflects the essence of SMC — liquidity engineering before continuation.
It’s not about catching every move; it’s about aligning with the story the market is telling.
This is my personal view based on SMC principles – not financial advice.
✨ Like & Follow for daily London session updates ✨

Gold Holding Above 4100$ Market Prepares for Next Wave ExpansionGold continues to sustain momentum above 4,100$, maintaining its bullish market structure as traders price in expectations of a Fed rate cut in December.
While the US Dollar shows brief recovery, the underlying flow still supports safe-haven demand — especially as global risk sentiment remains fragile and the US government moves closer to reopening.
📊 Technical Overview (H1 – MMFLOW Structure)
Price is currently consolidating within the 4,108$–4,113$ liquidity pocket, where prior breakout demand aligns with short-term Fibonacci retracement (0.382–0.5).
This zone continues to attract buy-side liquidity, suggesting accumulation rather than exhaustion.
As long as 4,085$ remains protected, the bias stays bullish toward 4,172$ – 4,203$ (Fibo 1.272–1.618). However, failure to break above 4,172$ may trigger a short-term reaction sell before the next impulsive leg resumes.
🎯 Trading Plan – MMFLOW Setup
🌸 BUY Scenario (Liquidity Retest)
Buy Zone: 4,086 – 4,084
Stop Loss: 4,080
Targets: 4,090 → 4,095 → 4,100 → 4,110 → 4,120 → 4,130 → 4,150+
🔥 SELL Scenario (Short-Term Reaction Zone)
Sell Zone: 4,172 – 4,174
Stop Loss: 4,180
Targets: 4,165 → 4,160 → 4,150 → 4,140 → 4,130 → 4,120
🧠 MMFLOW TRADING Insight:
“Price is language — liquidity is intent. The market is not random; it’s engineered to test conviction before expansion.”
Bias remains bullish above 4,085$ – any dip into the liquidity base could offer the last accumulation before the next breakout.

ADANI PORTS | Bullish Momentum + RSI Breakout - STWP________________________________________
📊 ADANI PORTS | Bullish Momentum + RSI Breakout 🚀
Ticker: NSE: ADANIPORTS | Sector: Port & Logistics
CMP: ₹1,437.80
Rating: ⭐⭐⭐⭐ (Bullish Momentum Breakout – For Educational Purposes Only)
Pattern Observed: 📈 Price Action Setup – Breakout from Consolidation Zone
Candlestick Pattern: Strong Bullish Momentum Candle
________________________________________
🟦 Chart Summary
Adani Ports has formed a strong bullish candle on high volume, breaking above a short-term consolidation resistance zone. The structure reflects renewed buying strength and momentum, suggesting a possible continuation toward higher resistance levels in the near term.
________________________________________
🟨 Technical Indicators Summary
The chart highlights Bullish Momentum supported by a Strong Bullish Candle, indicating renewed buying interest. A clear RSI breakout confirms strengthening momentum, while the Bollinger Band Squeeze-On Compression suggests that volatility is contracting — often a precursor to a sharp directional move. This combination of momentum, structure, and volume alignment signals a potential breakout zone, reflecting a powerful setup where multiple indicators converge to reinforce short-term bullish sentiment.
________________________________________
🟩 Supports: 1,408 / 1,379 / 1,362
🟥 Resistances: 1,454 / 1,471 / 1,500
________________________________________
🟩 Swing Trade Study (Educational Viewpoint)
From a technical study perspective, Adani Ports is showing signs of a bullish breakout above ₹1,441.90, which may signal momentum continuation. The reference support for this structure lies near ₹1,387.10, defining the chart-based risk zone of around ₹54.8. This observation is shared only for educational and analytical purposes to demonstrate structured swing analysis.
________________________________________
🟩 Intraday Observation (For Learning Purposes)
For intraday study, the potential bullish breakout zone lies between ₹1,437.80 and ₹1,442, with immediate support around ₹1,424. Any price reaction near ₹1,430–₹1,435 could serve as an educational case for identifying intraday re-entry zones when price retests breakout areas. Traders should always apply strict stop-loss and risk management if trading live.
Final Outlook: Momentum: Strong, Trend: Bullish, Risk: Low, Volume: High
💡 Learning Note:
This case study helps learners understand how volume confirmation, RSI breakout, and price structure alignment can signal early trend continuation opportunities — a key concept in technical market reading.
________________________________________
⚠️ Disclosure & Disclaimer (SEBI-Compliant)
This content is created solely for educational and informational purposes to help readers understand technical analysis and market structure.
It does not constitute investment advice, research recommendation, or a solicitation to buy or sell any security.
The author is not a SEBI-registered investment adviser or research analyst.
All charts, patterns, and levels are based on personal study and historical data available from public sources such as TradingView and NSE India.
Position Status: No active position in ADANIPORTS at the time of publication.
Trading and investing involve risk. Market movements can be unpredictable, and losses may exceed invested capital.
Readers are strongly advised to consult a SEBI-registered investment adviser before making any trading or investment decisions.
By engaging with this post, you acknowledge that you take full responsibility for your own trades, decisions, and outcomes.
________________________________________
💬 Found this useful?
🔼 Boost this post to support structured learning content.
✍️ Share your thoughts, questions, or observations — let’s grow together!
🔁 Share with learners and traders to promote responsible market education.
👉 “If you liked this breakdown, follow for more disciplined, educational trade setups.”
🚀 Stay Calm. Stay Clean. Trade With Patience.
Trade Smart | Learn Zones | Be Self-Reliant 📊
________________________________________
