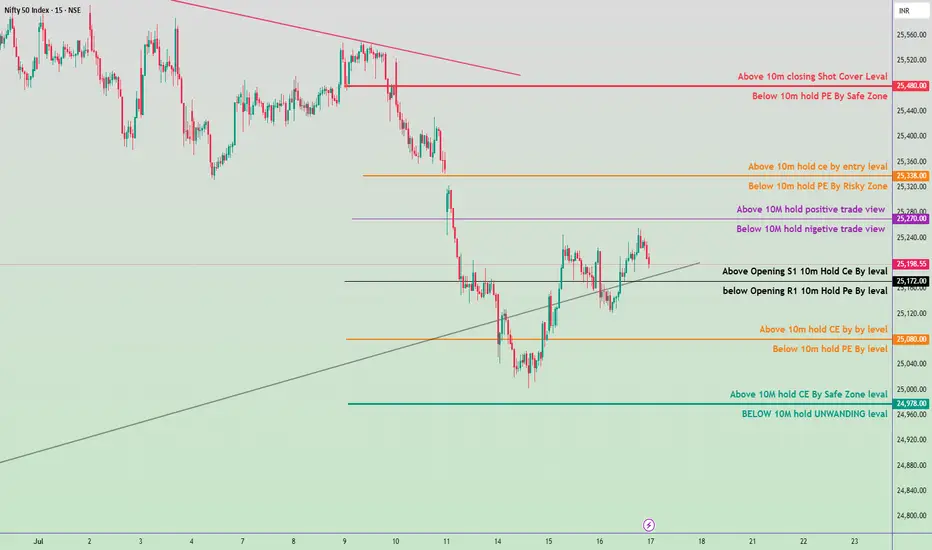
Nifty 50 Intraday Trade Plan - 17 July 2025🔴 Bullish Scenario (CE Buy Zones):
Above 25,480 → Shot Cover Level
→ CE BUY with strong momentum.
Above 25,338 → Entry Level for CE
→ CE BUY possible; moderate conviction.
Above 25,270 → Positive Trade View Starts
→ Start building CE positions cautiously.
Above 25,198.55 (Opening S1 Level)
→ Intraday CE HOLD if already bought.
Above 25,080 → CE by Buy Level
→ Entry-level for CE if market recovers.
Above 24,978 → CE Buy Safe Zone
→ Safer entry for CE, if bounce observed.
🔵 Bearish Scenario (PE Buy Zones):
Below 25,480 → PE by Safe Zone
→ PE can be added gradually.
Below 25,338 → Risky Zone for PE
→ PE buy with risk, SL tight.
Below 25,270 → Negative View Begins
→ Confidence increases in PE position.
Below 25,172 (Opening R1 Level)
→ If breaks this, PE HOLD.
Below 25,080 → PE by Buy Level
Below 24,978 → UNWINDING Level
→ Expect strong selling; PE aggressive buy zone.
🎯 Key Zones to Watch:
Range Bound Zone: Between 25,172 – 25,270
Trend Decider Zone:
Break above 25,270: Bullish Bias
Break below 25,172: Bearish Bias
Intradaytrade
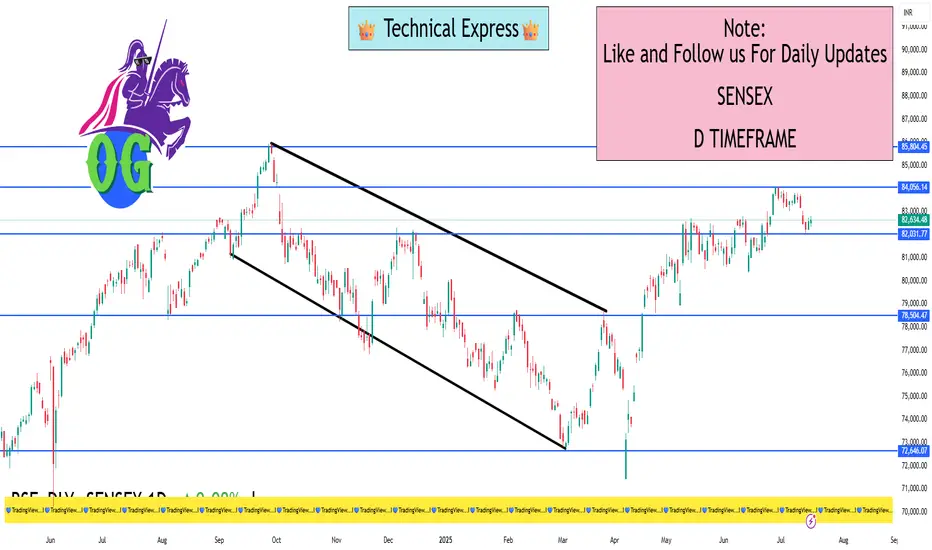
Sensex 1D Timeframe✅ On Dips: Consider buying near ₹82,280–₹82,310 (S1) or deeper at ₹81,990–₹82,020 (S2) if broader markets soften.
🔼 On Rallies: Think about partial profit-taking near ₹82,800–₹82,830 (R1).
🚀 Breakout Strategy: A daily close above ₹83,030–₹83,060 (R2) could lead to a move toward ₹83,325–₹83,360 (R3), and potentially retest the all-time highs (~₹85,978)
🚫 If Breakdown Occurs: A drop below ₹81,758–₹81,800 (S3) may shift the trend to bearish—time to consider reducing exposure.
Simple Action Plan
Buy-on-Dip Zones: ₹82,280–₹82,310; deeper: ₹81,990–₹82,020
Take Profits / Caution: ₹82,800–₹82,830
Breakout Trigger: ₹83,030–₹83,060 close → target ~₹83,325–₹83,360
Trend Alert (Bearish): Below ₹81,758
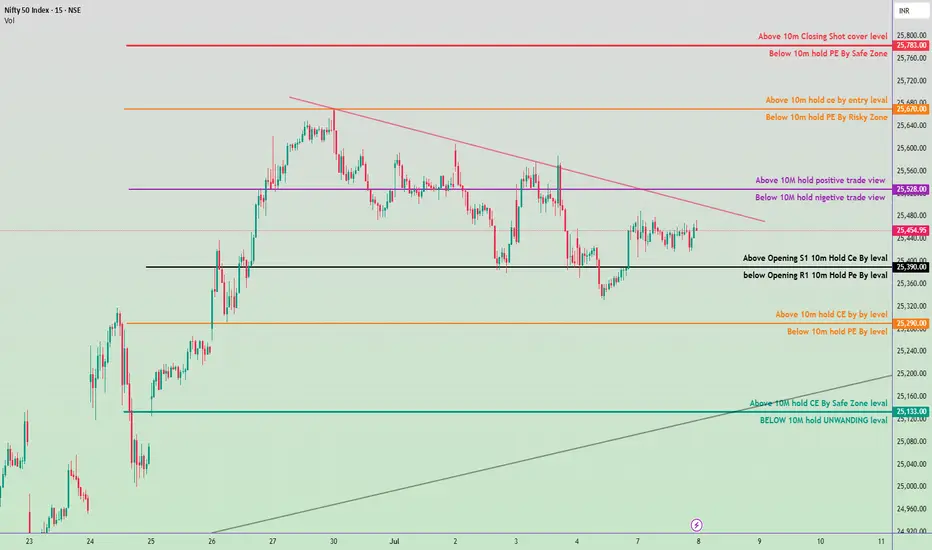
NIFTY 50 INTRADAY PLAN – 08 July 2025✅ Bullish Scenario (Call Option / CE Buy Plan):
Above 25,390:
Above Opening S1 – 10m Hold CE By Level
Initiate CE buy with caution.
Above 25,528:
Above 10M Hold – Positive Trade View
Strong bullish sentiment, hold CE confidently.
Above 25,670:
Above 10m Hold CE – Entry Level
CE enters Safe Zone, trend continuation expected.
Above 25,783:
Above 10m Closing – Short Cover Level
Big breakout possible, short covering rally.
🔻 Bearish Scenario (Put Option / PE Buy Plan):
Below 25,390:
Below Opening R1 – 10m Hold PE By Level
Start looking for PE (Put) trades.
Below 25,290:
Below 10m Hold PE By Level
Further downside expected, weakness builds.
Below 25,133:
Below 10M Hold – Unwinding Level
Strong selling / unwinding zone, big downside move likely.
🧠 Important Levels to Watch:
Trend Resistance Zone: 25,528 – 25,670
Support Zone: 25,290 – 25,133
Breakout Zone: Above 25,783
Breakdown Zone: Below 25,133
⚠️ Quick Notes for Traders:
📈 Above 25,528 = Positive view, hold CE
📉 Below 25,390 = Negative view, hold PE
EURUSD Bulls in ControlHello everyone, what’s your take on EURUSD?
After breaking out of its descending channel, EURUSD has maintained its bullish momentum. In the short term, there are no clear signs of slowing down, especially with the 34 EMA acting as dynamic support — boosting buyer confidence.
Fundamentally, a weaker US dollar and renewed optimism in Europe are fueling euro strength. As long as price holds above the 1.1650 zone, the path of least resistance remains upward. The 1.1750 target is still in sight, confirming a textbook bullish continuation pattern.
What’s your view on where EURUSD is headed next?

Nifty Bank Intraday levels(For Education Purpose)20.05.2025📉 Bearish (Sell) Setup:
Sell Below: ₹55,480 (confirmed breakdown)
Targets:
🎯 Target 1: ₹55,400
🎯 Target 2: ₹55,300
🎯 Target 3: ₹55,180 (if heavy selling continues)
Stop Loss: ₹55,580 (or ₹55,600 for conservative SL)
///📈 Bullish (Buy) Setup – Only if Reversal Happens:
Buy Above: ₹55,600 (strong reversal with volume & green candles)
Targets:
🎯 Target 1: ₹55,700
🎯 Target 2: ₹55,800
🎯 Target 3: ₹55,900
Stop Loss: ₹55,480

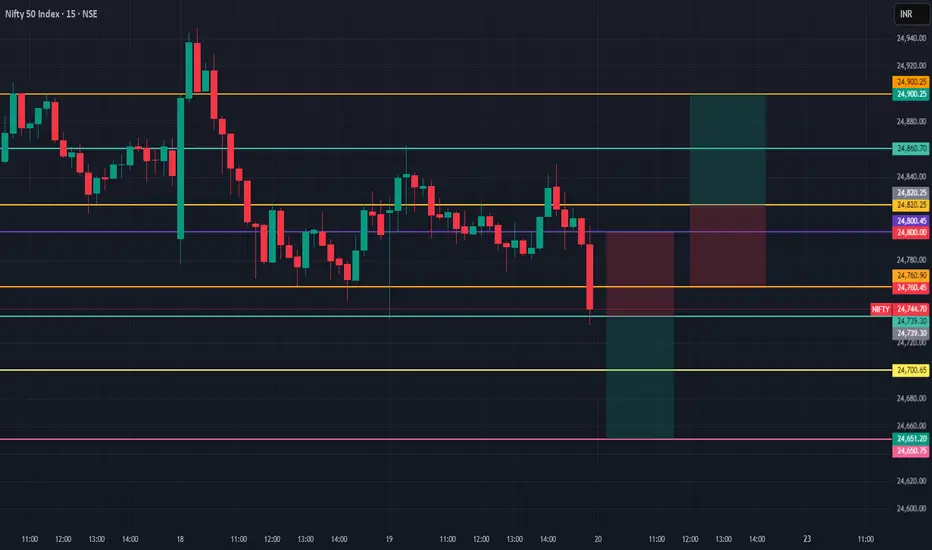
Nifty 50 Index Intraday Levels(For Educational purpose)20.5.225📉 Downside (Bearish Bias – Preferred Today)
Sell Below: ₹24,740
Entry Condition: A clean 1-minute red candlestick closing below ₹24,740, above-average volume.
Targets:
🎯 Target 1: ₹24,700
🎯 Target 2: ₹24,650
🎯 Target 3: ₹24,580 (if bearish momentum continues)
Stop Loss: ₹24,780–24,800
////📈 Upside (Bullish Reversal – Secondary Setup)
Buy Above: ₹24,820
Entry Condition: A strong 1-minute green candle breaking above ₹24,820 with volume.
Targets:
🎯 Target 1: ₹24,860
🎯 Target 2: ₹24,900
🎯 Target 3: ₹24,940
Stop Loss: ₹24,780
NIFTY BANK Intraday levels (Educational purpose only)📈 Upside Trade Setup (Long Entry):
Buy Above: 55,850
Entry Confirmation: 1-minute candle close above 55,850 with volume
Targets:
🎯 Target 1: 55,950
🎯 Target 2: 56,050
🎯 Target 3: 56,160
Stop Loss: 55,780
📉 Downside Trade Setup (Short Entry):
Sell Below: 55,700
Entry Confirmation: Strong red candle close below 55,700
Targets:
🎯 Target 1: 55,600
🎯 Target 2: 55,500
🎯 Target 3: 55,400
Stop Loss: 55,780

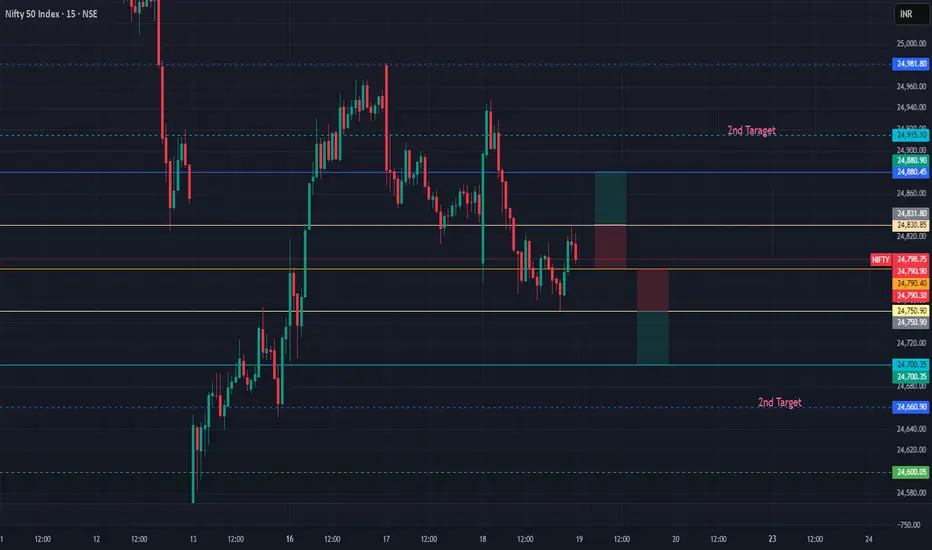
Nifty 50 Index Intraday Levels( Educational purpose only)📈 Upside (Bullish) Trade Plan:
Buy Above: 24,830
Confirmation: 1-minute candle close above 24,830 with volume support.
Targets:
🎯 Target 1: 24,880
🎯 Target 2: 24,915
🎯 Target 3: 24,980
Stop Loss (SL): 24,790
📉 Downside (Bearish) Trade Plan:
Sell Below: 24,757
Confirmation: Strong breakdown with red candle closing below 24,757.
Targets:
🎯 Target 1: 24,700
🎯 Target 2: 24,660
🎯 Target 3: 24,600
Stop Loss (SL): 24,800
PTCIL – Breakout From Long-Term Consolidation ZonePTCIL is showing strong signs of a bullish breakout, with price holding steadily above key moving averages and positive trend indicators. Institutional accumulation appears to be behind this move, and a close above resistance could see significant upside.
There is a high chances for upcoming move in bullish side

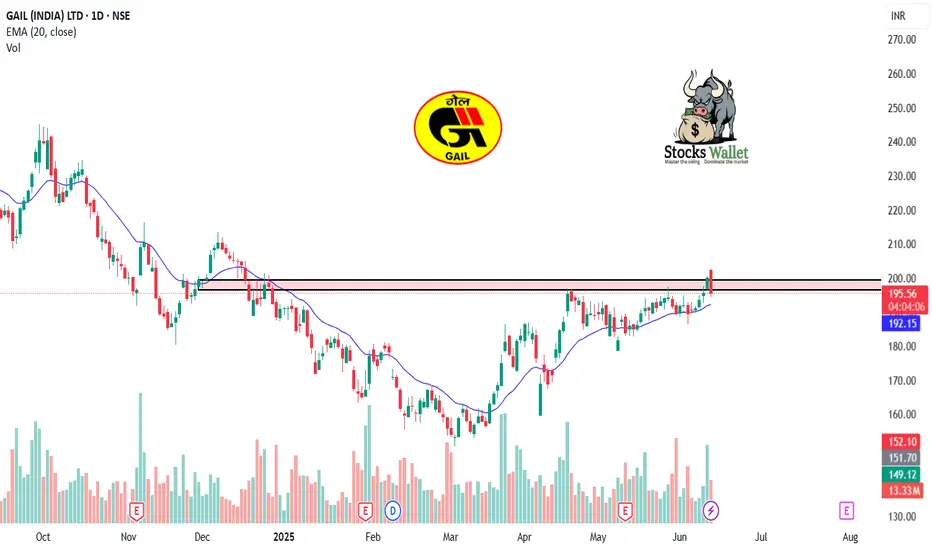
GAIL – Daily Timeframe , about to boomFollow us for more such content.
GAIL is showing strong signs of a bullish breakout, with price holding steadily above key moving averages and positive trend indicators. Institutional accumulation appears to be behind this move, and a close above resistance could see significant upside.
There is a high chances for upcoming move in bullish side
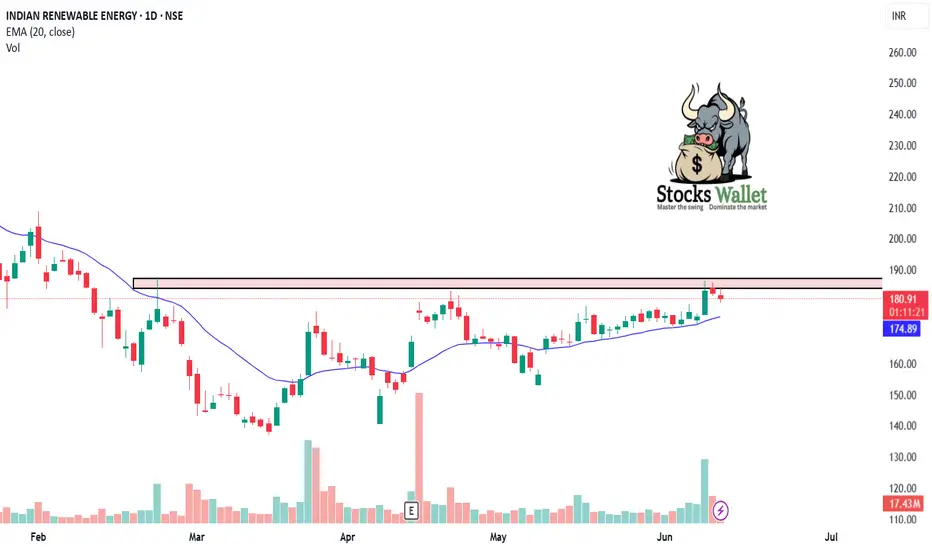
IREDA – Strong Bullish Continuation Setup After Healthy Consolid⚡ IREDA – Strong Bullish Continuation Setup After Healthy Consolidation
Chart: IREDA – Daily Timeframe
IREDA is showing a bullish continuation pattern after consolidating in a tight range near ₹140. The stock has formed a higher low structure, and recent breakout candles with rising volume suggest a renewed upside momentum.
🔹 Technical Highlights:
Ascending triangle breakout around ₹190
Strong support near ₹130–135 range
RSI rising above 60 – bullish strength confirmation
Price holding above 20 EMA and 50 EMA, signaling trend support
Volume breakout confirms buying interest from lower levels
📌 Trade Setup:
Entry Zone: ₹189–190
Target 1: ₹220
Target 2: ₹256
Stop Loss: ₹150 (closing basis)
The stock is part of the renewable energy theme and could see strong interest from positional traders and investors if broader market sentiment supports.
⚠️ This analysis is for educational purposes only. Always manage your risk and do your own research before taking any position.
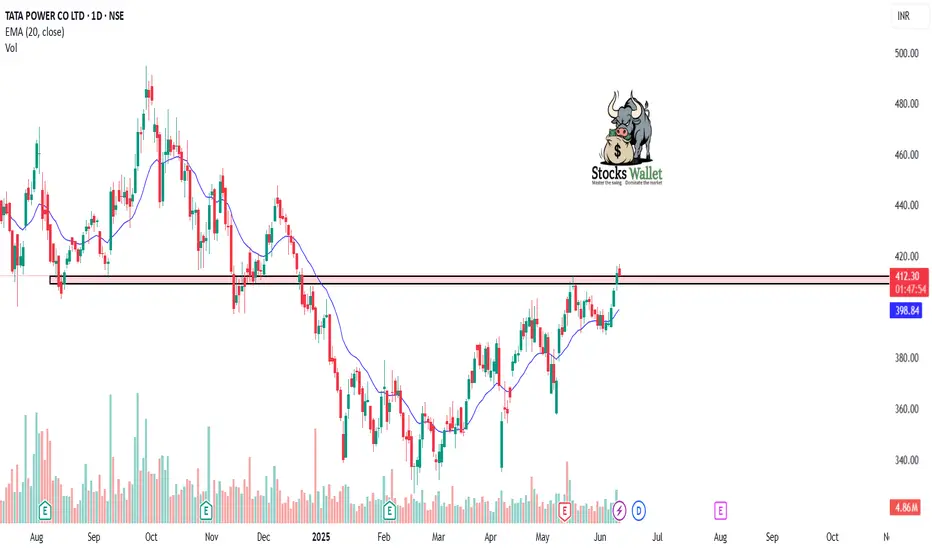
Bulish Breakout in Tata Power ⚡ Tata Power – Bullish Reversal Pattern on Daily Chart
Chart: Tata Power – Daily Timeframe
Tata Power has formed a strong bullish reversal setup after retesting a key support zone near ₹420. The stock has shown strong buying interest with rising volume and a bullish engulfing candle, indicating a potential start of a new upward leg.
🔹 Technical Highlights:
Price bounced from previous swing support (₹420–₹425)
Bullish engulfing candle + volume surge = strong buyer presence
RSI reversing from 50 zone and trending upward
20 EMA acting as dynamic support
📌 Trade Plan:
Entry Zone: ₹430–435
Target 1: ₹450
Target 2: ₹470
Stop Loss: Below ₹420 (closing basis)
The broader trend remains positive, and this could be the beginning of a new up-move. A breakout above ₹440 on strong volume would further confirm the bullish trend continuation.
⚠️ This analysis is for educational purposes only. Please do your own research before trading.
Intraday Long Setup | May 28th 2025 | Valid Until Daily ClosePrice is retracing to a strong pivot zone (marked by the red box).
Structure remains bullish with potential for continuation after pullback.
The green box represents a high-probability long opportunity with tight risk control.
Watch for price reaction within the red zone. Entry only if confirmation (e.g., bullish engulfing, strong wick rejections) appears.
The setup expires at end of the daily candle close.
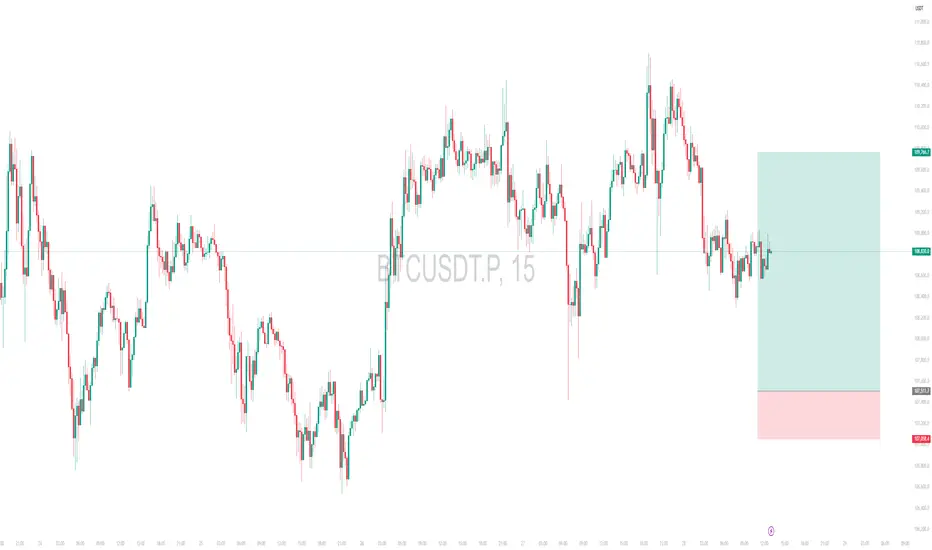
AAVEUSDT.P | Intraday Long Setup | 26th May 2025Price is retracing into a strong pivot zone (marked by the red box), which acted as a previous resistance and might flip into support.
Structure remains bullish with potential for continuation after pullback.
The green box represents a high-probability long opportunity with tight risk control.
Watch for price reaction within the red zone. Entry only if confirmation (e.g., bullish engulfing, strong wick rejections) appears.
The setup expires at end of the daily candle close.

BTCUSDT.P | Intraday Short Setup | 24th May 2024Price has pushed into a key resistance area (highlighted in red).
Looking for a clean rejection with a 1R move to secure partials, then possible continuation toward lower levels.
Managing risk tightly as structure unfolds.

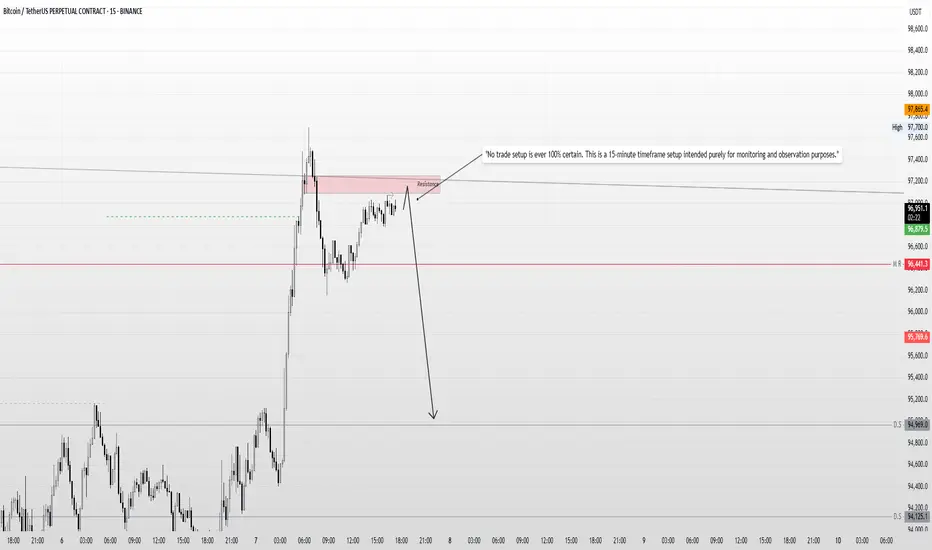
Bitcoin Intraday Bias – Liquidity Sweep & Rejection Setup"Intraday Setup: I anticipate that during the New York open, the market may sweep the liquidity around 97078, reject from the resistance zone, and potentially move lower."
"No trade setup is ever 100% certain. This is a 15-minute timeframe setup intended purely for monitoring and observation purposes."
Disclaimer: This is not financial advice. The analysis shared is for educational and informational purposes only. Please conduct your own research and consult with a licensed financial advisor before making any trading decisions. Trading involves significant risk and may not be suitable for all investors.
Bank Nifty Futures 25.04.25Expecting a gap down opening. My Strategy will be to sell on rise. Will be following MP and OF. Will be taking Trades at important areas / as per absorption of buyers.

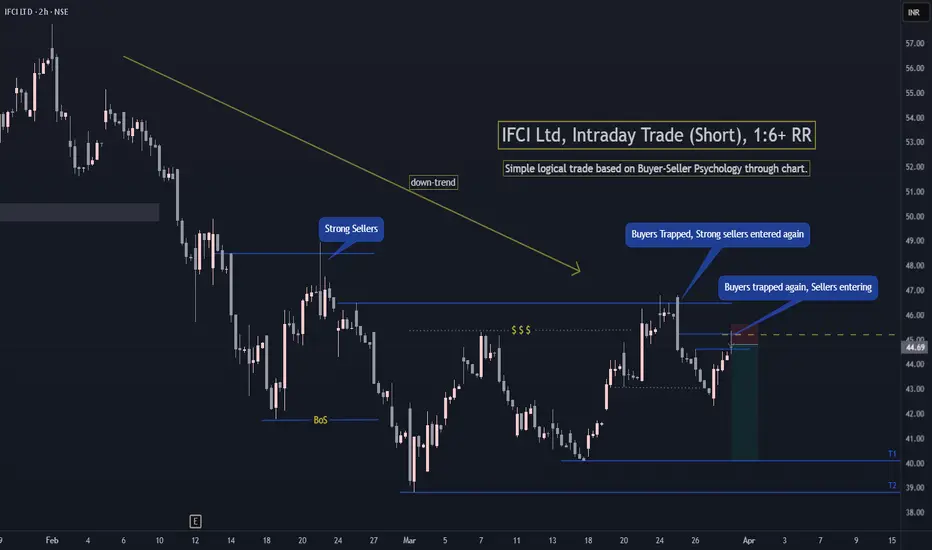
IFCI Intraday Trade (Short)IFCI is in down-trend and sellers have again trapped the buyers in discount zone. So there are high chances of price moving to Target 1 if Nifty is not very much bullish in coming sessions.
Simple trade based on buyer-seller psychology understanding. 1:6+ RR Trade.
If you have any questions. Do ask in comments.
Follow for more such simple and awesome setups. Thanks. Happy trading!
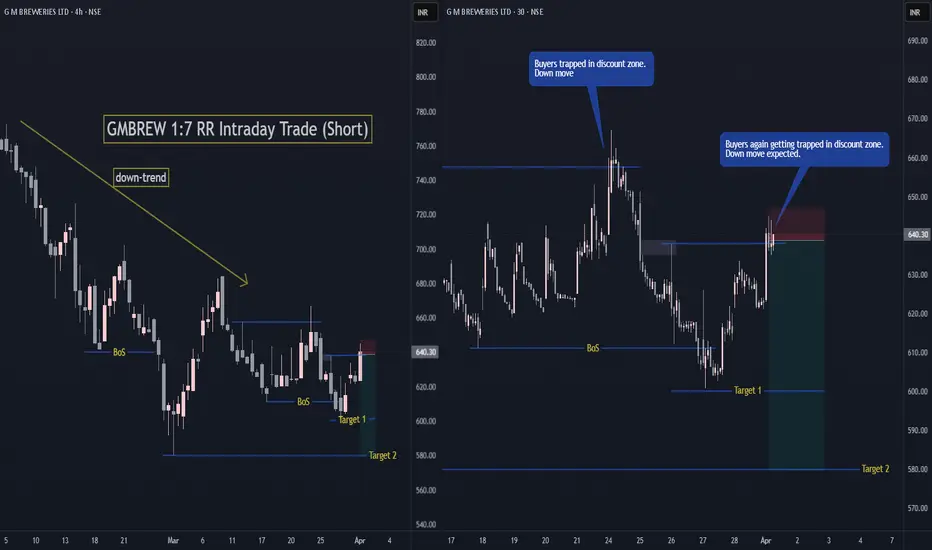
G M BREWRIES Intraday Trade (Short)GMBREW 1:7 RR Intraday Trade (Short) , Simple trade based on Trend and Liquidity Sweep in discount zone.
If Nifty is not bullish from current levels for today and tomorrow's session, then GMBREW has good chances of hitting Target 2.
Gold: Buyers pause above $2,900 amid risk aversion concernsGold is maintaining its bullish momentum for the second consecutive day above $2,900 on Wednesday morning, as buyers take a breather ahead of the crucial ADP employment report in the US. This data could provide fresh insights into the Federal Reserve’s next interest rate move. Meanwhile, risk aversion sentiment fueled by concerns over a trade war may help limit gold’s downside potential.
At the same time, XAU/USD has held above the $2,900 level but retreated slightly from the intraday high of $2,927.91. The daily chart shows that gold has been on an upward trajectory for the second consecutive session, though another strong rally remains uncertain. In the short term, gold appears to be correcting overbought conditions.
Key Levels to Watch
Support levels: $2,894, $2,876
Resistance levels: $2,927, $2,941, $2,956

Intraday to BTST trade opportunity in natural gas, it should flyHello, everyone, i have brought an intraday to postional trade in natural gas, i am expecting it should take support in this area, probability is very high that it should take supprot in this area, Today's day low can be our intraday support and the stop loss which i mention below to that is gonna to be a postional stop loss. Targets already mention on chart.
Disclaimer:- This analysis is for educational purposes only. Please trade responsibly and consult a financial advisor before making any decisions.
If you found this analysis helpful, don’t forget to like, follow, and share your thoughts in the comments below! Your support keeps me motivated to share more insights. Let’s grow and learn together—happy trading!

EURUSD: Will the bears reverse the trend?Dear Friends!
Selling pressure continues to weigh on the US Dollar and encouraged EURUSD to move to a fresh two-week high near 1.0500 following disappointing US Retail Sales figures.
Technically, as mentioned on the 3-hour chart, although the uptrend remains supported and the parallel price channel has been broken, there are signs of a potential top forming at 1.053. Current support is around 1.047. If this level is broken, it could send EURUSD lower, potentially reaching 1.041, which would coincide with a test of the 34 and 89 EMAs.
Have a nice day and good luck!

XAUUSD: Bulls are getting stronger!Hello everyone, let's find out the price of gold today!
Yesterday, gold prices fell sharply, with spot gold falling $45.60 to $2,883.10 an ounce. Gold futures were last trading at $2,894.60 an ounce, down $50.70 from this morning.
The main reason for the decline was profit-taking pressure. However, the precious metal still recorded its seventh consecutive weekly gain. Gold's gains this week were driven by safe-haven demand as President Donald Trump's plan to impose tariffs on countries that tax US imports raised concerns about a global trade war.
On the other hand, Peter Grant, vice president and senior metals strategist at Zaner Metals, added that there are some technical factors at play. Gold’s failure to hit an all-time high on Tuesday may have created a double top and some profit-taking ahead of the weekend, he said. Meanwhile, gold’s rally remains supported by a number of factors including tariffs, underlying inflation and a weaker U.S. dollar.
