HDFC Intraday tradeLong HDFC above 1696 after the BO of TL. Target 1700-1705 with SL 1688. BULLISH MOMENTUM IN THE STOCK.
Intradaytrade

BANKNIFTY LEVELS 04/05/2023 BANKNIFTY ANALYSIS WITH LOGIC:
1. If there's flat opening or gap up price should retest 43295 level with 15m bullish candle, then only we will take long position up to 43450 as our 1st target.
2. If that trend continues, we will set 43600 level as our second target by maintaining trailing stoploss.
3. If there's gap down in price and closes below trend line with 15m candle we will short up to 43065 level.
4. Maximum range boundness can be seen during first half be careful.
Have a safe and profitable day :)

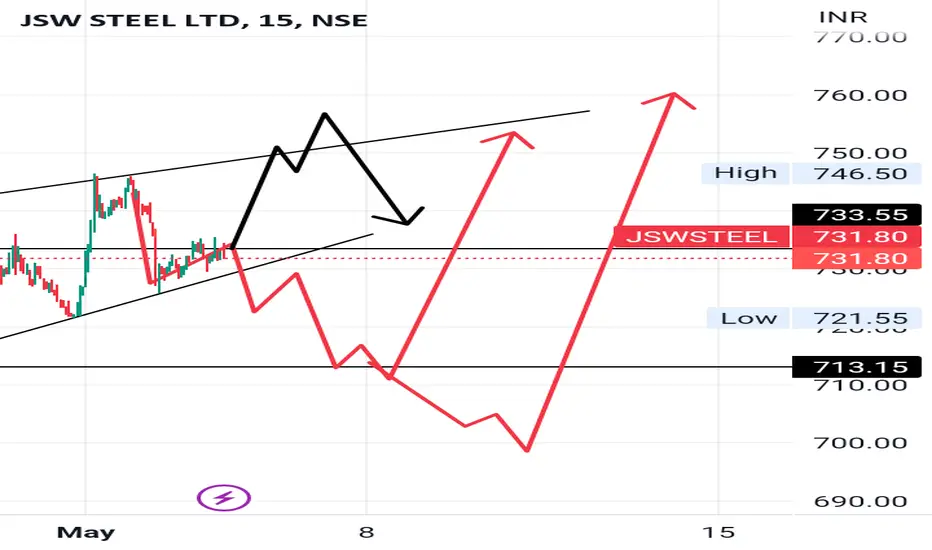
Liquidity area of jsw Steel for trading.but waiting for Liquidity are for jsw steel,but waiting for entry it can be give you very good returns .
BANKNIFTY LEVELS 02/05/2023BANKNIFTY ANALYSIS WITH LOGIC:
1. Considering new weekly levels if there's gap up in price it should retest 43295 level with strong candle then only, we will plan for long position up to 43600 level.
2. If price opens at 43600 level and gets rejected at the level, we will short up to 43295 level by maintaining trailing stoploss.
3. Consolidation may occur in between 43065 - 43295 levels.
4. If price opens on a flat note no trades shall be taken until it breaks 43065 level with strong bearish candle, we will short our positions up to 42550 level.
Have a safe and profitable day :)

Nifty Intraday trade example
Intraday Day trade Example using Weekly levels
Buy Above 17673.29 Buy Targets 17762.81 17851.83 17923.79 17995.74 18098.18 18160.38 18372.58 18605.52
Trend Breakdown point : 17881.94

#Mazgon Dock analysisAlready given Breakout as per previous analysis, still who haven't taken entry may take at marked level, follow chart for proper support and resistance levels, volume build up seen.

#Mangalore Refinery Breakout !Stock is again near to breakout level and today burst with good volume, follow chart for proper entry and exit.

#PNB ready for BlastAs already said in psu bank analysis, all psu banks will post good results in this qtr, this stock again near to BO zone forming round bottom pattern with good volume build up, follow chart for proper support and resistance levels.

#Welspun India Swing Trade Inverted pole and flag Analysis Stock is near to BO level which has formed inverted pole and flag pattern with good volume build up, follow chart for proper entry and exit levels.

#Borosil renewable analysis Stock has given BO after a long downward channel with good volume build up. Follow chart for proper entry and exit levels.

#Axisbank Analysis Stock after taken support again near BO level forming round bottom pattern with good volume, follow chart for proper entry and exit levels. As banking stocks are posting good numbers, so strong point for long.

Finnifty on make or break level Finnifty has formed a strong bullish engulfing pattern and appears poised to breach a trendline resistance. If the current bullish momentum persists, there may be significant short covering, leading to a potential price target of 18930. However, it should be noted that a bearish stance may be warranted should Finnifty fall below 18820, depending on evolving market conditions. It might go sideways as well. I'll suggest to scalp today; watchout before entering have a strict SL.


HEROMOTOCOENTRY TARGET SL Mention in the chart.
ALWAYS TAKE TRADE WITH CONFIRMATION
Note : Trading in any financial market is very risky. I post ideas for educational purpose only. It is not financial advice. Do not hold us responsible for any potential loss you may incur. Please consult your financial adviser before trading.

nfity important level to trade on 10/04/2023I don't use any indicator. I believe in only price action. so based on price action I have some level that can help you in today trading.

Banknfity important level to trade on 10/04/2023I don't use any indicator. I believe in only price action. so based on price action I have some level that can help you in today trading.

intradayboth side potential
avoid first 15min breakout
wait for 15 min candle closing
targets are marked
follow risk management
do your own analysis
do workout
do meditation
start reading book

BANK NIFTY INDEXbank nifty makes cup & handle shape pattern
wait for breakout .
you get a good chance to make a trade after the breakout.
i suggest you to trade on retest. because the market is below 200ema on daily chart.
200 ema is a psychological resistance . the major activities are happen near the 200 ema .
_________________________________________________________________________________ THANK YOU FOR VISIT.

Banknifty bullish abow 39655Banknifty bullish above 39655 Bearish below 39430. take trades on retest levels only so that Stop Loss will be minimum.
Note:- Please do consult your financial advisor before taking trades.

MCX - Intraday Trade Levels || 22nd March, 2023 Analysis Criteria Used:
1. Please find the Chart Analysis done for the 22nd March, 2023
2. The analysis for the Intraday Trade ideas, has been done based on Trend analysis and Chart Patterns with Volume Buildups
Focus On:
1. Always keeping your Risk Management in play
2. Using a Stop Loss; because it is your Best Friend
3. Always Plan your Trade and stick to your Plan
4. Dont overthink or overanalyse
5. Treat this as your Business and get serious about it
#sharemarket #stockmarket #nifty #sensex #investing #trading #nse #bse #stockmarketindia #stocks #indianstockmarket #investment #stockmarketnews #banknifty #finance #money #intraday #intradaytrading #investor #niftyfifty #dalalstreet #sharemarketindia #sharemarketnews #stockmarketinvesting #business #sharemarkettips #stock #india #indiansharemarket #rakeshjhunjhunwala #bhfyp #mumbai #share #wealth #investment #market #invest #trading #investing #finance #FinancialFreedom #investor #trader #stocks #profit #investors #economy #equity #shares #nifty #stockexchange
DISCLAIMER:
𝙊𝙪𝙧 𝘼𝙣𝙖𝙡𝙮𝙨𝙞𝙨 𝙞𝙨 𝙛𝙤𝙧 𝙀𝙙𝙪𝙘𝙖𝙩𝙞𝙤𝙣𝙖𝙡 𝙥𝙪𝙧𝙥𝙤𝙨𝙚𝙨 𝙤𝙣𝙡𝙮.
* Please do your own research and/or contact your financial advisor before taking any trading opportunities
** We will not be responsible for your profit or loss
*** We are NOT SEBI REGISTERED
______________________
best stocks to buy today
best stocks to buy now
best stocks to buy
best stocks for Intraday tomorrow
best stocks for long term investment
best stocks to buy today india
best stocks for swing trading
swing trading strategies
swing trading beginners
what is swing trading
swing trading stocks
swing trading stock selection
swing trading kya hai
nifty analysis
nifty view
bank nifty analysis
top stocks to buy now
strong stocks
nifty view
nifty prediction
stock market view tomorrow
bank nifty Levels
bank nifty prediction
share news
stock market news
best stocks to buy now
profit booking stocks
multibagger stocks in discount
breakout stocks
best short term stocks
best short term shares
next multibagger stocks

intraday
both side potential
avoid first 15min breakout
wait for 15 min candle closing
targets are marked
if the breakout comes after 10:00 am then the probability of winning will be more.
follow risk management
do your own analysis
do workout
do meditation
start reading books

intraday
both side potential
avoid first 15min breakout
wait for 15 min candle closing
targets are marked
if the breakout comes after 10:00 am then the probability of winning will be more.
follow risk management
do your own analysis
do workout
do meditation
start reading books

U.S Dollar currency Index U.S Dollar currency Index:-It form H&S pattern on monthly chart. It may start to correction from here.
US 10 yrs Govt Bond Yield:-It is near major resistance 4.13%.It may start to correction from here.
Nifty has inverse relations with above both, so it may start to bounce from major support level. Nifty major Support level 17122-17099
