Intraday Trading vs. Swing Trading: A Detailed Comparison1. What Is Intraday Trading?
Intraday trading, also known as day trading, involves buying and selling financial instruments within the same trading session. All positions are closed before the market closes, and no trades are carried overnight.
Intraday traders profit from small price fluctuations using high volume, leverage, and precise timing. The focus is on short-term momentum, liquidity, and volatility.
Key Characteristics of Intraday Trading
Trades last from a few seconds to a few hours
No overnight risk
High frequency of trades
Requires continuous screen monitoring
Strong dependence on technical indicators
Sensitive to news and market sentiment
2. What Is Swing Trading?
Swing trading aims to capture short- to medium-term price swings over several days to a few weeks. Positions are held overnight and sometimes across market cycles.
Swing traders rely on trend analysis, support and resistance levels, and market structure rather than minute-to-minute price action.
Key Characteristics of Swing Trading
Trades last from 2 days to several weeks
Positions are held overnight
Lower trade frequency
Less screen time required
Combination of technical and fundamental analysis
Focus on broader market trends
3. Time Frame and Trade Duration
Intraday Trading
Time frames used: 1-minute, 5-minute, 15-minute charts
Trades aim to capture quick price movements
High pressure due to fast decision-making
Traders must act instantly on signals
Swing Trading
Time frames used: Daily, 4-hour, and weekly charts
Trades allow time for trends to develop
More patience required
Decisions can be planned after market hours
4. Capital Requirement and Leverage
Intraday Trading
Often requires higher capital
Leverage is commonly used
Brokers offer margin benefits for intraday trades
Small adverse moves can cause quick losses
Swing Trading
Lower leverage compared to intraday
Less dependence on margin
Suitable for traders with moderate capital
Lower risk of forced liquidation
5. Risk Exposure and Volatility
Intraday Trading Risks
Sudden price spikes
Slippage during high volatility
Emotional stress due to rapid price movement
Overtrading risk
Swing Trading Risks
Overnight gap risk
News and earnings impact
Broader market risk
Requires wider stop-losses
Despite overnight risk, swing trading often has better risk-to-reward ratios than intraday trading.
6. Profit Potential and Consistency
Intraday Trading
Smaller profits per trade
Requires many successful trades for consistency
High transaction costs (brokerage, taxes)
Suitable for traders seeking daily income
Swing Trading
Larger profit targets
Fewer trades, higher quality setups
Lower transaction costs
Better suited for wealth building
7. Technical Analysis Tools Used
Common Intraday Indicators
VWAP (Volume Weighted Average Price)
Moving Averages (9, 20 EMA)
RSI (short-period)
MACD (fast settings)
Order flow and volume profile
Common Swing Trading Indicators
Support and resistance
Fibonacci retracement
Trendlines and channels
RSI (14-period)
Moving averages (50, 100, 200)
Swing traders rely more on price action and structure, while intraday traders focus on speed and momentum.
8. Psychological Demands
Intraday Trading Psychology
High stress and pressure
Requires emotional discipline
Fear and greed act faster
Quick recovery from losses is essential
Swing Trading Psychology
Requires patience and trust in analysis
Managing uncertainty overnight
Avoiding panic due to short-term noise
More suitable for calm personalities
Psychology often determines success more than strategy.
9. Lifestyle and Time Commitment
Intraday Trading
Full-time commitment
Requires presence during market hours
Not suitable for working professionals
Highly demanding mentally
Swing Trading
Part-time friendly
Ideal for professionals and students
Analysis can be done after market hours
Better work-life balance
10. Market Conditions Suitability
Intraday Trading Works Best When:
Market is highly volatile
Strong intraday trends exist
Liquidity is high
News-driven moves occur
Swing Trading Works Best When:
Clear trends are present
Markets are stable
Volatility is moderate
Broader market direction is defined
11. Taxation and Costs (General View)
Intraday trading usually attracts higher taxes and transaction costs
Frequent trading increases brokerage expenses
Swing trading is more tax-efficient due to lower turnover
(Tax rules vary by country and should be checked locally.)
12. Who Should Choose Intraday Trading?
Intraday trading is suitable for traders who:
Can dedicate full market hours
Handle high stress and fast decisions
Have strong discipline and execution skills
Prefer daily profit opportunities
13. Who Should Choose Swing Trading?
Swing trading is suitable for traders who:
Prefer planned trades
Have limited time during market hours
Aim for higher risk-reward trades
Want consistent growth with lower stress
14. Intraday vs. Swing Trading: Key Differences Summary
Aspect Intraday Trading Swing Trading
Holding Period Same day Days to weeks
Risk High, fast Moderate
Screen Time Very high Low
Leverage High Low
Stress Level High Moderate
Suitable For Full-time traders Part-time traders
Conclusion
Both intraday trading and swing trading are effective trading styles when practiced with discipline, proper risk management, and a clear strategy. Intraday trading offers faster feedback and daily opportunities but comes with higher stress and execution risk. Swing trading provides more flexibility, better risk-reward potential, and a balanced lifestyle but requires patience and the ability to handle overnight uncertainty.
There is no universally superior trading style. The best approach is the one that matches your personality, capital, time availability, and psychological comfort. Many successful traders even combine both styles, using intraday trades for short-term opportunities and swing trades for broader market moves.
Intradaytrader

ChumTrades XAUUSD intraday outlookXAUUSD – Intraday Plan (M15)
Market Context
Price is currently ranging in a very tight consolidation.
Momentum is weak → market favors intraday range trading rather than chasing breakouts.
Short-term structure remains intact; focus on price reaction at key levels.
Daily Strategy
Main approach: trade the range, trade the reaction.
Buy at predefined support / Fibonacci zones, sell at clear resistance.
If a breakout occurs, wait for a retest before following the move.
Avoid entries in the middle of the range.
Key Buy Zones
4246 – 4244 (Fibo 0.5)
4236 – 4233 (Fibo 0.618)
4210 – 4208 (deep support reaction)
❌ Bullish structure invalidation:
M15 close below 4200
Key Sell Zones
4300 – 4305 (psychological resistance)
4310 (Fibonacci extension – reaction sell)
Special Notes (Friday)
No major economic news today, but it is Friday – end of week.
Price action may become choppy and unpredictable, especially during the US session (a pattern seen in recent weeks).
Risk management is key:
Focus on short-term trades
Take profits early
Avoid holding positions over the weekend
Good luck Bro !

what do you think about today's gold price?Hello Traders, what do you think about today's gold price?
Today the market will have news related to Unemployment Benefits, so I expect the trading range to be slightly narrow and liquidity relatively low. Please be more cautious in placing orders and managing capital.
Below are the important support – resistance zones I am monitoring today:
🔵 BUY ZONE (Support)
4180 – 4184
4160 – 4165
4150 – 4155
4130 – 4133
➡️ These are strong support zones – prioritize watching for Buy in the Sideway range.
🔴 SELL ZONE (Resistance)
4240 – 4244
4250 – 4255
➡️ These are the upper resistance zones – suitable for watching for Sell when the price rebounds to the range.
👀 NEAREST OBSERVATION ZONE
4217 – 4220
➡️ This is the directional zone, observe price reactions to determine continuation or adjustment forces.
🎯 Trading orientation for the day
Personal style: SL10 price – TP10 price.
Trade within the Sideway range, Buy low – Sell high.
Break any zone, trade that zone, avoid holding orders against the trend.
Low liquidity → trade lightly & manage capital tightly.
⚠️ Note: This is a personal trading plan, not investment advice. Please consider it as reference material.
Wishing you a successful trading day – enter and win! 💹✨

Intraday Trading vs Swing TradingIntroduction
Trading in financial markets can be broadly classified based on the holding period of positions. Among the most popular approaches are Intraday Trading and Swing Trading. Both strategies aim to profit from price movements in stocks, commodities, currencies, or derivatives, but they differ significantly in execution, time horizon, risk exposure, and required skill sets. Understanding these differences is crucial for traders to align their style with personal risk tolerance, market knowledge, and lifestyle.
Intraday Trading
Definition:
Intraday trading, often called day trading, involves buying and selling financial instruments within the same trading day. Positions are opened and closed before the market closes, ensuring no overnight exposure. The primary objective is to capitalize on small price fluctuations within the day.
Key Characteristics:
Time Horizon:
Trades last minutes to hours; rarely extend beyond one trading session. Traders monitor charts constantly, looking for quick opportunities.
Leverage:
Intraday traders often use leverage to amplify gains. While this can increase profits, it also magnifies potential losses.
Technical Analysis:
Decision-making heavily relies on technical indicators, charts, patterns, and volume analysis. Fundamental factors are less significant for short-term moves.
Liquidity:
High liquidity stocks are preferred to ensure positions can be entered and exited quickly without affecting price significantly.
Common Strategies:
Scalping: Making numerous trades to capture small price gaps.
Momentum Trading: Identifying strong trends and riding them for quick profits.
Breakout Trading: Buying/selling when price breaks key support/resistance levels.
Advantages:
Quick realization of profits.
No overnight risk due to market gaps.
High number of trading opportunities daily.
Risks and Challenges:
Requires constant attention and quick decision-making.
High transaction costs due to frequent trades.
Emotionally taxing; can lead to impulsive decisions.
Small errors can lead to significant losses due to leverage.
Ideal Trader Profile:
Intraday trading suits disciplined, experienced traders with access to advanced trading tools, strong risk management, and the ability to handle stress.
Swing Trading
Definition:
Swing trading involves holding positions for several days to weeks, aiming to capture medium-term price movements. Unlike intraday trading, swing traders accept overnight exposure and aim to profit from market swings rather than minute-to-minute volatility.
Key Characteristics:
Time Horizon:
Trades are held from a few days to several weeks. Swing traders monitor trends and patterns over longer time frames, such as daily or weekly charts.
Market Analysis:
Both technical and fundamental analysis play roles. Swing traders use chart patterns, trend lines, moving averages, and sometimes news events to guide trades.
Risk Exposure:
Positions are exposed to overnight market risks, such as news events or economic announcements that can cause gaps.
Position Sizing:
Typically, swing traders use moderate leverage or none, reducing risk of large losses.
Common Strategies:
Trend Following: Entering trades along the direction of a prevailing trend.
Counter-Trend Trading: Taking positions against short-term extremes in a larger trend.
Breakout and Pullback Trading: Capturing price movements after breaking support/resistance or after a retracement.
Advantages:
Less time-intensive than intraday trading.
Opportunities to profit from larger price moves.
Reduced stress compared to day trading.
More room for analysis and planning trades.
Risks and Challenges:
Exposure to overnight or weekend gaps.
Patience required; trades may take days to materialize.
Market reversals can erode profits.
Requires solid risk management to handle potential drawdowns.
Ideal Trader Profile:
Swing trading is suitable for part-time traders or those unable to monitor markets continuously. It requires patience, analytical skills, and emotional control to ride trends over days or weeks.
Key Differences Between Intraday and Swing Trading
Aspect Intraday Trading Swing Trading
Time Horizon Minutes to hours Days to weeks
Overnight Exposure No Yes
Focus Short-term price fluctuations Medium-term price trends
Leverage Often high Moderate or low
Analysis Mainly technical Technical + fundamental
Risk High due to leverage Moderate; exposure to overnight gaps
Profit Potential Small per trade; requires high frequency Larger per trade; fewer trades
Emotional Demand Very high Moderate
Tools Needed Real-time charts, fast execution platforms Charting software, research tools
Transaction Costs High due to frequent trades Lower due to fewer trades
Choosing Between Intraday and Swing Trading
Selecting the right trading style depends on several factors:
Time Commitment:
Intraday trading demands full-time monitoring. Swing trading can fit around a regular job.
Risk Appetite:
Traders seeking quick gains with tolerance for high risk may prefer intraday trading. Conservative traders or beginners may favor swing trading.
Capital Requirements:
Intraday trading may require more capital to maintain margin requirements. Swing trading generally needs less margin.
Personality:
Traders who enjoy fast-paced environments, quick decisions, and intense focus lean towards intraday trading. Those preferring research, patience, and a slower pace find swing trading more comfortable.
Market Conditions:
Highly volatile markets favor intraday trading, while stable trending markets are more suitable for swing trading.
Combining Both Approaches
Some traders combine intraday and swing trading strategies to balance risk and opportunity. For instance:
Intraday for quick profits: Exploiting short-term volatility.
Swing for medium-term positions: Capturing larger moves without daily stress.
This hybrid approach requires discipline, strong risk management, and clear rules for position sizing.
Risk Management Considerations
Regardless of style, risk management is critical:
Stop-Loss Orders:
Limit losses on each trade. Intraday traders may set tight stops; swing traders allow wider stops to account for volatility.
Position Sizing:
Avoid risking too much capital on a single trade. The common guideline is 1–2% of capital per trade.
Diversification:
Spread trades across multiple instruments to mitigate sector or stock-specific risks.
Emotional Control:
Emotional discipline is essential. Both styles demand strict adherence to trading plans and avoidance of impulsive decisions.
Conclusion
Both intraday trading and swing trading offer opportunities to profit in financial markets but cater to different trader profiles, time commitments, and risk tolerances. Intraday trading focuses on rapid, short-term gains requiring intense monitoring and quick execution, whereas swing trading emphasizes medium-term trends, patience, and less stressful decision-making.
Choosing between these styles requires honest self-assessment of skills, capital, emotional resilience, and available time. Many successful traders blend both approaches strategically, capturing short-term moves while holding selected positions over days for larger trends. Ultimately, success depends not just on style, but on disciplined execution, strong risk management, and continuous learning in ever-changing markets.
XAUUSD H1 – Double Tap Liquidity & Reentry Setup🕊️ Market Context
Gold just delivered a beautiful liquidity sweep from the highs at 4148, after multiple CHoCH–BMS transitions confirmed structural bullish intent.
We are now seeing price forming equal lows, tapping the buy zone (4090–4085) — a clean H1 demand block aligned with the 0.618 retracement.
💎 Technical Analysis (SMC Perspective)
Structure:
Higher-timeframe structure remains bullish, following multiple BMS breaks to the upside.
Current pullback is corrective — a typical liquidity sweep to rebalance inefficiency.
BUY ZONE: 4090 – 4085 (SL 4080)
→ H1 Demand (OB) + 0.618 Fib confluence.
→ Watching for M15 CHoCH confirmation before entering long.
Target: 4148
→ Buy-Side Liquidity (BSL) resting above previous highs — likely magnet for the next push.
🪶 Trading Plan
I’ll wait patiently for a clean sweep + M15 confirmation around 4085–4090 to re-enter long.
As long as price respects 4080, my bias remains bullish, targeting the next BSL @ 4148.
No trade if price fails to confirm on lower timeframe — patience over impulse. 💛
💭 Karina’s Note
This setup perfectly reflects the essence of SMC — liquidity engineering before continuation.
It’s not about catching every move; it’s about aligning with the story the market is telling.
This is my personal view based on SMC principles – not financial advice.
✨ Like & Follow for daily London session updates ✨

Part 2 Intraday Master ClassThere are two main types of options — Call Options and Put Options.
a) Call Option
A Call Option gives the buyer the right (but not the obligation) to buy the underlying asset at a specified price (strike price) before the expiration date.
Buyers of call options are bullish — they expect the price of the asset to rise.
Sellers of call options are bearish or neutral — they believe the price will stay below the strike price.
b) Put Option
A Put Option gives the buyer the right to sell the underlying asset at a specific strike price before the expiration date.
Buyers of put options are bearish — they expect the price of the asset to fall.
Sellers of put options are bullish or neutral — they believe the price will stay above the strike price.

Part 2 Intraday Master ClassTraders use options for three main purposes:
Hedging: Investors use options to protect their portfolios from adverse price movements. For example, owning a put option can protect a stock investor from a market downturn.
Speculation: Traders buy or sell options to profit from expected movements in asset prices. Since options require a smaller initial investment compared to buying stocks directly, they offer higher potential returns—but also higher risk.
Income Generation: Many investors sell (write) options to earn premiums regularly. For example, covered call writing is a popular income strategy where investors sell call options on stocks they already own.
While options offer leverage and flexibility, they also carry risks—especially for sellers. The maximum loss for an option buyer is limited to the premium paid, but an option seller’s potential loss can be unlimited if the market moves sharply against them.

Master Institutional Trading🏛️ Master Institutional Trading
Unlock the secrets of how the smart money dominates the market
Learn to think, plan, and trade like top institutions and hedge funds.
What You’ll Master:
Advanced Market Structure – Breakouts, fakeouts & liquidity grabs
Smart Money Concepts – Accumulation & distribution like a pro
Order Flow & Volume Logic – Follow the real money
Entry & Exit Precision – Based on logic, not guesswork
Institutional Risk Management – Capital protection & scaling
Trader Psychology – Discipline, patience & strategy
No more random trades. No more emotional decisions.
This is structured, high-level trading built for serious traders.
📌 Master the mindset. Read the market. Trade like institutions.

Option Trading💼 Option Trading 📉📈
Leverage. Flexibility. Strategic Advantage.
Option Trading is a powerful segment of the financial markets where traders and investors use derivative contracts—known as options—to speculate, hedge, or generate income. Unlike traditional stock trading, options give you the right (but not the obligation) to buy or sell an asset at a predetermined price, within a specific time frame.
It’s a strategic tool used by everyone from retail traders to hedge funds to gain exposure with limited risk and amplified potential.
🔍 Key Concepts:
✅ Call Option – Gives the right to buy an asset at a fixed price (strike)
✅ Put Option – Gives the right to sell an asset at a fixed price
✅ Premium – The price paid to buy the option contract
✅ Strike Price – The level at which the option can be exercised
✅ Expiry Date – The date on which the contract expires
✅ In-the-Money / Out-of-the-Money – Describes the moneyness of a position relative to current price
⚙️ Why Trade Options?
🔹 Leverage – Control larger positions with smaller capital
🔹 Flexibility – Bullish, bearish, neutral—there’s a strategy for every view
🔹 Defined Risk – Max risk = premium paid (in buying options)
🔹 Income Generation – Sell options (covered calls, credit spreads) for passive income
🔹 Hedging – Protect existing stock positions from volatility or loss
Option trading isn’t gambling—it’s a game of precision, risk management, and market insight. To succeed, you need to master:

Advance Option Trading🔶 What Is Advanced Options Trading?
Advanced Options Trading goes beyond buying and selling simple Calls and Puts. It’s about using multi-leg strategies, managing risk with precision, applying greeks and volatility, and aligning your trades with market conditions.
Advanced traders treat options like a math-based chess game. They don’t gamble—they strategize, hedge, spread, and use data-driven decisions to extract profits in all kinds of markets (bullish, bearish, sideways, volatile, calm).
🔍 Why Learn Advanced Options Trading?
While beginners just "buy options" hoping for a quick profit, advanced traders use options to:
Control risk
Earn consistent income
Capitalize on volatility
Trade sideways or range-bound markets
Create hedges for portfolios
Use smart capital deployment with defined risk
2️⃣ Implied Volatility (IV)
IV tells you how expensive or cheap options are.
📈 High IV = Options are expensive → Ideal for selling
📉 Low IV = Options are cheap → Ideal for buying
Advanced traders use:
IV Rank / IV Percentile
Volatility skew analysis
Volatility crush trades around earnings or events
3️⃣ Option Strategies
Here’s where real skills come in. Advanced trading uses multi-leg strategies to limit loss, increase odds, or make money in non-directional moves.
🔍 Strategy Example: Iron Condor
Sell 22000 CE
Sell 21800 PE
Buy 22100 CE (hedge)
Buy 21700 PE (hedge)
You’ll profit if the index stays between 21800 and 22000, and time decay works in your favor.
✅ Defined risk
✅ Limited profit
✅ Great for expiry week if market is range-bound
💹 Advanced Techniques for Smart Trading
Let’s now explore how pros operate:
🔸 A. Delta-Neutral Trading
Institutional or advanced traders often create delta-neutral positions—no directional bias.
Example:
Buy Call option (Delta +50)
Sell Put option (Delta -50)
Net Delta = 0 → Neutral. The position doesn’t care which way market moves—only volatility or time decay matters.
🔸 B. Hedging with Options
Advanced traders hedge their stock or futures positions using options.
Example:
You hold ₹5 lakh worth of Reliance shares
You buy Reliance PUT options to protect downside risk
Result? You keep profits if stock goes up and protect capital if it drops. It's like insurance.
🔸 C. Trading Earnings or Events
Options let you trade volatility, not just direction. Ahead of events like:
Earnings reports
RBI or Fed meetings
Budget announcements
You can use:
Straddles / Strangles (if expecting big move)
Iron Condors (if expecting no major move)
Calendar spreads (to exploit IV difference)
🔸 D. IV Crush Strategy
Before major events, IV rises. After the event, IV drops (called IV crush).
Advanced traders:
Sell options before events (high premium)
Buy options after IV crash (cheap premium)
They know when NOT to buy options just before news—because premium is inflated!
🔸 E. Adjusting Trades
Advanced traders don’t just “hope” for success. If a trade goes wrong, they adjust it:
Roll to a new strike
Convert from debit to credit spreads
Hedge with opposite positions
Manage Delta/Theta/Vega exposure
This proactive style protects capital and increases recovery chances.
🛠️ Tools Used by Advanced Option Traders
Opstra / Sensibull – Strategy builder, Greek analyzer
TradingView – Charting & technical levels
OI Analysis Platforms – For understanding institutional footprints
Python / Excel – Custom backtesting tools
Algo Platforms – For speed and logic-based execution
📌 Important Rules for Advanced Option Traders
Don't chase trades. Let trades come to you.
Always define risk before entering.
Use multi-leg setups, not naked options unless there's an edge.
Stay Theta positive in low volatility markets.
Only buy options when IV is low and breakout is expected.
✅ Final Thoughts
Advanced options trading is a skillset—not a shortcut.
If you:
Want consistent profits
Wish to trade like institutions
Hate gambling and want a plan
Love logic, numbers, and control
…then advanced option trading is your next big step.
It gives you the tools to win in all market types, not just trending ones.

Learn Institutional Trading📌 What is Institutional Trading?
Institutional trading refers to trading done by large financial organizations like:
Hedge Funds
Mutual Funds
Foreign Institutional Investors (FIIs)
Domestic Institutional Investors (DIIs)
Insurance Companies
Proprietary Trading Firms (Prop Desks)
Investment Banks
🧭 Why Should You Learn Institutional Trading?
Most retail traders:
Enter trades based on emotions or random indicators
Chase price or react late
Trade without understanding who controls the market
But institutions:
Trade with logic, precision, patience, and volume
Follow clear rules based on liquidity, risk, and timing
Use data-driven strategies and structure-based entries
Learning institutional trading means:
✅ You no longer follow retail traps
✅ You align your trade with the market’s real direction
✅ You understand where and why price truly moves
🧱 Key Concepts to Learn in Institutional Trading
1. Market Structure (MS)
Institutional traders analyze price based on structure, not indicators.
They study:
Higher Highs / Higher Lows (HH/HL)
Lower Highs / Lower Lows (LH/LL)
Break of Structure (BOS)
Change of Character (CHOCH)
💡 Pro Tip: Price never moves randomly — it follows structure. Learning how price breaks previous structure shows when the trend is shifting.
2. Liquidity & Smart Money Concepts
Institutions need liquidity to place big orders. So, they look for:
Retail stop-loss zones
Breakout traders’ entries
Obvious support/resistance
Then, they:
Create fake breakouts to grab liquidity
Enter in the opposite direction
Leave behind “footprints” like Order Blocks or FVGs
📌 Important Concepts:
Liquidity Pools
Inducement Zones
Order Blocks (last candle before the move)
Fair Value Gaps (FVG)
Mitigation Zones
📊 Institutions don’t chase price — they manipulate it. Learn to trade where they are entering, not where retailers are exiting.
3. Volume Analysis & Order Flow
Institutions trade with massive capital, so their footprints show up in:
Volume spikes
Imbalance between buyers/sellers
Absorption (when large orders block the market)
Rejections at key zones
🔧 Tools used:
Volume Profile
Delta Volume / Footprint Charts
VWAP (Volume Weighted Average Price)
4. Options Data & Open Interest (OI)
Institutions use option chains to trap or hedge retail participants. They track:
Open Interest Build-up (Call or Put side)
Max Pain Level (where most options lose value)
Put/Call Ratio (PCR)
Option Writers’ Zone (where institutions want expiry)
💡 Example: If 80% OI is built on 22,000CE and price is near it, chances are high that institutions will protect that zone and keep price below it.
5. Institutional Tools & Analysis
Institutions use:
Multi-Timeframe Analysis (MTA)
News + Event Flow
Economic data + earnings
Position sizing based on volatility
Algo-driven execution
Retail traders often focus only on technical indicators — institutions use a combination of fundamentals, sentiment, macroeconomics, and flow.
🧠 Skills Needed to Trade Like Institutions
Chart Reading Without Indicators
Master price action
Understand structure, CHOCH, BOS
Supply and Demand Zone Identification
Mark strong OBs (Order Blocks)
Confirm with imbalance or FVG
Liquidity Mapping
Where will retail place SL?
What’s the inducement?
Volume + OI Reading
Use OI charts to avoid traps
Match price with volume for confirmations
Emotional Discipline
Trade with confidence
Trust your setup — not noise or tips
Risk Management
Fixed % per trade (0.5% to 1%)
SL below valid structure
📈 Example of an Institutional Setup (Bank Nifty)
Structure: Market is in a strong uptrend (HH-HL forming)
Liquidity: Price dips below previous swing low — stop-hunt likely
Order Block: 15-minute bullish OB forms with FVG
Volume: Spike seen + high OI on 49,500 PE
Entry: Bullish candle close in OB
SL: Just below OB
Target: Next liquidity zone or supply area
🔁 RR Ratio: 1:3 or better
🛠️ Tools You Can Use to Learn Institutional Trading
TradingView – Charting, structure, OBs
Chartink / Trendlyne – Option OI analysis
Sensibull / Obstra / Quantsapp – Option strategy + data
Volume Profile – Spot accumulation/distribution
ForexFactory / Investing.com – Economic calendar
Smart Money YouTube / Discord / Telegram Groups – Practice setups
🧩 Step-by-Step Plan to Learn Institutional Trading
Foundation: Learn market structure + price action
Deep Dive: Understand liquidity & smart money concepts
Tools Mastery: Volume, VWAP, OI, Option Chain
Live Practice: Backtest institutional setups
Risk System: Use proper SL, position sizing, and journaling
Mindset: Stay patient and emotion-free
Repeat: Improve setup confidence & refine edge
🚀 Final Thoughts: Trade Like an Institution, Not a Retailer
If you trade based on what’s obvious — you’re likely wrong.
If you trade based on what’s behind the move — you trade like the pros.
Institutional trading is not about complexity.
It’s about thinking ahead, managing risk, and waiting for real opportunities — not noise.

Monday Trade Plan (Nifty 50) 🔼 Bullish Levels (Call Side Entry):
Above 25,008
🔹 Hold CE (Call) — Positive trade view.
Above 25,118
🔹 Hold CE by Entry Level
🚨 Below this: Risky Zone for PE (Put)
Above 25,218
🔹 10 min Closing Short Cover Level
✅ Strong momentum expected above this zone
🔽 Bearish Levels (Put Side Entry):
Below 25,000
🔻 Hold PE — Negative trade view.
Below 24,888
🔻 Opening R1 10m — Hold PE by level
Below 24,788
🔻 Hold PE by level
Below 24,688
🔻 Hold PE by Safe Zone level
Below 24,600 (Approx)
🧯 UNWINDING ZONE
🔻 Strong downward momentum expected
⚠️ Mid-Zone / Risk Areas:
Between 25,000 – 25,008: No clear direction
Between 25,088 – 25,118: Risky Zone for PE
Between 24,788 – 24,888: Rangebound area, watch for breakout

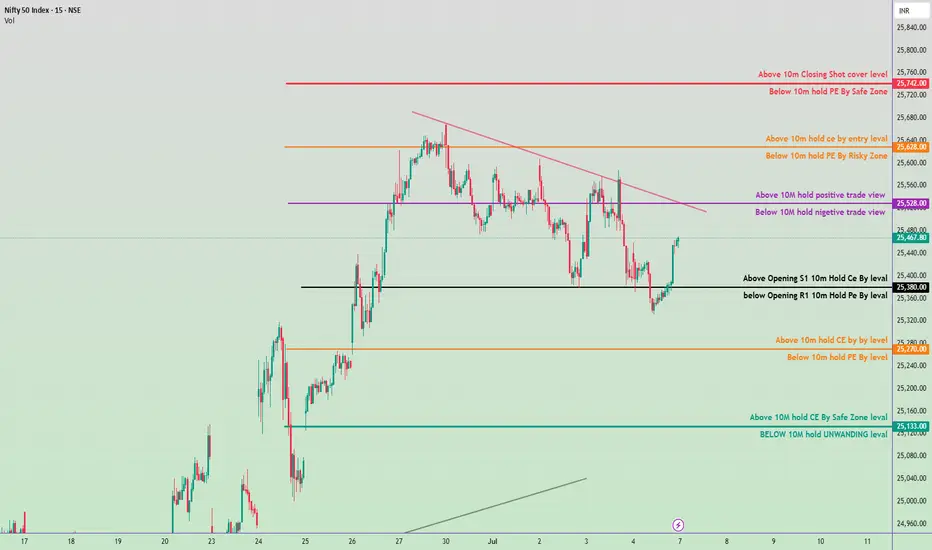
Nifty 50 Intraday Trade Plan - 7 July 2025✅ Bullish Zones (Call Option - CE Buy Levels):
Above 25,133 ➤ Hold CE by Safe Zone level
Above 25,270 ➤ Hold CE by key level
Above 25,380 ➤ Opening S1 Breakout – Hold CE
Above 25,528 ➤ Positive Trade View (10M volume base)
Above 25,628 ➤ Entry level for CE holding
Above 25,742 ➤ Closing Shot – Cover Short Positions
🔻 Bearish Zones (Put Option - PE Buy Levels):
Below 25,133 ➤ Unwinding Level – Hold PE
Below 25,270 ➤ Key level – Hold PE
Below 25,380 ➤ Opening R1 Breakdown – Hold PE
Below 25,528 ➤ Negative Trade View
Below 25,628 ➤ Risky Zone for holding PE
Below 25,742 ➤ Safe Zone for holding PE
🔁 Trendline & Structure Notes:
Downtrend resistance visible around 25,528–25,628 zone.
If price breaks above trendline and sustains, expect bullish momentum.
Support near 25,133 and strong base seen around 25,000 zone.
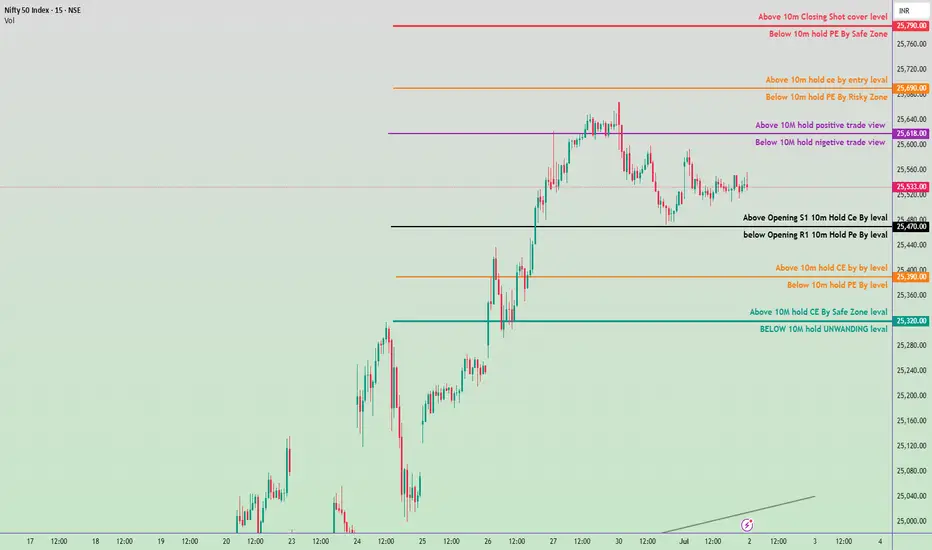
Nifty 50 Intraday Trade Plan 2nd july 2025🔼 Bullish Zones (Calls/CE preferable)
Above ₹25,790 → Closing Shot cover level
Above ₹25,760 → Hold PE by Safe Zone ends
Above ₹25,690 → Entry level for CE (Calls)
Above ₹25,618 → 10M hold positive trade view
Above ₹25,470 → Opening S1 | 10M Hold CE by level
Above ₹25,390 → 10M hold CE by Buy level
Above ₹25,320 → 10M hold CE by Safe Zone level
🔽 Bearish Zones (Puts/PE preferable)
Below ₹25,760 → Hold PE by Safe Zone starts
Below ₹25,690 → Risky Zone for PE
Below ₹25,618 → 10M hold negative trade view
Below ₹25,470 → Opening R1 | 10M Hold PE by level
Below ₹25,390 → 10M hold PE by level
Below ₹25,320 → UNWINDING level (Strong support loss)
📌 Trade Plan Guidelines
🔹 Above ₹25,618 with volume: Favor CE (calls), look for targets up to ₹25,690–₹25,790.
🔹 Below ₹25,470 with confirmation: Favor PE (puts) toward ₹25,390–₹25,320.
🔹 Avoid trading between ₹25,470–₹25,618 if price is consolidating — this is a neutral “no trade zone”.
📉 Below ₹25,320, expect strong unwinding.
Nifty 50 – Tomorrow’s Intraday Trade Plan (1st July 2025)
🔴 Bullish Zones (Call Option Focus)
₹25,790.00 – Above 10M Closing Shot Cover Level
₹25,770.00 – Above 10M Hold CE by Entry Level
₹25,700.00 – Above 10M Hold CE by Entry Level
₹25,590.00 – Above 10M Hold Positive Trade View
₹25,413.00 – Above Opening S1 10M Hold CE by Level
₹25,290.00 – Above 10M Hold CE by Level
₹25,113.00 – Above 10M Hold CE by Safe Zone Level
🔵 Bearish Zones (Put Option Focus)
₹25,790.00 – Below 10M Hold PE by Safe Zone
₹25,690.00 – Below 10M Hold PE by Risky Zone
₹25,590.00 – Below 10M Hold Negative Trade View
₹25,363.00 – Below Opening R1 10M Hold PE by Level
₹25,250.00 – Below 10M Hold PE by Level
< ₹25,113.00 – Below 10M Hold = UNWINDING Zone

Nifty 50 Intraday Trade Plan for June 27, 2025✅ Bullish Trade Plan (Call Option / CE)
Above 25478 hold
🔹 Level: Above Opening S1 10m Hold CE By level
🔸 Action: Buy CE if price sustains above this level
🔸 Target 1: 25,638 – Above 10M hold positive trade view
🔸 Target 2: 25,770 – Above 10m hold CE by entry level
🔸 Target 3: 25,880 – Below 10m hold PE by Safe Zone
🔸 Target 4: 25,900 – Above 10m Closing Shot cover level
❌ Bearish Trade Plan (Put Option / PE)
Below 25,638
🔹 Level: Below Opening R1 10m Hold PE By level
🔸 Action: Buy PE if price falls below this level
🔸 Target 1: 25,378 – Below 10m hold PE By level
🔸 Target 2: 25,178 – Above 10M hold CE By Safe Zone level

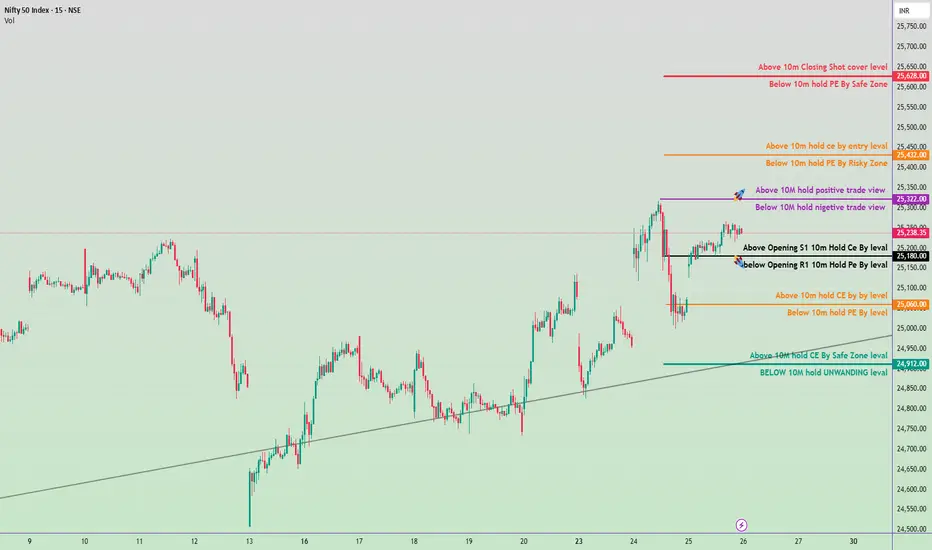
June 26, 2025 Nifty 50 breakout & breakdawon Levals✅ Bullish View Zones:
(Call Option CE Focus)
Above 25,630 – 10m Closing Shot cover level
Above 25,432 – 10m hold CE by Entry level
Above 25,322 – 10M hold: Positive trade view
Above 25,180 – Opening S1 + 10m hold CE by level
Above 25,060 – 10m hold CE by level
Above 24,912 – 10M hold CE by Safe Zone level
❌ Bearish View Zones:
(Put Option PE Focus)
Below 25,630 – 10m hold PE by Safe Zone
Below 25,432 – 10m hold PE by Risky Zone
Below 25,322 – 10M hold: Negative trade view
Below 25,180 – Opening R1 + 10m hold PE by level
Below 25,060 – 10m hold PE by level
Below 24,912 – 10M hold UNWINDING level
CRUDE OIL - Short and Long Oppurtunity in INTRADAY 20 Dec 2024Price break the support line (Black color) formed since 11 Dec and it looks like it is time to Short. Also, Monthly CPR Pivot range comes under the support line so there will be oppurtunity for Long if price touch 8840 and reverses and go inside the channel.

BEL Intraday 26Nov BEL has given good momentum and retracement.
Can be long as given in chart with SL either previous day low or 13 ema as per risk apetite.
Disclaimer: Only for entertainment purposes, not an investment advice.

BUY ABOVE 450 BUY AND HOLD
Best buy above 450
NSE:GICRE
Nice buying opportunities rsi rsi taking
60 support on monthly candle
Fii holdng increase
Dii holding increase
85 % promoter holdin

PNB, Intraday View for 30-MayToday we have an inverted Hammer candle.
The price is trading in the compression zone.
The probability on the down side is more than 50%.
CMP-128.05
The price could test the levels of 123.50
And if reversed then the level of 131.55 is important.
Disclaimer: This is my pre market analysis and my trading journal. Not a suggestion to buy or sell.

What number will gold end the trading session at?Dear beloved readers, gold continued its recovery on the last trading day of the week, trading around $2,340 and marking a 0.3% increase for the day.
As a result, the USD faced further disadvantages last night, creating momentum for the recovery of XAUUSD. In the short term, this metal continues to receive support from investors as it maintains a strong upward trend within the price channel, with a support level established at $2,330. The target is to reach the upper limit of the price channel, with gold potentially reaching $2,350 and possibly even higher by the end of the session.

NIFTYNXT50-NIFTYJR Intraday Prediction Levels for 24 April 2024The chart indicates 15 min time frame. These Levels act as Support and Resistance according to position of price. These are strictly for Intraday Trading only. Execution only after break out and close above the Resistance zone or break down and close below the Support zone.
These levels act as support and resistance. You have to trade according to level breakout or breakdown.
To buy or sell you can follow Buy/Sell Indication given by indicator or you can follow cloud also.
If you are a new trader then just watch (No Trade) these levels for some days.
Happy trading.
Disclaimer:
I am not a SEBI Registered Analyst. Anything posted here is my own analysis and views. This is created for educational purposes only. Always consult with your Financial Advisor before taking any decision or trade.
