Intraday Trading Strategies (Cash Market)1. Basics of Intraday Trading in the Cash Market
In intraday trading:
Positions are not carried overnight
Trades are based on technical analysis
Decisions depend on price action, volume, and market sentiment
Risk is controlled using stop-loss orders
Liquidity plays a major role. Traders prefer high-volume stocks, as they allow easy entry and exit without major price slippage.
2. Importance of Market Timing
The Indian stock market has specific intraday phases:
Opening Hour (9:15–10:15 AM): High volatility, suitable for momentum strategies
Mid-Session (10:30–1:30 PM): Range-bound movement, suitable for scalping
Closing Session (2:30–3:30 PM): Trend continuation or reversal
Understanding these phases helps traders choose the right strategy at the right time.
3. Common Intraday Trading Strategies
3.1 Opening Range Breakout (ORB)
This strategy focuses on the first 15–30 minutes of trading.
Identify the high and low of the opening range
Buy if price breaks above the high
Sell if price breaks below the low
Volume confirmation is essential
This strategy works best on strong trending days.
3.2 Trend Following Strategy
Trend trading involves identifying the direction of the market and trading along with it.
Use indicators like VWAP, Moving Averages (20 EMA, 50 EMA)
Buy in an uptrend on pullbacks
Sell in a downtrend on rallies
The key rule: Never trade against the trend.
3.3 VWAP Strategy
VWAP (Volume Weighted Average Price) is widely used by intraday traders.
Price above VWAP → bullish bias
Price below VWAP → bearish bias
Trades are taken near VWAP with confirmation
VWAP acts as a dynamic support and resistance level during the session.
3.4 Breakout Trading Strategy
Breakout trading involves entering trades when price moves beyond:
Previous day high/low
Intraday resistance or support
Consolidation zones
Breakouts with high volume are more reliable. False breakouts are common, so stop-loss placement is critical.
3.5 Pullback Strategy
After a strong move, price often retraces before continuing.
Identify strong momentum stocks
Wait for a pullback to support or moving average
Enter when price resumes the original direction
This strategy offers low risk and high reward.
3.6 Range Trading Strategy
Used during sideways markets.
Buy near support
Sell near resistance
Use oscillators like RSI or Stochastic
Range trading should be avoided on strong trending days.
3.7 Scalping Strategy
Scalping focuses on very small price movements.
Multiple trades per day
Small targets and tight stop-loss
Requires fast execution and discipline
Scalping is mentally demanding and suitable for experienced traders.
4. Technical Indicators Used in Intraday Trading
Popular indicators include:
Moving Averages (EMA/SMA)
VWAP
RSI (Relative Strength Index)
MACD
Volume & Volume Profile
Support and Resistance Levels
Indicators should support price action, not replace it.
5. Stock Selection for Intraday Trading
Ideal intraday stocks have:
High volume and liquidity
Narrow bid-ask spread
News or sector momentum
Clean price movement
Avoid illiquid stocks as they increase risk.
6. Risk Management – The Core of Intraday Trading
No strategy works without risk management.
Risk only 1–2% of capital per trade
Always use a stop-loss
Maintain a risk-reward ratio of at least 1:2
Avoid over-trading
Protecting capital is more important than making profits.
7. Trading Psychology in Intraday Trading
Intraday trading demands strong emotional control.
Avoid revenge trading
Stick to your plan
Accept losses as part of the game
Discipline beats intelligence
Many traders fail not because of strategy, but because of poor psychology.
8. Common Mistakes to Avoid
Trading without a plan
Ignoring stop-loss
Over-leveraging
Trading too many stocks
Chasing price after big moves
Consistency comes from process, not excitement.
9. Building a Simple Intraday Trading Plan
A basic plan includes:
Market bias (bullish/bearish/neutral)
Entry and exit rules
Risk per trade
Maximum trades per day
Journal for review
A trading plan converts randomness into structure.
10. Conclusion
Intraday trading in the cash market offers excellent opportunities but also carries significant risk. Success depends on strategy selection, timing, discipline, and risk management rather than prediction. Traders should focus on mastering one or two strategies, practice them consistently, and continuously review their performance.
In intraday trading, capital preservation comes first, profits follow naturally.
Intradaytrading

XAUUSD – H2 Technical AnalysisXAUUSD – H2 Technical Outlook: Short-Term Sell Pressure as Liquidity Gets Cleared | Lana ✨
Gold is showing signs of short-term weakness after an aggressive upside expansion. Price action suggests the market may continue to move lower in the near term, not as a trend reversal, but as a liquidity-driven correction within a broader bullish structure.
At this stage, the focus shifts from continuation to how price behaves while liquidity is being taken below structure.
📈 Market Structure & Price Behavior
The recent vertical rally has left the market overextended, making a corrective phase technically healthy.
Price has broken below short-term support and is now trading under a descending corrective trendline, signaling short-term bearish pressure.
This type of structure often develops when the market needs to clean buy-side positions before rebuilding for the next leg.
While the higher-timeframe trend remains bullish, the intraday bias has shifted to corrective / bearish until liquidity objectives are met.
🔍 Key Liquidity Zones on the Chart
Short-term sell zone: the descending trendline near current price As long as price reacts below this trendline, rallies are more likely to be sold.
Scalping buy liquidity: around 5050–5070 This area may generate temporary bounces, but reactions here should be treated as short-term only.
Key bullish order block: 4825 – 4830 A critical zone where stronger buyer participation may appear if the sell-off extends.
Major swing liquidity zone: 4613 – 4625 This is a high-confidence liquidity pocket where the market could complete a deeper correction and reset the broader bullish structure.
🎯 Trading Scenarios
Primary scenario – Continuation of the pullback: As long as price remains below the descending trendline, gold may continue to move lower to sweep liquidity below recent lows. This favors sell-on-rallies rather than buying strength.
Secondary scenario – Temporary reaction: Short-term bounces may occur around the 5050–5070 area, but without structural reclaim, these moves are more likely corrective than trend-changing.
Structural defense scenario: If price reaches the 4825–4830 or 4613–4625 zones, watch closely for signs of stabilization and absorption, which would signal that the liquidity objective has been completed.
🧠 Lana’s View
This move lower is best seen as liquidity cleanup, not panic selling. Lana stays patient during corrective phases, avoiding early longs and waiting for price to reach clear liquidity zones before reassessing bullish continuation.
✨ Let the market take what it needs, then look for structure to rebuild.

Gold at Make-or-Break Zone | Channel Support Under TestGold is currently trading inside a rising channel and has pulled back toward the lower side of the structure. This move looks more like a healthy correction rather than a breakdown, as long as price continues to hold the marked support area.
If buyers step in near channel support, upside continuation remains possible toward the higher zone. A clear break below support, however, would weaken the structure and shift the bias to the downside. For now, this is a wait-and-react zone, not a chase.
⚠️ Disclaimer
This analysis is for educational purposes only and should not be considered financial advice. Trading involves risk. Please do your own research and use proper risk management.

GBPUSD – Support Holding, Watching Reaction From RangeGBP/USD has reacted from a well-defined support zone, an area where buyers have stepped in multiple times before. Price is currently trading between clear support and resistance, indicating a short-term range environment.
As long as this support holds, upside reactions toward the resistance zone remain possible. A clean break below support, however, would weaken this structure and change the short-term bias.
This is a reaction-based zone, not a prediction. Let price confirm the next move.
Disclaimer: This analysis is for educational purposes only and does not constitute financial advice. Trading involves risk. Please manage risk responsibly.

Gold Price Action Update-Clean Breakout with Clear Targets AheadGold has finally broken above the falling trendline, confirming a short-term shift in momentum. The breakout is clean, and price is now holding above the breakout area, which keeps the bullish continuation scenario active.
As long as price respects the highlighted support zone, pullbacks can be used for long opportunities toward the marked upside targets. A break below the invalidation level would cancel this setup, so risk management remains key.
This is a structure-based trade, not a chase.
KEY LEVELS
Entry Zone: 4671 – 4668
1st Target: 4678
2nd Target: 4684
Final Target: 4690
Stop Loss: 4660
Disclaimer
This analysis is for educational purposes only and should not be considered financial advice. Trading involves risk. Please do your own research and use proper risk management.

Gold Hits Resistance Inside Rising Channel | Short-Term PullbackHello Everyone, i hope u all will be doing good in your life and your trading as well, let;s analyise Gold as it is trading inside a rising channel, but price is currently facing strong resistance near the channel top. The recent move shows signs of rejection, which opens the door for a short-term pullback, not a trend reversal.
This is a counter-trend short focused only on a corrective move. As long as price stays below the marked resistance zone, selling pressure can continue toward lower channel support. Buyers are still in control on higher timeframes, so shorts should remain quick and disciplined.
Key Levels
Short Zone: Near channel resistance
Pullback Targets: 4625 → 4610 → 4597
Invalidation: Above 4660
Disclaimer This analysis is for educational purposes only and should not be considered as financial advice. Trading involves risk. Please do your own research and use proper risk management before taking any trade.
Analysis By @TraderRahulPal | More analysis & educational content on my profile.
If this update helped, like and follow for regular updates.

XAUUSD (Gold) | Technical Outlook | 9th Jan'2026XAU/USD – Gold Technical Outlook (Jan 9, 2026)
Gold (XAU/USD) is trading near 4,474 and continues to show a strong bullish structure across intraday and higher timeframes. Price is holding firmly above all major moving averages (MA 5–MA 200), signaling sustained buying strength.
Momentum indicators remain supportive with RSI around 59, MACD positive, and ADX above 30, confirming trend continuation rather than exhaustion.
As long as price holds above 4,470, the upside remains favored toward 4,481 → 4,489 → 4,501. Any dip toward 4,462–4,450 may be viewed as short-term profit booking, while the broader trend stays bullish unless 4,430 breaks decisively.
⚠️ Disclaimer: This content is for educational purposes only. Not financial advice.

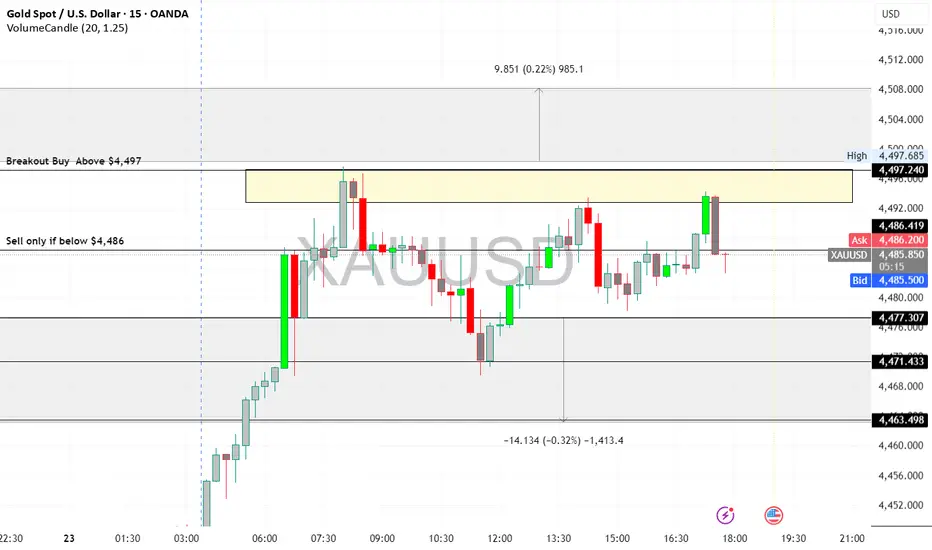
XAUUSD (Gold) Intraday Outlook - 23/12/2025XAU/USD Trend: Strong Bullish
Current Price: $4,491.99
Key Levels:
Support: $4,486 / $4,479
Resistance: $4,497 / $4,501 / $4,508
Pivot: $4,490
Strategy:
Buy on dips: $4,486–$4,479 → Target $4,497–$4,501
Breakout buy: Above $4,497 → Target $4,501–$4,508
Sell only if below $4,486
Gold remains bullish; prefer buying on dips or breakouts, keep stops tight near support.
Disclaimer: Trading involves risk. This analysis is for educational purposes only and is not financial advice. Trade responsibly.
BSE LTD Intraday| 23 Dec 2025| +45 Points Clean Short Setup23 Dec 2025 | Simple & Easy BTR Indicator Setup
Consistency comes from simplicity — and today BTR proved it again.
Another smooth intraday short trade executed perfectly in BSE LTD, with clear entry, logical stop-loss, and disciplined exit.
🔍 Trade Overview
• Stock: BSE LTD
• Date: 23/12/2025
• Timeframe: 15-Minute
• Indicator Used: BTR Indicator ONLY
🔴 Entry Logic (Short)
✔ BTR generated a clear BEARISH signal
✔ Breakdown after rejection from higher levels
✔ Momentum shifted completely in sellers’ favor
🔻 SHORT ENTRY: 2755
🛑 Stop-Loss (Risk First)
📌 SL placed above recent Swing High
📌 Clean structure-based stop
📌 No guesswork, no emotional SL movement
🎯 Exit Execution
✔ Follow the system, follow the exit
✔ Price continued lower smoothly
🟢 EXIT BOOKED: 2715
📉 TOTAL PROFIT: +45 POINTS
🧠 Why This Trade Was Easy
✔ Clear BTR signal
✔ Strong bearish follow-through
✔ Proper SL placement
✔ No over-trading, no indicator clutter
📌 Strategy Rule
❌ No prediction
❌ No noise
❌ No multiple indicators
✅ Only BTR Indicator
✅ Follow entry & exit rules
✅ Trade becomes effortless
🔥 Final Thought
Trading is not about being right every time —
it’s about executing the same edge repeatedly.
BTR continues to deliver high-probability intraday setups in both directions.
📊 Follow for daily BSE intraday trades
💬 Comment / DM if you want to trade using BTR Indicator
Simple Rules. Clean Charts. Consistent Profits. 📉📈 NSE:BSE
📌 You can find the BTR Indicator in my TradingView profile → Scripts section
👉 Open my profile
👉 Go to Scripts / Indicators
👉 Add BTR Indicator to your chart
👉 Trade with zero noise & clear signals
Follow BTR. Follow Discipline. Trade Simple. ✅
If you want, I can also give you:
• A pinned profile bio line
• A comment reply template for followers
• A step-by-step “How to use BTR” post
Just tell me 👍

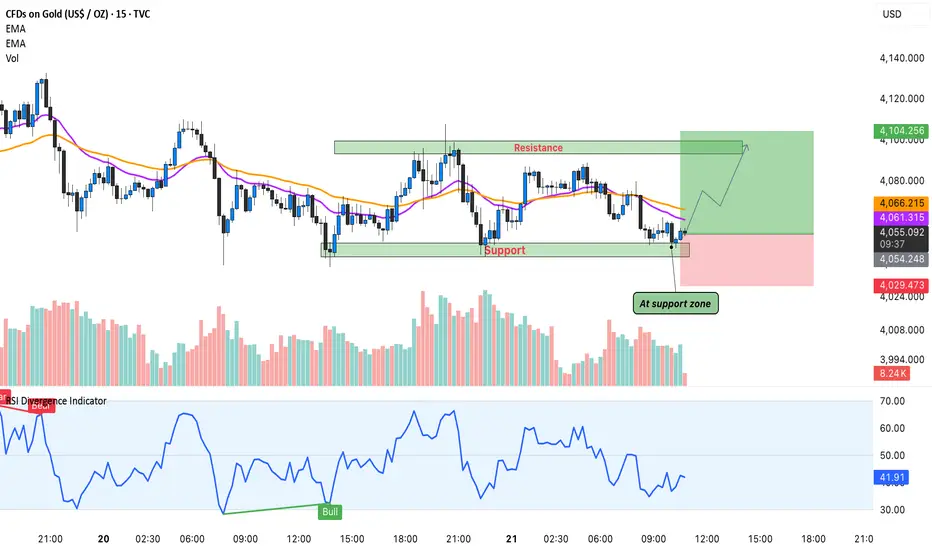
Gold’s Intraday Reversal – Buyers Stepping In!Hello Guy's Let's analyse Gold and it is once again respected the intraday support zone highlighted on the chart. This level has acted as a strong demand area multiple times, and today price reacted from the same zone with clear bullish intent.
Price is also sitting above EMA 20 & EMA 50, and the RSI bullish divergence confirms that momentum could be shifting back toward the upside.
If buyers hold this support, we can see a short-term push toward the 4,090–4,105 resistance region. A clean breakout above that may open more upside, but for now the focus remains on this bounce setup.
This is not breakout trading, this is simply reacting to a level where buyers have shown strength many times.
As long as this support holds, the risk-reward favors the bullish side.
Analysis By @TraderRahulPal | More analysis & educational content on my profile.
Deepak Fertilizer - Technical AnalysisDEEPAK FERTILISERS & PETROCHEMICALS CORPORATION LTD.
CMP:1,453.32
CHART OBSERVATIONS
Strong Historical Momentum: Stock showed powerful uptrend with 4 months of continuous momentum building base for next upside.
EMA Confirmation: Multiple EMAs sorted bullishly in both Monthly and Weekly timeframes
Higher Lows Pattern: Price forming higher lows indicating retracement / accumulation.
Trendline Support: Blue descending trendline acting as dynamic support.
Current Structure
Consolidation Phase: Stock consolidating in a defined range after significant rally
Breakout Setup: Price testing resistance of descending trendline - potential breakout candidate
KEY TECHNICAL LEVELS
Resistance Zones (Upside Targets)
- Target 1: 1,778.60
- Target 2: 2,020.60
- Target 3: 2,328.45
- Target 4: 2,668.30
Support Zone
- Accumulation Zone: 1,400 - 1,200 (highlighted in blue rectangle)
TRADING STRATEGY
Conservative Approach:
- Accumulate in parts within the blue zone (1,200 - 1,400)
- Conservative entry can be taken when trendline breaks or price action confirms
Aggressive Approach:
- Entry when 5% upmove is seen in stock price from current levels
- Breakout above descending trendline with volume confirmation
Risk Management
- Stop Loss: Close below 1,132 on weekly closing basis
- Position Sizing: Allocate 2-3% of portfolio per position
- Pyramiding: Add positions on dips within accumulation zone
Target Achievement Timeline
- T1 (1,778): Short to Medium term (3-6 months)
- T2-T4: Medium to Long term (6-18 months)
CONCLUSION
Deepak Fertilisers is displaying a healthy technical setup with strong foundational support from EMA structure across multiple timeframes. The current consolidation offers an attractive risk-reward opportunity for accumulation. Patient investors can build positions in parts, while momentum traders should wait for trendline breakout confirmation.
The stock has demonstrated robust momentum historically and appears to be building base for next leg of upside movement.
DISCLAIMER:
This analysis is for educational and informational purposes only and should not be construed as investment advice or a recommendation to buy, sell, or hold any securities.
- Past performance is not indicative of future results - Stock markets are subject to risks including loss of principal - The author is not a SEBI registered analyst/advisor
- This is a personal view based on technical analysis only - Investors are advised to consult with certified financial advisors before making investment decisions - The author does not guarantee accuracy of data or projections - Trading/Investing in securities is subject to market risks
#DEEPAKFERT #TechnicalAnalysis #StockMarket #NSE #FertilizerStocks #SwingTrading #PositionalTrading

Part 2 Intraday Master ClassTraders use options for three main purposes:
Hedging: Investors use options to protect their portfolios from adverse price movements. For example, owning a put option can protect a stock investor from a market downturn.
Speculation: Traders buy or sell options to profit from expected movements in asset prices. Since options require a smaller initial investment compared to buying stocks directly, they offer higher potential returns—but also higher risk.
Income Generation: Many investors sell (write) options to earn premiums regularly. For example, covered call writing is a popular income strategy where investors sell call options on stocks they already own.
While options offer leverage and flexibility, they also carry risks—especially for sellers. The maximum loss for an option buyer is limited to the premium paid, but an option seller’s potential loss can be unlimited if the market moves sharply against them.

What is Pre-Open Market & Why It Decides Opening Price?Hello Traders!
Every morning before the actual market opens, there’s a small window called the pre-open market .
Many traders ignore it, but this session actually decides the official opening price of stocks and indices like Nifty and BankNifty.
Let’s break it down in simple words.
1. What is Pre-Open Market?
The pre-open market runs from 9:00 AM to 9:15 AM on NSE and BSE.
From 9:00 to 9:07: You can place, modify, or cancel orders.
From 9:08 to 9:12: The system matches buy and sell orders to determine the equilibrium price.
From 9:12 to 9:15: Buffer period for smooth transition before normal trading.
So the actual market starts at 9:15 AM, but prices are already decided during pre-open.
2. Why is Pre-Open Market Important?
Price Discovery: It balances demand and supply to find the most fair opening price.
Handles Overnight News: Any news like global market moves, company announcements, or results gets adjusted here before regular trading begins.
Reduces Volatility: Instead of opening with wild gaps, pre-open absorbs much of the shock by adjusting orders.
Sets the Tone: Traders watch pre-open levels to guess the likely direction of Nifty, BankNifty, and major stocks.
3. How Traders Can Use Pre-Open Data
Check which stocks have unusual activity in pre-open. It may signal big news or institutional interest.
Watch Nifty and BankNifty equilibrium prices to prepare your intraday levels.
Don’t rush to place orders blindly in pre-open, volumes are thin, and price can be misleading at times.
Rahul’s Tip:
Pre-open market is like a “warm-up” before the real game starts. Use it for signals, but always confirm with regular session price action.
Conclusion:
The pre-open market may look small, but it plays a big role in deciding how the day begins.
By understanding how it works, you can avoid surprises and be better prepared for the opening bell.
This educational idea By @TraderRahulPal (TradingView Moderator) | More analysis & educational content on my profile
👉 If this post made pre-open clearer for you, like it, share your thoughts in comments, and follow for more simple market education!
Zota Healthcare Higher High Pattern Zota healthcare moving Up in a pattern . It's bullish Since many Months. You can Study Chart of last 2 Year. It's moving up in Pattern with Retracement. So it's very good.
You can make 5 -10% Easily in this Stocks. Keep SL 5%
It may be in Consolidation before moving up as u see same happened in last some days.
But it may move up with volume.
Visit my Tradingview Profile for more information.
Consult your financial advisor before making any position in stock market.

STT Explained – The Silent Tax That Eats Into Your Profits!Hello Traders!
Many traders calculate their profit after entry and exit, but forget a hidden cost that reduces it every single time: STT (Securities Transaction Tax) .
It doesn’t look big on paper, but over time it silently eats into your profits. Let’s break it down in simple terms.
What is STT?
STT is a tax charged on the value of every buy/sell transaction in equities, derivatives, and ETFs.
It was introduced to generate revenue for the government and applies to all market participants.
Example: If you buy shares worth ₹1,00,000, you pay a small percentage as STT. The same applies when you sell. In options and futures, it’s mostly charged on the sell side.
Where Does STT Apply?
Equity Delivery: STT applies on both buy and sell transactions.
Equity Intraday: STT is charged only on the selling side.
Futures: STT applies only on the sell side of the contract.
Options: STT applies on the sell side, but at a higher rate compared to futures.
Why Traders Must Care About STT
It Reduces Net Profit: Even if your trade looks profitable on the chart, STT takes away a portion. In short-term trading, these small cuts add up.
Impacts Scalpers & Option Sellers Most: Since they do high-frequency trading, STT can eat into a large chunk of their returns.
Hidden in Brokerage Statements: Many traders blame “brokerage” for high costs, but in reality, STT is often the bigger factor.
Rahul’s Tip:
Always calculate the real cost of trading , not just entry and exit points. Brokerage, STT, GST, exchange fees, all matter.
Sometimes the best trade is not the most frequent one, but the one with the best cost-to-profit balance.
Conclusion:
STT may look small, but it has a big impact over time.
The difference between a losing trader and a winning trader is often not the strategy, but how well they manage costs like STT.
If this post cleared your doubts on STT, like it, drop your experience in comments, and follow for more trading education that really matters!
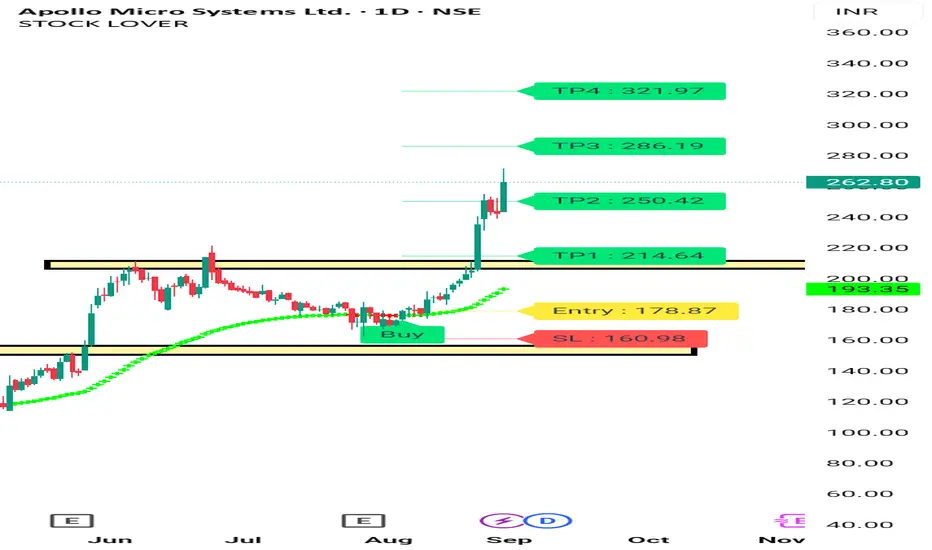
APOLLO MICRO SYSTEM BULLISH CHART APOLLO micro system chart posted on tradingview on 24 Aug , it's moved 12% Since then. It's win a order . Chart Shows u movement before news . Keep Following Us and Enjoy. For More, watch my Profile.
Consult your financial advisor before making any position in stock market. My all views are for educational purposes only.
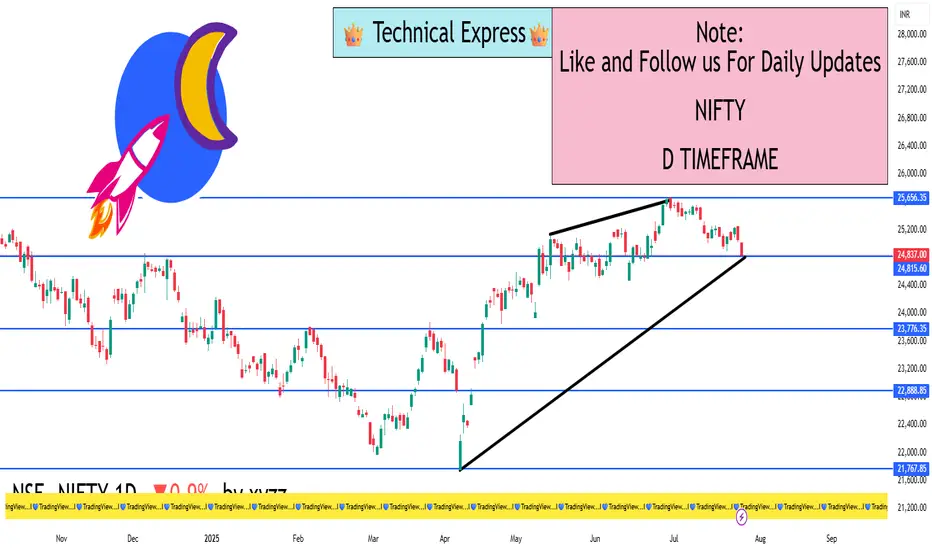
Nifty: The Unfilled Gap ScenarioNifty 1H Price Action Analysis (Week of 25th Aug) ⏰
Hey Traders! Let's break down the Nifty's juicy setup for the week.
The market left us a gift: The Nifty's powerful gap-up has left a major unfilled gap (24673 - 24852), a 179-point void that's calling price back! 📞🔻 Gaps are like market magnets 🧲—they have a strong tendency to get filled. Price has already tapped twice (18th & 22nd Aug) at the gap's roof (24850), treating it like a trampoline. But how long can the bounce last?
📍 The Key Levels & The Story:
The Floor (24850): This is our line in the sand. A solid break and close below this on the 1H chart could open the trapdoor 🚪, sending Nifty on a quick ride down to grab those gap points. It's the trade with the wind at its back.
The Ceiling (25150): This is the recent high and descending trendline resistance. A break above is exciting, but we're smart traders—we don't chase! 🏃💨 We've all been fakeout victims.
✅ The Bullish "No Fakeout" Plan:
To avoid getting trapped, we wait for a "Break-and-Retest"! If price punches above 25150, we don't buy the breakout. We wait patiently for price to come back and kiss the 25150 level and hold it as new support. That is our green light 🚦 and the high-probability long entry for a continued upmove!
The Bottom Line: Bears are eyeing the gap. Bulls need to prove their strength with a clean break and hold above 25150. Neutral until one side wins!
Bank Nifty Hint: Unlike Nifty, Bank Nifty has already filled its similar gap, suggesting Nifty might be next in line to complete the move.
Trading Plan:
Short Signal: Break & close below 24850. 🎯 Target: The Gap Zone.
Long Signal: Break ABOVE 25150, then wait for a pullback that finds support at 25150.
⚠️ Disclaimer: This is strictly an intraday idea for educational purposes. Trading is incredibly risky and you can lose your capital. This is not advice.
Found this helpful? Please give it a Boost! 🔥
What stocks should we dive into next? Let me know below! 👇😊

Institutional Trading Strategies🔍 What Is Institutional Trading?
Institutional trading refers to how large financial institutions, such as hedge funds, investment banks, mutual funds, insurance companies, and pension funds, buy and sell large volumes of stocks, options, futures, and other financial instruments in the market.
Unlike retail traders (individual traders), institutions trade with massive capital, often in millions or billions of dollars. Their actions can move the market, and they use advanced tools, data, and strategies to protect their capital and maximize profit.
🏦 Who Are the Institutional Players?
Here are examples of institutional traders:
BlackRock
Vanguard
JP Morgan
Goldman Sachs
Citadel
Morgan Stanley
HDFC AMC / SBI MF (India context)
These entities manage huge portfolios for clients or for themselves and use highly strategic methods to execute trades.
⚙️ Why Are Their Strategies Different?
Institutional traders have several advantages over retail traders:
Access to better data (real-time order flow, economic models)
Advanced technology (high-frequency trading algorithms)
Lower transaction costs (thanks to bulk volume deals)
Connections (direct access to liquidity providers, brokers)
Skilled teams (analysts, quant traders, risk managers)
But there’s a big challenge: Their trades are so large, they can’t buy or sell in one go. If they do, they’ll cause huge price moves (called slippage). So they use smart strategies to enter and exit positions quietly without alerting the market.
🧠 Core Institutional Trading Strategies
Here are the most important trading strategies used by institutions:
1. 📊 Volume-Based Trading (Accumulation & Distribution)
Institutions use a strategy of accumulating large positions over time (buying slowly) and later distributing (selling slowly). This is done to hide their true intent from the market.
Accumulation Phase: Buying gradually in small chunks to avoid price spikes.
Distribution Phase: Selling in a quiet way so they don’t crash the price.
They might accumulate shares for weeks or months, often using dark pools or algorithms to keep their activity hidden.
2. 🏦 Order Flow Analysis / Tape Reading
Institutional traders track real-time order flow — meaning they study the buy/sell pressure using tools like:
Level 2 (market depth)
Time & sales (ticker tape)
Footprint charts
Delta volume
They watch where large orders are being placed, pulled, or spoofed, giving insight into what other big players are doing.
3. 💻 Algorithmic & High-Frequency Trading (HFT)
Institutions use algorithms (algos) to place thousands of trades per second. These bots follow specific rules based on:
Market trends
Arbitrage opportunities
Statistical models
HFT strategies are extremely fast, aiming to profit from tiny price differences in milliseconds.
4. 🧱 Quantitative Trading
Quant funds like Renaissance Technologies or D.E. Shaw use math, coding, and machine learning to create models that predict price movements.
They may build systems that factor in:
Price action history
News sentiment
Economic indicators
Correlation between assets
Volatility, interest rates
These are not human trades – the models execute trades based on data patterns.
5. 🧩 Options-Based Hedging Strategies
Institutions use options to hedge, speculate, or generate income.
Common techniques:
Protective Puts (insurance for falling stocks)
Covered Calls (collect premium for sideways movement)
Calendar Spreads, Iron Condors, etc. (advanced strategies for theta/gamma/vega exposure)
They often create multi-leg options positions to reduce risk and take advantage of implied volatility.
6. 🏰 Dark Pools Trading
Institutions often trade through dark pools, which are private exchanges not visible to the public. These are used to place large orders without revealing size, so other traders don’t front-run their positions.
Example: An institution may buy 1 million shares through a dark pool instead of a public exchange like NSE or NYSE.
7. 📍 Sector Rotation Strategy
Institutions frequently rotate their capital between sectors based on economic cycles.
In recession: move to defensive stocks (FMCG, Pharma)
In recovery: switch to cyclicals (automobile, banking, infrastructure)
They allocate billions of dollars based on macro themes, earnings cycles, and geopolitical shifts.
8. 🔁 Rebalancing Portfolios
Large funds constantly rebalance their portfolios — buying/selling assets to maintain target allocations. This causes monthly/quarterly flows in stocks or ETFs, which can influence price significantly.
Traders often try to anticipate these flows and trade in the same direction.
📉 How Institutional Traders Enter Positions Quietly
Let’s break down a common stealth strategy:
📘 Step-by-Step Accumulation Example:
Stock ABC trades at ₹100.
Institution wants to buy 5 lakh shares.
If they buy all at once, the price may jump to ₹110+.
So they:
Break order into 5,000 share blocks
Buy at different times of day
Use different brokers/accounts to hide volume
Buy some shares in dark pool
Use algorithm to monitor market depth
After 2 weeks, they complete the buy at an average price of ₹101.
Once they have the position, they might release news or earnings upgrades to support the price.
They hold till price hits their target (say ₹130), then start distributing in small blocks again.
👁 How to Spot Institutional Activity as a Retail Trader?
While you can’t directly see them, you can learn to follow the footprints:
🔍 Clues of Smart Money Activity:
Unusual volume on low-news days
Breakout with high volume but small price move
Price holding key levels repeatedly (support/resistance)
Option open interest buildup
Low volatility periods followed by volume spike
Multiple rejections from the same price zone (indicating accumulation/distribution)
🧠 Mindset of Institutional Traders
What makes institutions successful is not just tools or money — it’s their discipline, planning, and patience. Key principles:
Capital preservation first
Risk-to-reward must be favorable
Avoid emotional decisions
Backtesting before executing strategies
Long-term consistency over short-term wins
📌 Summary – What Can We Learn?
Institutional trading is not magic — it’s structured, logical, and data-driven. As a retail trader, you can’t beat them in speed or capital, but you can:
✅ Learn how they operate
✅ Use similar risk management
✅ Follow the smart money
✅ Avoid emotional trades
✅ Focus on long-term skill building
🏁 Final Thought
The goal isn’t to copy institutional trades, but to understand their footprint and align your trades with their flow. Most successful retail traders grow by observing how smart money moves, then reacting wisely.
You don’t need ₹100 crore to trade like an institution — you need a strategic mindset, discipline, and a plan.

Options Trading Strategies📌 What Are Options in Trading?
Before we get into strategies, let’s understand what options actually are.
In the simplest form, options are contracts that give a trader the right, but not the obligation, to buy or sell an asset (like a stock, index, or commodity) at a specific price before or on a specific date.
There are two main types of options:
Call Option – Gives you the right to buy something at a set price.
Put Option – Gives you the right to sell something at a set price.
These tools can be used to hedge, speculate, or generate income. Now that you know what options are, let’s go deeper into strategies.
🎯 Why Use Options Strategies?
Options trading is not just about buying Calls and Puts randomly. It’s about smart combinations and planned risk management. With the right strategies, you can:
Profit in up, down, or sideways markets
Limit your losses
Leverage small capital
Hedge your stock or portfolio
Earn regular income
Let’s now dive into some popular options trading strategies—from basic to advanced—with examples.
✅ 1. Covered Call Strategy
💡 Use When: You own a stock and expect neutral or slightly bullish movement.
You own shares of a stock and you sell a Call Option on the same stock. You receive a premium from selling the Call, which gives you extra income even if the stock doesn’t move.
📘 Example:
You own 100 shares of Reliance at ₹2800. You sell a 2900 Call Option and receive ₹30 per share as premium.
If Reliance stays below ₹2900 – You keep your stock and the premium.
If Reliance goes above ₹2900 – Your stock gets sold (you deliver), but you still profit from stock rise + premium.
✅ Pros:
Earn extra income
Lower risk than buying naked calls
❌ Cons:
Limited upside
Need to own stock
✅ 2. Protective Put Strategy
💡 Use When: You own a stock but want to protect from downside risk.
Here, you buy a Put Option along with owning the stock. It acts like insurance – if the stock crashes, the Put will rise in value.
📘 Example:
You buy HDFC Bank shares at ₹1700 and buy a 1650 Put Option for ₹25.
If HDFC drops to ₹1600 – Your stock loses ₹100, but your Put may gain ₹50–₹75.
If HDFC goes up – You lose only the premium ₹25.
✅ Pros:
Protects your portfolio
Peace of mind in volatile markets
❌ Cons:
You pay a premium (like insurance)
Can eat into profits
✅ 3. Bull Call Spread
💡 Use When: You are moderately bullish on a stock.
You buy a Call Option at a lower strike and sell another Call Option at a higher strike (same expiry). This reduces your cost and risk.
📘 Example:
Buy Nifty 22500 Call at ₹100
Sell Nifty 23000 Call at ₹50
Your net cost = ₹50
Max profit = ₹500 (if Nifty ends above 23000)
✅ Pros:
Lower cost than naked Call
Defined risk and reward
❌ Cons:
Limited profit potential
✅ 4. Bear Put Spread
💡 Use When: You are moderately bearish.
You buy a Put at higher strike and sell another Put at lower strike. This is just like Bull Call, but for falling markets.
📘 Example:
Buy Bank Nifty 50000 Put at ₹120
Sell 49500 Put at ₹60
Net Cost = ₹60
Max Profit = ₹500
✅ Pros:
Risk-managed way to profit in downtrend
❌ Cons:
Limited profits if market crashes heavily
✅ 5. Iron Condor
💡 Use When: You expect the market to stay sideways or within a range.
It’s a neutral strategy involving four options:
Sell 1 lower Put, Buy 1 far lower Put
Sell 1 upper Call, Buy 1 far upper Call
📘 Example:
Sell 22500 Put
Buy 22200 Put
Sell 23000 Call
Buy 23300 Call
You receive a net premium. If the index stays between 22500–23000, you make full profit.
✅ Pros:
Profits in range-bound market
Low risk, fixed reward
❌ Cons:
Requires margin
Complicated setup
✅ 6. Straddle Strategy
💡 Use When: You expect a big move in either direction, but not sure which.
Buy both a Call and a Put at the same strike price and expiry. One side will definitely move.
📘 Example:
Buy Nifty 23000 Call at ₹80
Buy Nifty 23000 Put at ₹90
Total cost = ₹170
If Nifty makes a big move (up or down), one side can explode in value.
✅ Pros:
Unlimited potential if market breaks out
Great for news events
❌ Cons:
Expensive to enter
Needs big movement to profit
✅ 7. Strangle Strategy
💡 Use When: You expect a big move, but want to reduce cost compared to straddle.
Buy an Out-of-the-Money Call and Put.
📘 Example:
Buy Nifty 23200 Call at ₹40
Buy Nifty 22800 Put at ₹50
Total cost = ₹90
You still profit from big movement, but cheaper than a straddle.
✅ Pros:
Lower cost
Profits from big moves
❌ Cons:
Requires even larger movement than straddle
✅ 8. Short Straddle (for experts)
💡 Use When: You think the market will stay flat (low volatility).
Sell a Call and a Put at the same strike. You earn double premium.
⚠️ Risk: Unlimited risk if market moves too much!
This strategy is not for beginners. You need tight stop losses or hedges.
🔐 Risk Management Is Key
No matter which strategy you use:
Always define your maximum risk and reward.
Avoid taking naked positions without hedging.
Use stop losses and trailing SLs.
Don’t bet your whole capital – use position sizing.
Avoid trading right before major events unless you understand the risks.
Strangle
🤔 Real-Life Example (Simple Breakdown)
Let’s say the market is range-bound and Nifty is stuck between 22500–23000 for weeks. You can go with an Iron Condor:
Sell 22500 Put at ₹80
Buy 22200 Put at ₹40
Sell 23000 Call at ₹70
Buy 23300 Call at ₹35
Net Premium = ₹75
If Nifty expires between 22500–23000, you get full ₹75 profit per lot. If it breaks the range, losses are capped due to hedges.
💬 Final Thoughts
Options trading strategies are like different weapons in your trading arsenal. But using them without understanding or discipline is dangerous. Always know:
What is your market view?
What is your max risk?
How will you manage losses?
The smartest traders don’t gamble—they plan. They treat options like a business, not a lottery ticket.
So whether you’re trading with ₹5000 or ₹5 lakhs, always use a strategy with:
✔ Proper Risk-Reward
✔ Defined Exit Plan
✔ Strong Logic (not emotion)
Intraday Breakouts & FakeoutsIntroduction
If you’ve been trading for any length of time, you've probably heard of the term “breakout”. It sounds exciting—and it is. A breakout can be the start of a big move and massive profits. But what’s less talked about (yet very common) is the “fakeout”—a breakout that doesn’t hold and traps traders on the wrong side.
In the world of intraday trading, understanding breakouts and fakeouts is critical. Many traders lose money not because they don’t spot the breakout, but because they get caught in fakeouts. In this guide, we’re going to deeply understand what breakouts are, how fakeouts trick traders, and how you can trade both effectively.
Let’s dive in.
Part 1: What is a Breakout in Intraday Trading?
In simple words, a breakout happens when the price of a stock or asset moves outside a defined support or resistance level with increased volume.
Imagine the price is stuck between ₹100 (support) and ₹110 (resistance). It keeps bouncing in this range for hours. If suddenly, the price jumps above ₹110, that’s a breakout to the upside. If it drops below ₹100, that’s a breakdown (downward breakout).
Types of Breakouts
Price Breakout
Breaks key support/resistance levels.
Can happen on charts like 5-min, 15-min, or hourly.
Example: Nifty breaking above the day’s high at 10:30 AM with a strong green candle.
Volume Breakout
Price breaks with strong volume. Volume confirms that the breakout is real.
No volume = high risk of fakeout.
Time-Based Breakout
Usually happens during market opening (9:15-10:00 AM) or after lunch session (1:30-2:30 PM).
Institutions are active during these times.
Why Do Breakouts Happen?
A breakout indicates fresh buying or selling interest.
It reflects market consensus that price is ready to move beyond its old limits.
Often driven by news, earnings, or technical pressure (like stop-loss hunting).
Part 2: What is a Fakeout?
A fakeout (fake breakout) occurs when:
Price appears to break a level.
Traders jump in expecting a big move.
But price immediately reverses and traps them.
Fakeouts are deliberate traps—usually set by big players (institutions, smart money) to grab liquidity.
Retail traders often become the liquidity providers for institutions.
Why Do Fakeouts Happen?
Institutions want to fill large orders.
They push prices above resistance to trigger buy orders and stop-losses of short sellers.
Then they reverse the move, causing panic.
End result: Retail traders are left holding losses.
Part 3: Intraday Breakout Trading Strategies
Let’s look at some practical breakout strategies for intraday traders.
1. Opening Range Breakout (ORB)
Define the first 15–30 minutes range after market opens.
Place buy order above the high and sell order below the low.
Wait for confirmation candle and volume spike.
Common in indices like Nifty, Bank Nifty.
Tip: Always avoid trading in sideways markets using ORB. Use it when there’s strong news or momentum.
2. Flag or Pennant Breakout
Price consolidates in a tight flag or triangle after a sharp move.
Breakout of the pattern gives second entry into the trend.
Ideal for stocks showing momentum (e.g., high volume gainers).
3. Break and Retest Strategy
Wait for price to break a level.
Let it come back and retest the breakout point.
If retest holds and reverses in the breakout direction → enter.
Safer than blind breakout entries.
4. Trendline or Channel Breakout
Draw intraday trendlines on 5-min or 15-min chart.
Break of the trendline with good volume = possible entry.
Works well when the price breaks a descending or ascending channel.
Part 4: How to Avoid Fakeouts
Let’s be honest—you can’t avoid fakeouts 100%. But you can reduce them by being smart:
✅ Wait for Confirmation
Don’t enter on the first candle.
Wait for a closing candle above/below the breakout zone.
✅ Use Volume
No volume = No trade.
Use volume bars to check if breakout is real.
✅ Check Higher Time Frame
If 5-min shows breakout, check 15-min or hourly chart.
Are those timeframes supporting the move?
✅ Avoid Trading in Newsless/Sideways Markets
Breakouts in a consolidating or low-volume market are usually traps.
✅ Don’t Chase Breakouts
If price already moved too far from level, skip it.
Chasing leads to bad entries and panic exits.
Part 5: Stop Loss & Risk Management
Even the best setups fail. So risk management is king.
🔹 Where to Place Stop Loss?
Just below breakout candle (for long).
Just above breakdown candle (for short).
Or below the last swing low/high.
Example:
If a stock breaks out at ₹210 and breakout candle low is ₹205, place SL at ₹204.50.
🔹 How Much to Risk?
Risk only 1–2% of your total capital per trade.
Never add to a losing breakout trade.
Use position sizing wisely.
Part 6: Mindset – Stay Neutral, Not Emotional
Fakeouts hurt more mentally than financially.
After 2–3 fakeouts, you may start doubting every breakout.
The key is to follow a process, not feelings.
Keep notes of what works and what doesn’t. Learn from each setup.
Part 7: Bonus – Common Breakout Traps
Breakout Without Volume
Looks tempting, but lacks power.
Almost always fails.
Midday Breakout in Low Volatility
Low chance of success unless news-driven.
Breakouts Near Big Events (like Fed meetings, RBI policy)
Markets often reverse after whipsawing.
Extended Breakouts (after 4-5 green candles in a row)
Usually too late to enter.
Conclusion
Trading intraday breakouts and avoiding fakeouts is both art and science.
Yes, it’s risky. Yes, it’s fast. But with the right knowledge, experience, and discipline, you can turn it into a powerful edge.
To succeed:
Focus on volume, price action, and context.
Have patience to wait for the right setup.
And most importantly, protect your capital using risk management.
Breakouts can give you explosive gains—but only if you avoid the traps that come with them. So stay sharp, stay calm, and trade with a plan.
BTCUSD 1D TimeframeBitcoin is trading near $117,800 – $118,400
It’s in a sideways consolidation zone after a strong uptrend
📊 Technical Summary
📈 Trend Direction:
Primary Trend: Bullish (long-term)
Short-Term Trend: Sideways to slightly bullish
Structure: Higher highs and higher lows still intact
🔍 Key Support & Resistance Levels
🟢 Support Zones:
$117,000 — Immediate support zone
$115,000 — Minor demand zone
$112,000 — Key swing low support
$108,000 – $110,000 — Strong base if correction deepens
🔴 Resistance Zones:
$119,000 — Current price ceiling
$121,000 — Breakout target
$123,000 – $125,000 — All-time high resistance area
🧠 Indicators Overview
📌 RSI (Relative Strength Index):
Around 58–60
Shows moderate bullishness — not overbought
📌 MACD (Moving Average Convergence Divergence):
MACD line above signal line, but momentum is weakening
Indicates potential slowing of bullish push
📌 Moving Averages:
20-day EMA: Below price — short-term support
50-day EMA: Also below — confirms mid-term uptrend
200-day EMA: Far below — strong long-term bullish signal
🕯️ Candlestick Behavior
Recent candles are small-bodied: suggests indecision
Wicks both sides: market waiting for next trigger
No bearish reversal patterns visible yet

NIFTY 1D TimeframeClosing Price: ₹24,837.00
Daily Change: −0.90% (about 225 points down)
Day’s Range: ₹24,806 – ₹25,010
Volume: Moderate to slightly higher than average
Market Sentiment: Cautiously Bearish
🔍 1D Price Action Summary
The 1-day chart of Nifty shows weakness near a key resistance zone. The index has been trading in a downward-sloping range over the past few sessions. The day began with mild strength but selling pressure pushed the index down by the close.
Bearish candlestick formation with a relatively long upper wick, indicating rejection near intraday highs.
4th consecutive day of weakness, hinting at profit booking and lower highs on the chart.
The price closed near the day’s low, suggesting bearish momentum could carry into the next session.
📐 Technical Levels
✅ Support Zones
Primary Support: ₹24,800 – This level has been tested multiple times recently. A close below it could trigger further downside.
Secondary Support: ₹24,550 – Considered a swing low from earlier this month.
Major Support: ₹24,250 – The breakout level from the previous consolidation.
❌ Resistance Zones
Immediate Resistance: ₹25,050 – This was the intraday high and rejected.
Stronger Resistance: ₹25,250 – Previously a strong support zone, now turned resistance.
Major Resistance: ₹25,500 – All-time high zone; bulls will need strength to retest this.
📊 Trend Analysis
Current Trend: Short-Term Bearish
Medium-Term Trend: Neutral to Slightly Bullish
200-DMA (Daily Moving Average): Nifty is trading above the 200-DMA, keeping the long-term trend intact.
50-DMA: Price is nearing the 50-day moving average. A break below could accelerate selling pressure.
📈 Chart Patterns Observed
Head and Shoulders Pattern (Forming): The right shoulder is under formation; neckline lies near ₹24,800. Breakdown could trigger a short-term fall of 200–300 points.
Bearish Engulfing Candlestick (on the daily): Indicates aggressive seller dominance.
Lower Highs and Lower Lows: A sign of short-term downtrend.
🧠 Institutional & Retail Activity
FIIs (Foreign Institutional Investors): Net sellers over the past few sessions. Sentiment cautious due to global macro uncertainty.
DIIs (Domestic Institutions): Providing some support on dips, but not aggressively buying.
Retail Traders: More active in options and short-term plays; volatility increasing.
💡 Trading Strategy Ideas (Short-Term)
🔻 For Bears (Short-Side Traders)
Consider short positions below ₹24,800 with targets around ₹24,550–24,400.
Use strict stop-loss above ₹25,050 to manage risk.
Bearish bias valid until the price closes above ₹25,250.
🔼 For Bulls (Dip Buyers)
Watch for price action around ₹24,800–24,550 for signs of reversal.
Ideal scenario: bullish engulfing candle or bullish divergence on RSI.
Avoid aggressive buying unless the index reclaims ₹25,250.
🕯️ Candle Psychology Summary
The market opened near flat, tried to move higher, but was met with consistent selling.
This created a long upper wick – a sign that bulls lost control quickly.
The close near the low signals sellers had the upper hand all day.
🚨 Key Takeaways
Nifty is under pressure with key support at ₹24,800 in focus.
A breakdown below this level could drag the index to ₹24,550 or even lower.
Bulls must reclaim ₹25,250 to shift momentum in their favor.
RSI and MACD show weakness, but Stochastic hints a possible oversold bounce soon.
Volatility remains high; risk management is critical.
Institutional Intraday option Trading🏛️ Institutional Intraday Option Trading
Trade like the big players — with speed, strategy, and smart money precision.
This is high-level intraday options trading the way institutions do it — not with guesswork, but with structure, volume, and calculated risk.
🔥 What You’ll Learn:
Smart Money Concepts – Recognize institutional footprints & price manipulation
Intraday Market Structure – Breakouts, fakeouts, traps & liquidity zones
High-Volume Option Levels – Trade where institutions act
Scalp-to-Swing Entries – Fast setups with defined risk
Tight Risk Management – Stop loss placement like a pro
Time & Premium Decay Tactics – Trade with Theta on your side
💼 Perfect For:
✅ Intraday Option Traders
✅ Scalpers & Index Traders (Nifty/BankNifty )
✅ Anyone ready to follow the real momentum
📌 Fast markets need smart strategies.
Learn to dominate intraday moves with institutional logic.
