Part 1 Intraday Master ClassIntroduction to Option Trading
Option trading is one of the most dynamic, flexible, and powerful financial instruments in the modern market. It allows investors not only to profit from price movements but also to protect their portfolios, speculate, or earn regular income. Unlike buying stocks directly, options give traders the right but not the obligation to buy or sell an underlying asset (like a stock, index, or commodity) at a predetermined price within a certain time frame.
Intrday

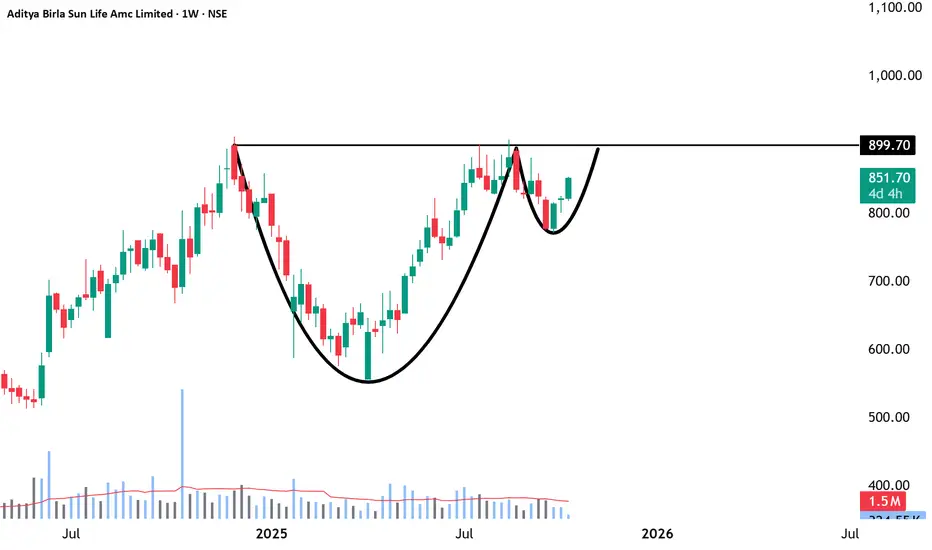
Aditya Birla Sun Life AMC-Built to Compound, Poised to BreakoutNSE:ABSLAMC
🔹 Fundamental Overview
Business Strength—One of India’s leading asset management companies, part of the Aditya Birla Group; operates across mutual funds, PMS, and AIF segments.
Financial Health – Debt-free balance sheet with excellent profitability and high cash reserves.
Profitability Metrics – ROE around 28%, ROA near 25%, and net margins above 50%, indicating strong operational efficiency.
Growth Trend – Revenue and net profit are both growing at ~20–25% YoY, supported by rising AUM and stable fee income.
Valuation—Trades near 24× P/E and 6–7× P/B; premium valuation justified by brand strength and consistency, but limits margin of safety.
Dividend Policy – Moderate yield (~1.5–1.7%) with regular payouts; good for long-term income seekers.
Key Positives—Strong parentage, scalable business, high ROE, and steady market share gains.
Key Risks—Market-linked revenues, fee compression risk, and competition from passive products and fintechs.
🔹 Technical Overview
Trend Bias—The long-term trend remains bullish, with the price comfortably above the 50-DMA (₹838) and 200-DMA (₹748).
Momentum – RSI around 55–60, neutral to mildly positive; no overbought signs.
Trend Strength – ADX below 20 shows consolidation; potential for trend expansion if volume picks up.
Crucial Support Zone – ₹ 815 – ₹ 830; strong base for accumulation.
Resistance Zone – ₹ 854 – ₹ 860; a breakout above this range may trigger a sustained rally.
Long-Term Projection – 2,500+++ possible over 3–5 years in favorable market conditions.
Risk Control – Maintain stop-loss below ₹ 810 for long positions; trail profits once above ₹ 900.
🔹 Investor Takeaway
Outlook—Fundamentally robust, financially sound, and technically poised for breakout after consolidation.
Strategy—Ideal for gradual accumulation on dips and adding on confirmed breakouts above ₹ 860.
Time Horizon – Best suited for 1–5 year investors seeking stable compounding from a high-quality financial business.
========================
========================
⚠️ Disclaimer:
This analysis is for educational and informational purposes only.
We are not SEBI-registered analysts or advisors.
This is our personal view based on available data and market trends.
Please consult your SEBI-registered investment advisor before making any investment or trading decisions.
You are solely responsible for any financial decisions you make based on this content.
========================
Trade Secrets By Pratik
========================
SWIGGY : Next Multi-bagger ??NSE:SWIGGY
🚀 SWIGGY LTD – Combined Technical + Fundamental Analysis
As of: 24 July 2025 | CMP: ₹420.50 |
📈 TECHNICAL ANALYSIS
🔷 Pattern: Cup and Handle Breakout
Cup & Handle pattern completed over 5 months (Feb–July 2025)
Breakout Level: ₹409 (marked horizontal resistance)
CMP: ₹420.50 — breakout confirmed with strong volume
Cup Depth: ₹409 – ₹285 = ₹124
🔍 Indicators & Price Action:
Price vs 50 EMA ✅ Above (bullish short-term trend)
Price vs 200 EMA ✅ Above (bullish long-term trend)
Volume ✅ Breakout confirmed with surge
RSI ~63 (strong but not overbought)
🔧 Key Levels:
Support Resistance Swing Target
₹409 (Breakout retest) ₹445 / ₹480 ₹533 (measured move)
Technical Verdict:
Bullish breakout from a long base. With volume confirmation and improving fundamentals, Swiggy is poised for a multi-week rally.
=======================================
📊 FUNDAMENTAL ANALYSIS
📈 1. Revenue Growth
Swiggy has shown consistent and impressive topline expansion over the past 3 years:
Financial Year Revenue (₹ Cr) YoY Growth
FY22 ₹5,705 –
FY23 ₹8,265 +45%
FY24 ₹11,115 +34%
FY25 (Est.) ₹14,500 +30% est.
Growth Drivers:
🚀 Instamart (Grocery) – fastest-growing vertical
🍽️ Food Delivery – steady in Tier I, expanding in Tier II/III
📍 Strong presence in metros, improving reach in smaller cities
💰 2. Profit Trajectory
Swiggy was known for heavy cash burn pre-IPO, but is now nearing profitability:
Financial Year Net Profit/Loss (₹ Cr) EBITDA (₹ Cr)
FY23 -₹4,179 -₹3,363
FY24 -₹1,482 -₹1,115
FY25 (Est.) +₹75 (Profit) +₹350
📉 Losses reduced by over 60% in 12 months
🔁 EBITDA-positive since Q4 FY25 — a major turning point
🛠️ Cost control, reduced discounting, and Instamart’s scale driving margin growth
🌱 3. Future Growth Prospects
Swiggy is now strategically positioned to capture multiple long-term themes:
Segment Outlook Comments
Instamart 🌟 High Growth 60%+ YoY growth, core revenue driver by FY26
Food Delivery 🔁 Steady to Moderate Strong in metros; Tier II/III scaling slowly
Dineout + Genie 🧊 Low Growth Not major contributors, but strengthen ecosystem
New Revenue 🧠 Ads, cloud kitchens High-margin potential in FY26/FY27
🧾 IPO proceeds deployed into logistics & tech infra (no major debt)
📈 Possible MSCI/Nifty Next 50 inclusion in FY26
🔓 Optionality: Entry into fintech/payments, loyalty programs, and dark kitchens
🔚 COMBINED VIEW – TECHNICAL + FUNDAMENTAL
Technical Pattern ✅ Cup & Handle breakout at ₹409
Revenue Trend ✅ Strong CAGR ~36%
Profit Outlook ✅ Profitability by FY25 end
Future Potential ✅ High – Instamart + Ads + Tier-II expansion
Risk ⚠️ Valuation premium + ONDC threat remains
⚠️ Disclaimer:
This analysis is for educational and informational purposes only.
We are not SEBI-registered analysts or advisors.
This is our personal view based on available data and market trends.
Please consult your SEBI-registered investment advisor before making any investment or trading decisions.
You are solely responsible for any financial decisions you make based on this content.
========================
Trade Secrets By Pratik
========================
Axis Bank Looking good on weekly chartNSE:AXISBANK
Expecting to form nice pattern of HnS in weekly chart.
Good to keep on the radar
Always respect SL & position sizing
========================
Trade Secrets By Pratik
========================
Disclaimer
NOT SEBI REGISTERED
This is our personal view and this analysis
is only for educational purposes
Please consult your advisor before
investing or trading
You are solely responsible for any decisions
you take on basis of our research.

Analysis of Moving average stock (15/Nov/2024)Analysis of Moving average stock (15/Nov/2024)
follow for more updates and information

Banknifty level for option trading 15/Nov/2024Arrowindex 15/Nov/2024
Banknifty level for option trading
follow for more updates and information.

GNFC good to studyNSE:GNFC
Nice formation of CUP & Handle
On the verge of BO
Good to keep on the radar
Always respect SL & position sizing
========================
Trade Secrets By Pratik
========================
Disclaimer
SEBI UNREGISTERED
This is our personal view and this analysis
is only for educational purposes
Please consult your advisor before
investing or trading
You are solely responsible for any decisions
you take on basis of our research.

[INTRADAY] #BANKNIFTY PE & CE Levels(26/09/2023) Today will be gap down opening in BANKNIFTY . After opening if banknifty start trading below 44950 level then possible downside rally of 400-500 points upto 44550 Level. And this rally can extend for another 400 points if it gives breakdown of 44450 level. Any Major upside only expected in case banknifty starts trading above 45050 level. also possible Reversal upside 44550 level.

BANK NIFTY INTRADAY LEVELS FOR 18/09/2023" HAPPY GANESH CHATHURTHI "
" MAY THIS GANESH CHATHURTHI REMOVE ALL YOUR HURDLES BRING YOU PROFITS "
BUY - 46300
SL - 46200
TARGETS - 46430,46550,46630
SELL - 46150
SL - 46250
TARGETS - 46030,45820,45630
NO TRADE ZONE - 46150 to 46300
Previous Day High - 46300
Previous Day Low - 46030
I am sharing BANK NIFTY levels this levels acts as important support & resistance for intraday. if you want to trade with this levels wait for 15 min Candle closing above that levels. You can trade with breakout and reversal both.
In this channel, I share my expertise in trading strategies, technical analysis, and market trends to help you make informed decisions in your trading ventures.
Stay tuned for daily updates, in-depth market analyses, and real-time trading scenarios to witness firsthand how we transform from Zero to Hero in the trading world. My Only aim is to empower you with the knowledge and skills necessary to navigate the complexities of the financial markets successfully.
Based on price action major support & resistance's are here, the red lines acts as resistances, the green lines acts as supports. If the price breaks the support/resistance, it will move to the next support/resistance line. White lines indicates previous day high & low, high acts as a resistance & low acts as a support for next day.
Trendlines are also significant to price action. If the price is above/below the trendlines, can expect an UP/DOWN with aggressive move.
Please NOTE: this levels are for intraday trading only.
Disclaimer - All information on this page is for educational purposes only,
we are not SEBI Registered, Please consult a SEBI registered financial advisor for your financial matters before investing And taking any decision. We are not responsible for any profit/loss you made.
Request your support and engagement by liking and commenting & follow to provide encouragement
HAPPY TRADING 👍

Reversal Double Top pattern in TITANTITAN COMPANY LTD
Key highlights: 💡⚡
📈On 1Day Time Frame Stock Showing Reversal of Double Top Pattern.
📈 It can give movement upto the Reversal Final target of Below 2880-.
📈 There have chances of breakdown of Resistance level too.
📈 After breakdown of Resistance level this stock can gives strong downside rally upto below 2550-.
📈 Can Go short in this stock by placing a stop loss Above 3355+.

[INTRADAY] #BANKNIFTY PE & CE Levels(11/08/2023) Today will be FLAT opening in BANKNIFTY . After opening if banknifty start trading above 44550 level then possible upside rally of 400-500 points upto 44950 Level.Any Major downside only expected in case banknifty starts trading below 44450 level.


FINNIFTY KING SETUP FOR TUESDAY EXPIRYFinnifty stucked in a tight range and almost rejected from ATH my view in buying side is not at all i want to sell on rise and thats what i am doing people may buy but in my opinion it is tukka and i am not interested in that
tomorrow plan is same sell after opening and add more qty below previous low i.e today low
contact your advisor before

NIFTY CONFUSION SETUP Nifty closed at 18500 sustaining above 18500 can lead to 18700 and ATM too but as per RSI a king setup market looks poised and strength in buying is week now chances of fakeout are more i will keep eye on 18420 level below this a nice slip can be planned by a good trader new traders stay away

STOCK MARKET ME ANE KI Psychology.. KYO ANA ? BY VARSHIL BUTANI Psychology is the scientific study of the mind and behavior.
EMOTION VS SET-UP
LOSS VS EMOTION
PROFIT VS EMOTION
APKO KYA CHAHIYE ?

intradayboth side potential
avoid first 15min breakout
wait for 15 min candle closing
targets are marked
follow risk management
do your own analysis
do workout
do meditation
start reading book

Intraday/ swing opportunity in jubilant foodworks Stock has given breakdown of 487-485 support zone and retesting it. After retesting it may further go down to the level of 470.
On the contrary if it gives a break out the same resistance level of 487-485, it may reach upto 500.
Keep tracking .

intradaykind of ascending triangle pattern . price take support from trendline
gap is pending in above side so it can fill the gap.
buy above 781 and target is 791 .
put your stop loss in logical place and follow your risk management .
as a day trader we have to prepared for both side so zone are marked for downside also
keep learning from your mistake.
do not overtrade guyss

CIPLA update! with positionHello everyone , i m sharing an update with you on NSE:CIPLA
1st target is on chart along with stoploss ,2nd target will be displayed after reaching 1st one.
do follow and comment if u want analysis video with stop loss and targets

BRITANNIA : INTRADAY TRADE NSE:BRITANNIA
Britannia looking good above 3882
@Forming a flag pattern after a pole spike up movement, with horizontal resistance.
@ Good momentum is expected on breakout.
@ Try to capture at least 1% move as this setup is on 15 min time frame.
Always trade with stoploss
Keep learning ,Happy trading.


NATIONALUM - Intraday - Range BoundedNATIONALUM - 15 mins - Intraday
Range Bound Market as knows as Sideways Market.
Price oscillates in a range attempts to hit upper and lower level multiple times.
For Intraday - Range provide multiple opportunity to trade both ways Long position from Bottom and Short position from Top till range breaks.

Critical levels for Nifty !!!!Though nifty had given breakout above the falling trendline but it,
seems that still its facing resistance around 200DMA i.e. 16980 also my
premonition says that nifty could take support around 20DMA i.e. 16720
yesterday while we were witnessing a intraday fall nifty took support and not closed below 5DMA
showing strength.
MACD has also turned positive again a bullish signal.
Long nifty above 16850 for target of 16950 and wait nifty to cross 200DMA after which 17000 will be
not so far.
#Enjoy_Trading
