Yes Bank : Ready to reward you ~30% in a YearHi Friends,
Yes Bank looks promising now & ready for ~29% (Target ~30) upward journey.
I am anticipating the stock to start its upward journey.
Pattern : Beautiful inverse Head and shoulder is getting formed .
Entry point : Entry point is above YELLOW line.
Stoploss : Stoploss will be 10% below the YELLOW line
Timeline : ~01 Year
Targets, Stoploss & Entry are mentioned in the chart .
Please feel free to share your views regarding this chart & analysis .
Note : I am not a SEBI registered advisor . Please consider my analysis only for Education purpose .
Inverse Head and Shoulders

Kalyan Jewellers – Elliott Wave analysis for breakout.Kalyan Jewellers – Elliott Wave Validation (Daily Chart, IST)
Big Picture Structure
• Primary trend: Bullish
• Current degree: Wave (5) in progress
• Wave (4): Completed near ₹440–445
• Market is now transitioning from early Wave (5) into impulsive expansion
________________________________________
Role of the Inverted Head & Shoulders (IH&S)
• IH&S has formed after Wave (4) → classic trend-resumption pattern
• This pattern is acting as:
o A reversal from correction
o A launchpad for Wave (5)
Key Pattern Levels
• Head: ~₹440–445 (Wave 4 low)
• Left Shoulder: ~₹495–505
• Right Shoulder: ~₹485–495
• Neckline: ~₹520–525
________________________________________
Breakout Condition (Critical Point)
If today’s candle closes 515 , it confirms breakout
More precisely:
• Daily close above ₹515 with volume
= Confirmed IH&S breakout
= Start of impulse inside Wave (5)
Projected Targets – Elliott-Compliant
Targets are valid Fibonacci expansions from Wave (4) low.
Reference Points
• Wave (4) low: ~₹445
• Breakout zone: ~₹525
🎯 Targets Explained
Target Basis
₹610 0.618 extension of Wave (5)
₹699 Equality with prior Wave (1) / mid expansion
₹799 1.618 extension → typical Wave (5) extreme
✔ All three targets are Elliott-legal and realistic
✔ ₹799 also aligns with previous Wave (3) high, which is common in Wave (5)

Bank of Maharashtra trade for 18-20% upside.**Bank of Maharashtra (Weekly Chart – NSE)**
The stock has **completed its Wave-4 corrective phase** and subsequently formed a **clear Inverse Head & Shoulders (iH&S) pattern**, signalling the start of a **fresh impulsive move (Wave-5)**.
**Technical Observations**
* Wave-4 correction has ended near ₹45–46, respecting Elliott Wave rules
* iH&S neckline breakout confirms trend reversal
* Momentum indicators (RSI & MACD) support bullish continuation
* Price is holding above the breakout zone with healthy structure
**Strategy**
* **Accumulation Zone:** ₹60 – ₹65
* **Upside Target:** ₹75 – ₹80
* **Potential Upside:** ~18–20% from current levels
As long as the price sustains above the accumulation range, the structure remains constructive for further upside in the ongoing **Wave-5**.
This setup favours **accumulate-on-dips** rather than chasing extended candles.
---

Reclaiming The Breakdown: Descending Triangle To Inverse HnSThis weekly chart of Rico Auto illustrates how structure can evolve over time and why rigid bias around a single pattern can be misleading. Price initially respected a clear descending trendline, forming a classic descending triangle and eventually breaking down below the support zone. Instead of continuing in a straight-line downtrend, the market absorbed that move and began to build a broader basing structure.
Over the following swings, price developed an inverted head and shoulders formation, highlighted here with the white structure, right inside and just below the prior breakdown area. As the pattern matured, price not only reclaimed the prior horizontal zone but also pushed back toward the original red counter-trendline that once acted as dynamic resistance. The same trendline that confirmed the initial triangle breakdown is now being revisited, showing how former breakdown structures can later turn into key decision zones rather than one-way signals.
This chart is shared purely to study how multiple patterns can co-exist and morph on higher timeframes:
-A descending triangle that initially breaks to the downside
-A subsequent inverse head and shoulders basing pattern
-A later reclaim of the old breakdown area and retest of the descending trendline
Disclaimer
This post is for educational and illustrative purposes only and is not investment, trading, or financial advice. Please do your own research and consult a registered financial professional before making any trading or investment decisions.
Inverse head and shoulder formed in reddington1. Inverse head and shoulder formation on Support levels showing buyers will take control from here
2. With minimum downside one can watch for long upside movement shown as target zone on charts
3. The strong movement has shown after result which tells us if movement continues then target may come soon
4. SL is strict as if move fails then not giving chance to get trapped

#Silver | Falling Wedge + Inverse H&S = Bullish Cocktail#XAGUSD | 4H Chart
Head & Shoulders completed its breakdown target ✅
Price found support at the demand zone, formed a falling wedge breakout, and built an Inverse H&S.
Now consolidating right below the neckline, watching Immediate Resistance @48.464 👀
Above this, potential retest of key resistance zone 49.459 – 50.475/50.897 (previous H&S breakdown area).
Bias: Bullish above 48.464; confirmation on 4H close 🔥
#Silver #XAGUSD #HeadnShoulders #FallingWedge #InverseHeadnShoulders #PriceAction
📌 Disclaimer: This analysis is shared for educational purposes only. It is not a buy/sell recommendation. Please do your own research before making any trading decisions.

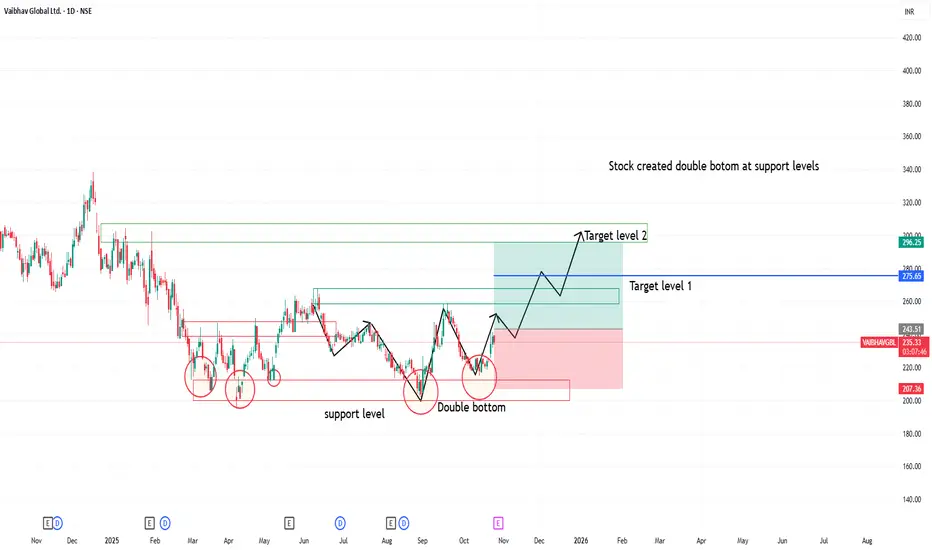
Vaibhav global created double bottom on support levelsStock created double bottom at support levels
good fundamental stock
good for long swing movement
BAJAJ HINDUSTANHello & welcome to this analysis
The daily time frame has formed an Inverse Head & Shoulder pattern suggesting upside levels of 24.50 & 26.50 as long as it does not breach 20.95
A healthy Risk : Reward ratio set up for short term trading in this small cap sugar sector stock
All the best

IRB trendline breakout on support level1. trendline breakout on support level
2. Inverse head and shoulder pattern on support level
3. good for swing upside movement

#MuhuratPick | #Kalamandir: Inverse Head & Shoulders in Play✨ #MuhuratPick 🪔
Celebrate this Diwali with a stock that could bring you festive returns!
CMP: 175
🔽 Supports: 163 - 164 / 152
🔼 Resistances: 193 - 202 / 241
❌ Invalidation Level: 149.50 (Weekly Close Below)
✴️ Breakout Point: Weekly close above the neckline (Pink dotted line)
🎯 Pattern Target: 290+ (+66% from CMP)
📈 All-Time High: 312
🚀 Can Go Big in the Long-Term
#InverseHeadAndShoulders | #ChartPatterns | #DiwaliPick | #Investing | #MuhuratTrading | #LongTerm | #PriceAction
📌 Disclaimer: This analysis is shared for educational purposes only. It is not a buy/sell recommendation. Please do your own research before making any trading decisions.

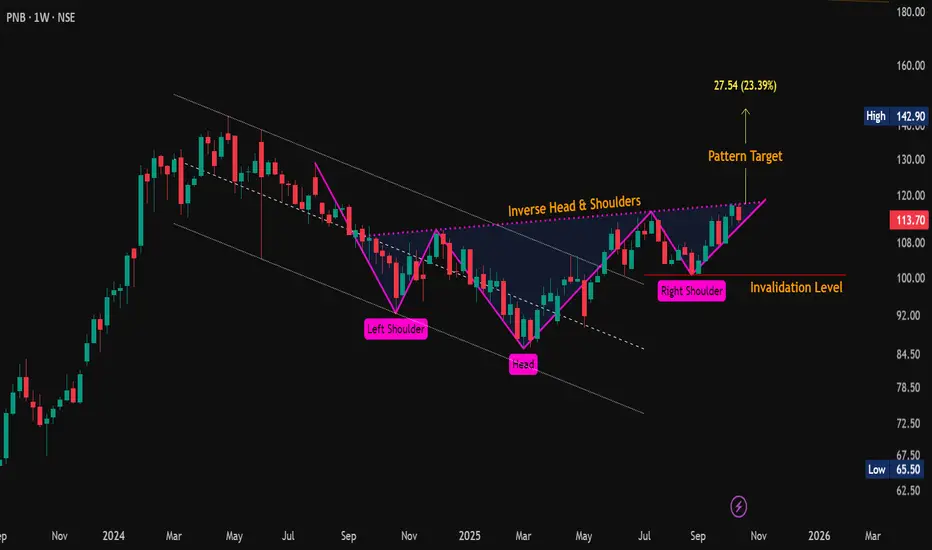
#PNB | Inverse Head & Shoulders Bullish SetupCMP: 113.70
🔼 Key Resistance Levels: 118 / 120 / 143
🔽 Key Support Levels: 113.30 - 110.50 / 107.30
❌ Invalidation Level: 100.60 (Weekly Close Below)
✴️ Breakout Point: Weekly close above the neckline (Pink dotted line) 👀
🎯 Pattern Target: 145 (+27% from CMP)
#PNB | #InverseHeadAndShoulders | #ChartPatterns | #PriceAction | #SwingTrading
📌 Disclaimer: This analysis is shared for educational purposes only. It is not a buy/sell recommendation. Please do your own research before making any trading decisions.
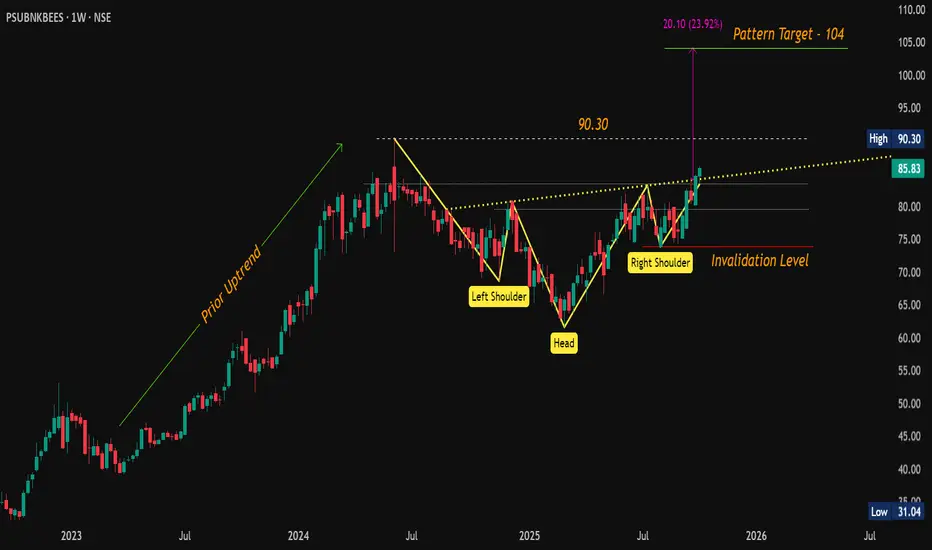
Missed the PSU Bank Rally? #PSUBNKBEES Still Has 24% Upside!CMP: 85.83
PSUBNKBEES has confirmed a classic Inverse Head & Shoulders breakout on the weekly chart , with two consecutive weekly closes above the neckline , a strong technical validation of the pattern.
🔹 Key Levels:
📌 Breakout Level: 84
🔽 Support Zone: 83.45 – 79.50
🔼 Overhead Resistance: 90.30
🎯 Pattern Target: 104 ( ~24% upside from breakout)
This ETF gives broad exposure to PSU banks , making it a lower-risk, sector-wide play for positional investors.
💡 If you are unsure which PSU Bank stock to choose, PSU Bank Bees offers a diversified, stress-free way to capture 20 -30% upside . Ride the trend, avoid the noise.
#ETF | #CNXPSUBANK | #PSUBanks | #InverseHeadAndShoulders | #ChartPatterns
📌 Disclaimer: This analysis is shared for educational purposes only. It is not a buy/sell recommendation. Please do your own research before making any trading decisions.
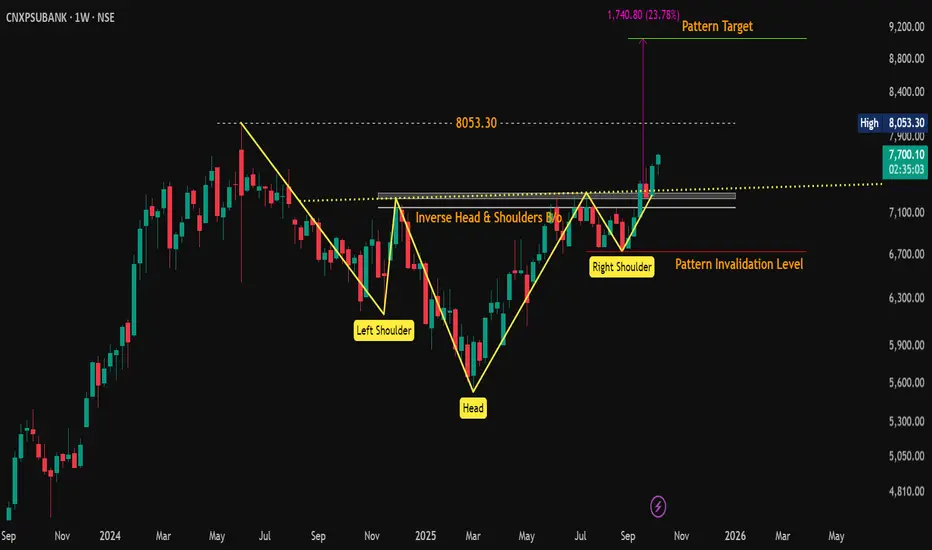
#CNXPSUBANK | Breakout Alert – Inverse Head & Shoulders in Play!CMP: 7,698
PSU BANK index has confirmed a classic Inverse Head & Shoulders breakout on the weekly chart, signaling a strong bullish reversal !
🔹 Neckline Breakout: Weekly close confirmed above 7,324
🔹 Overhead Resistance: 8,053
🔹 Support Zones:
▫️ 7,305 – 7,248
▫️ 7,163 – 7,025
🔹 Pattern Target: 9,000+ (1,740 pts move → +23% upside )
🔹 Invalidation Level: Below 6,730 WCB (Weekly Closing Basis)
✅ Pattern indicates a powerful trend shift — bulls are stepping up aggressively! A clean breakout, ride the trend higher.
#CNXPSUBANK | #TechnicalAnalysis | #InverseHeadAndShoulders | #ChartPatterns
YES BANK BY KRS Charts2nd Sept 2025 / 10:01 AM
Why Yes Bank ?
1. last few years YES BANK is making HH & HLs in Monthly & Weekly TFs . It has potential technically, but will check our patience.
2. Above Chart it fills up all the FVGs - Fair Value Gaps and bounced back in Month of April. As we can see in Chart mentioned recently also same FVG reversal is visible.
3. Also Potential of Reversal chart pattern at bottom of trend is also visible.🤞
4. Less than 2 Rs Risk and Almost 5 Rs Reward is making this trade Safe 👍
5. Point to be noted 20.25 Rs is nearest Resistance and Pattern Target of 28 Rs unlock After breakout of neckline at 22 Rs.

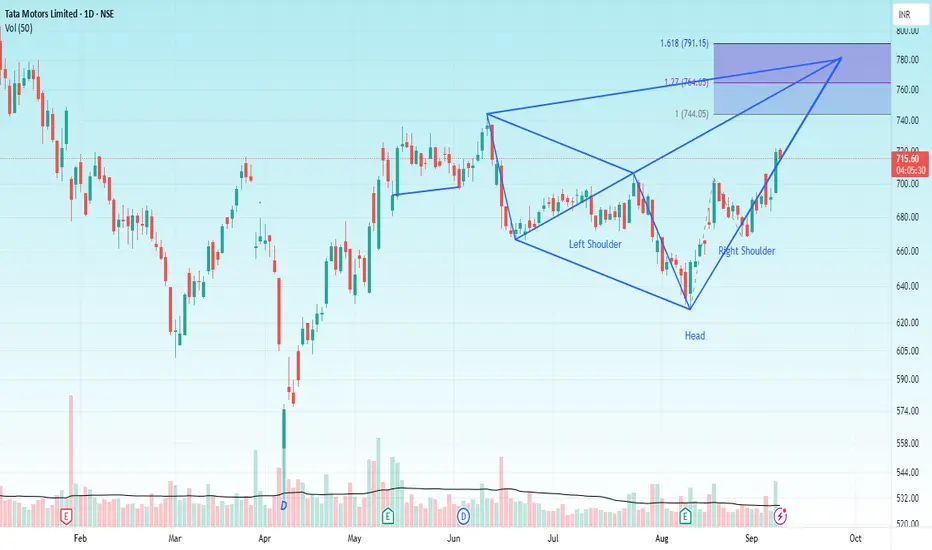
TATA MOTORS Hello & welcome to this analysis
The stock in daily time frame has given a double breakout
Inverse Head & Shoulder
Bullish Harmonic Seahorse
The upside levels as per IHS are 740 & 790 while the Seahorse pattern is indicating 775.
Both patterns have strong support at 690-700 and both would be considered invalid below 665
All the best
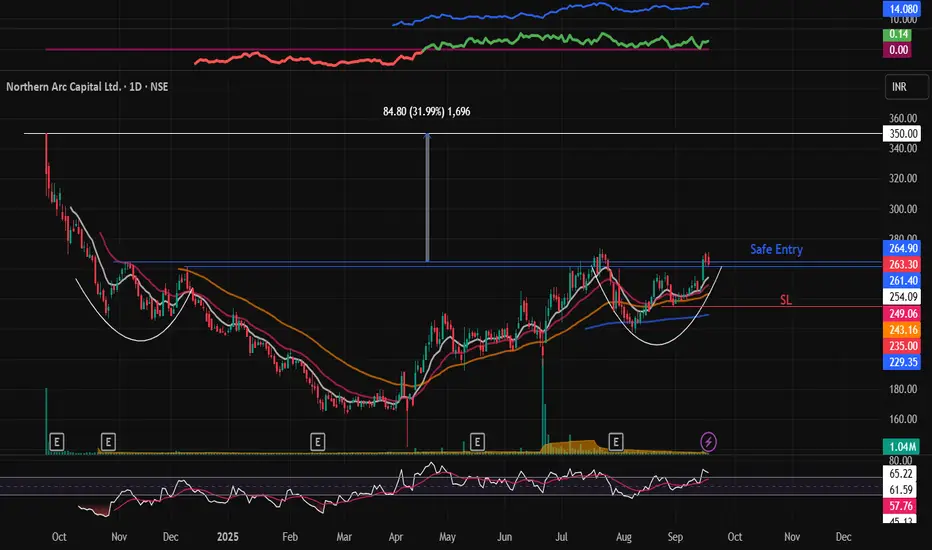
NORTHARC : Swing pick#NORTHARC #patterntrading #chartpattern #inverseheadandshoulder #breakoutstock #swingtrade #trendingstock
NORTHARC :
>> Low PE Stock
>> Chart pattern Trading
>> Inverse Head & Shoulder pattern
>> Volumes Building up
>> Stock showing strength
Swing Traders can lock profit at 10% and keep Trailing
Please Boost, comment and follow us for more Learnings.
Disc : Charts shared are for learning purpose only, not a Trade recommendation. Do your own research and consult your financial advisor before taking any position.
CHENNAI PETRO-BLEND OF TECHNOFUNDABuy CHENNAI PETRO 680 TILL 610 FOR target of 740 and 850. Classic blend of fundamental a technical analysis. Bullish flag and inverse head & shoulder breakout happening at 630 levels.
Also available near P to B/V with dividend yield above 8%.
view invalid below 580.
CITY UNION BANK- BREAKOUT HAPPENINGCUB 196, breakout happening with inverse h&s pattern. Stock having resistance at multi year range of 202-205. Above that stock is ready for 240 levels.
short to medium term trend is bullish now.
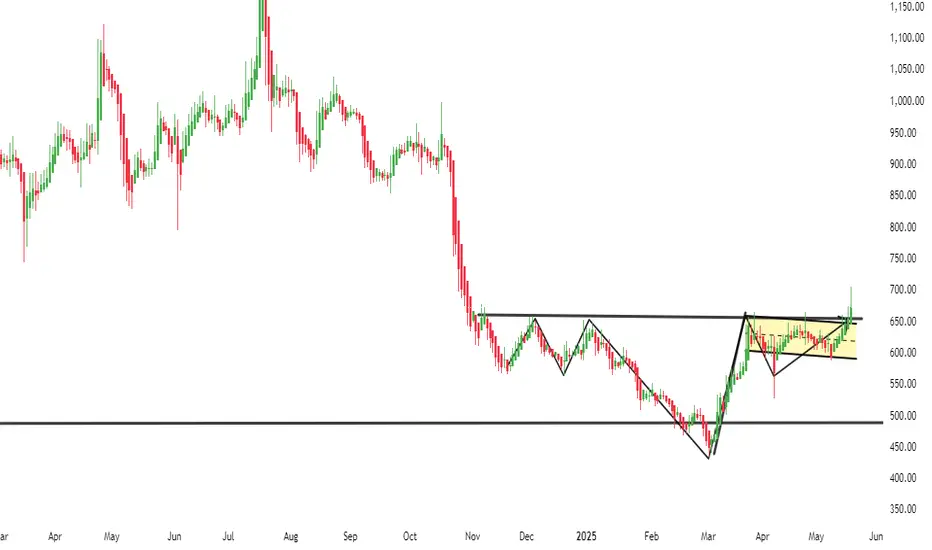
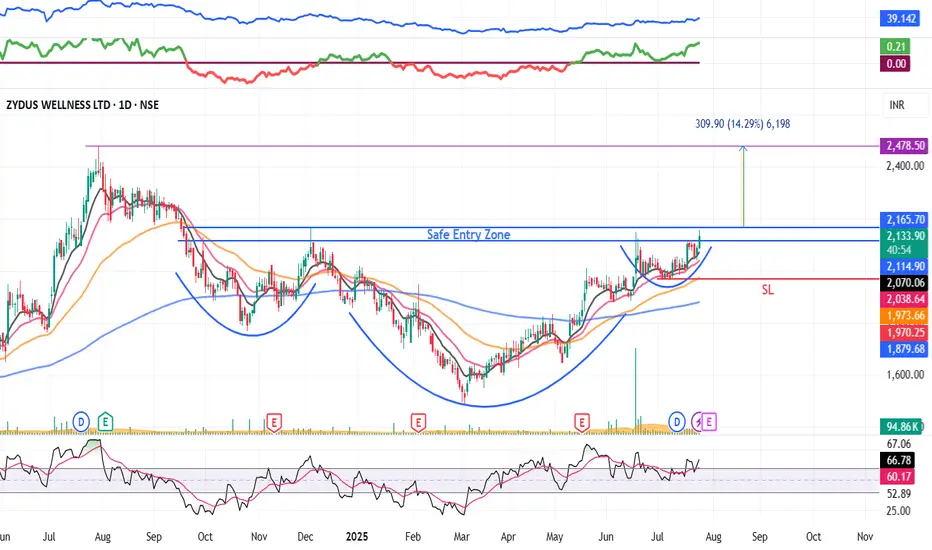
ZYDUSWELL : Inverse Head & Shoulder chart pattern#ZYDUSWELL #patterntrading #chartpattern #breakouttrading #inverseheadandshoulder #trendingstock
ZYDUSWELL : Swing Trade
>> Breakout candidate
>> Inverse Head & shoulder pattern
>> Trending stock
>> Good Strength & Volume
Swing Traders can lock profit at 10% and keep trailing
Pls comment, Boost & follow for more such Analysis
Disc : Charts shared are for Learning purpose and not a Trade recommendation. Consult a SEBI Registered advisor before taking position in it
JINDALSTEL : pattern breakout#JINDALSTEL #patterntrading #chartpatternbreakout #swingtrading
JINDALSTEL : Swing Trading
>> Breakout soon
>> Inverse Head & Shoulder pattern
>> Good Strength & Volumes Buildup
>> Trending setup
Swing Traders can lock profits at 10% and keep Trailing
Pls boost, Comment & Follow for more Analysis
Disc : Charts shared are for Learning purpose and not a Trade recommendation. Pls consult your Financial Advisor or a SEBI Registered Advisor before taking position in it

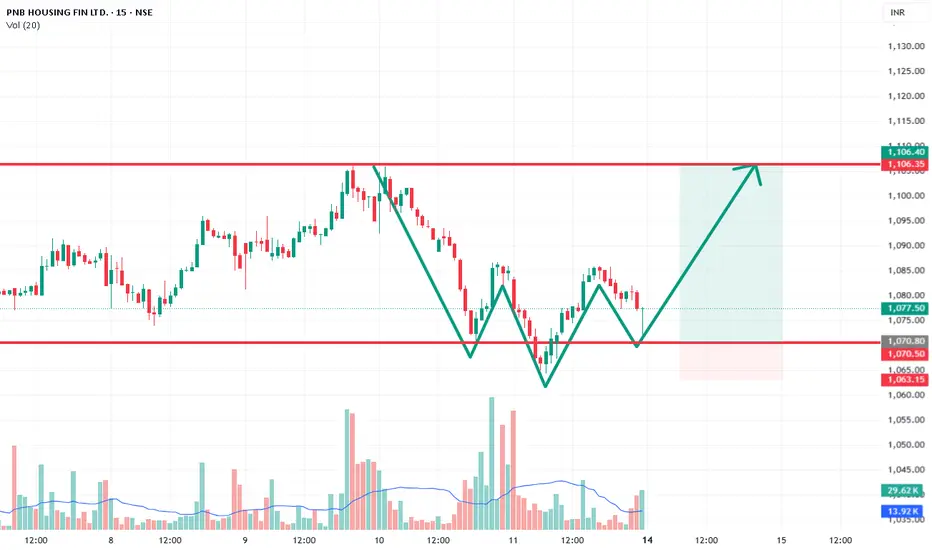
Intraday : PNBHOUSING for 3.3% UpsidePNBHOUSING
Inverse head & shoulder pattern should be perform in this counter with 15 min time frame.
Take entry near 1070
Target 1106
Strong SL : 1063
Target will be 3.3% and SL will be only 0.7% so it will be best deal.
dont forget to watch on Monday morning.
APOLLOHOSP Soon to ATH??!!!Yessss!!!!!
Chart patterns looks prudent for the above titled opinion
Rounding bottom....with a Inverted H&S pattern awaiting a Breakout!!!!!!
Expecting a Breakout by this week or next.
We can make our entry after the breakout solid candle....
Just add it to your watchlist and keep an eye on it!!!!
will update once the breakout happens!!!!!
just my opinion....not an advice nor tip....
Thank you!!!!!!

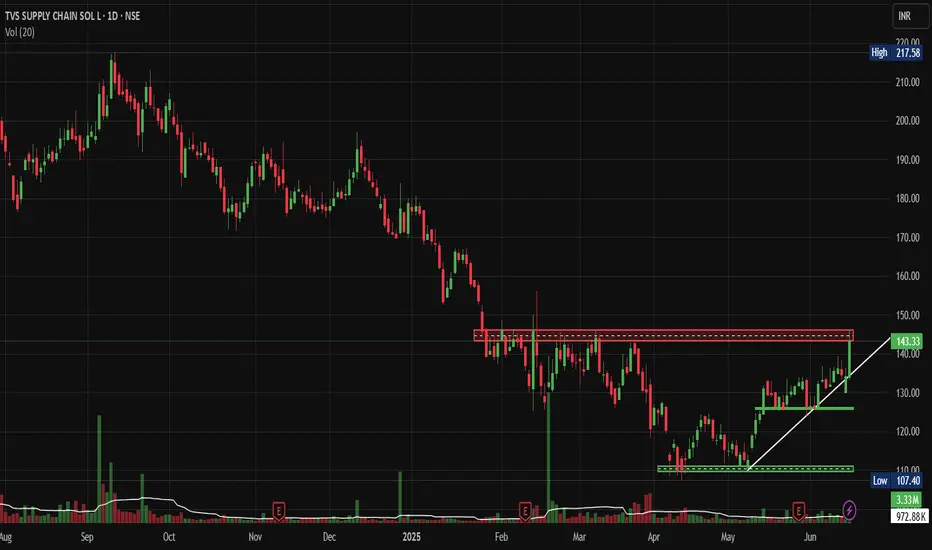
TVS Supply Chain: BO attempt after 6 Month Consolidation.This Supply Chain Giant is attempting to break out. After 6 Months of Consolidation - Is it Time to Load Up? Let's analyse today's Idea.
Price Action Analysis:
Current Market Structure:
• Stock is currently trading at ₹143.33, showing a strong +6.83% gain
• Price has broken above a key resistance zone around the ₹140 level
• Clear uptrend formation with a higher highs and higher lows pattern emerging
• Recent breakout attempt from a prolonged consolidation phase
Historical Price Movement:
• Stock witnessed a sharp decline from highs of ₹217+ in late 2024 to lows around ₹107
• Extended consolidation phase from February to May 2025 between ₹110-145 levels
• Current breakout attempt suggests potential trend reversal from bearish to bullish
Volume Spread Analysis:
Volume Characteristics:
• Significant volume spike visible during the recent breakout session
• Volume of 3.33M is substantially higher than the 20-day average of 972.88K
• Volume confirmation supporting the price breakout attempt above resistance
• Previous volume spikes coincided with major price movements
Volume Price Relationship:
• Healthy volume-price relationship during the current upward move
• Relatively lower volumes accompanied earlier decline phases
• Current breakout attempt volume suggests institutional participation
Key Technical Levels:
Support Levels:
• Primary Support: ₹130-132 (previous resistance turned support)
• Secondary Support: ₹120-125 (consolidation zone low)
• Major Support: ₹110-115 (multi-month consolidation bottom)
Resistance Levels:
• Immediate Resistance: ₹150-155 (psychological level)
• Medium-term Resistance: ₹165-170 (previous swing high)
• Major Resistance: ₹185-190 (Fibonacci retracement level)
Base Formation:
• Rectangle consolidation pattern formed between ₹110-145 levels
• Base duration: Approximately 4-5 months (February to May 2025)
• Breakout from this base suggests potential for sustained upward movement
Technical Patterns:
Primary Patterns:
• Rectangle/Box pattern completion with upward breakout attempt
• Potential inverse head and shoulders pattern on a longer timeframe
• Ascending triangle formation in recent weeks before the breakout
Trend Analysis:
• Short-term trend: Bullish (breakout confirmed)
• Medium-term trend: Transitioning from bearish to bullish
• Long-term trend: Still in recovery phase from major decline
Trade Setup and Strategy:
Entry Strategy:
• Aggressive Entry: ₹143-145 (current levels on any minor pullback)
• Conservative Entry: ₹135-138 (on retest of breakout level)
• Volume confirmation is required for any entry
Position Sizing:
• Risk 1-2% of portfolio capital on this trade
• Position size calculation: Portfolio Value × Risk % ÷ Stop Loss Distance
• Example: For ₹1,00,000 portfolio with 2% risk = ₹2,000 risk capital
Risk-Reward Calculation:
• Risk-Reward Ratio: Minimum 1:2 preferred
• Expected risk per share: ₹15-20 based on stop loss placement
• Potential reward: ₹30-40 per share to the first target
Exit Strategy:
Profit Targets:
• Target 1: ₹165-170 (15-20% upside) - Book 40% position
• Target 2: ₹185-190 (30-35% upside) - Book 40% position
• Target 3: ₹200+ (40 %+ upside) - Trail remaining 20% position
Stop Loss Levels:
• Initial Stop Loss: ₹125-128 (below consolidation support)
• Trailing Stop: Move to breakeven once Target 1 is achieved
• Final Trail: Use 10-day EMA or ₹10-15 trailing stop
Risk Management Framework:
Risk Control Measures:
• Maximum loss per trade: 2% of total capital
• Position sizing based on stop loss distance
• No averaging down if the trade goes against the initial thesis
• Exit if the technical structure breaks down
Portfolio Allocation:
• Maximum exposure to single stock: 5-8% of portfolio
• Sector allocation limit: 15-20% to logistics/supply chain
• Maintain diversification across market caps and sectors
Sectoral Analysis:
Logistics and Supply Chain Sector:
• The sector has shown resilience post-pandemic disruptions
• Growing e-commerce and digitalization are driving demand
• Government infrastructure push benefiting logistics companies
• Increasing focus on supply chain optimization across industries
Sector Positioning:
• NSE:TVSSCS is positioned in the growing third-party logistics market
• Beneficiary of Make in India and manufacturing growth
• Automotive sector recovery supporting the company's core business
Fundamental Backdrop:
Business Overview:
• Leading third-party logistics and supply chain solutions provider
• Strong presence in automotive, consumer goods, and industrial sectors
• Integrated service offerings including warehousing, transportation, and value-added services
Growth Drivers:
• Expansion in new geographies and service offerings
• Technology-driven efficiency improvements
• Growing outsourcing trend in supply chain management
• Recovery in the automotive sector supporting traditional business
Market Outlook and Catalysts:
Positive Catalysts:
• New client acquisitions and contract wins
• Capacity expansion announcements
• Favourable government policies for the logistics sector
Risk Factors:
• Economic slowdown affecting industrial demand
• Fuel price volatility is impacting transportation costs
• Competitive pricing pressure in the logistics industry
• Global supply chain disruptions
My Take:
TVS Supply Chain Solutions presents a compelling technical setup with the recent breakout attempt from a multi-month consolidation. The combination of strong volume confirmation, supportive sectoral trends, and improving fundamental backdrop makes this an attractive opportunity for Short to medium-term investors. However, proper risk management and position sizing remain crucial for the successful execution of this trade setup.
Keep in the Watchlist.
NO RECO. For Buy/Sell.
📌Thank you for exploring my idea! I hope you found it valuable.
🙏FOLLOW for more
👍BOOST if you found it useful.
✍️COMMENT below with your views.
Meanwhile, check out my other stock ideas on the right side until this trade is activated. I would love your feedback.
Disclaimer: "I am not a SEBI REGISTERED RESEARCH ANALYST AND INVESTMENT ADVISER."
This analysis is intended solely for informational and educational purposes and should not be interpreted as financial advice. It is advisable to consult a qualified financial advisor or conduct thorough research before making investment decisions.