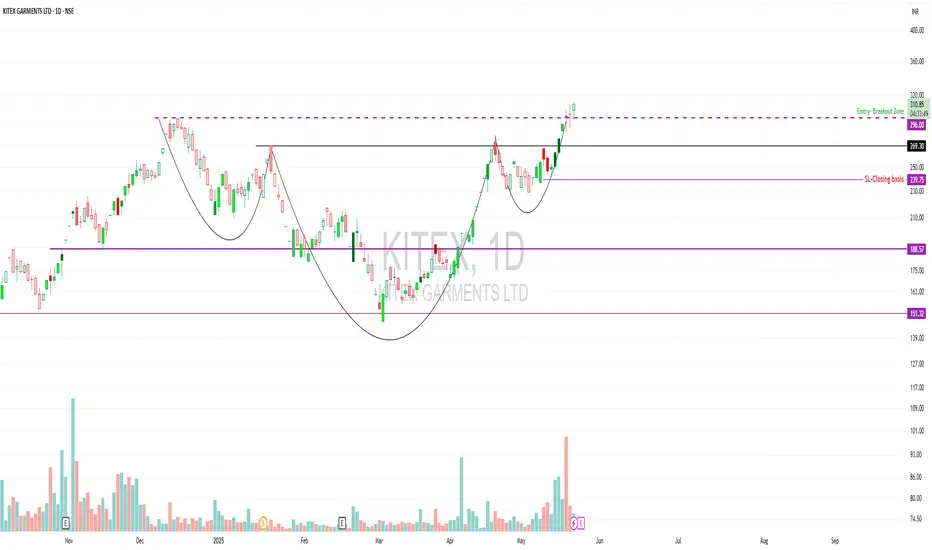
KITEX – Breakout from ATH KITEX – Breakout from ATH ⚠️ Risky but Noteworthy
CMP: ₹311
Breakout Zone: ₹296
Structure: Inverse Head & Shoulders (Daily TF)
Trend: Trading above key DMAs
Volume: On the lower side — no strong confirmation yet
Event Risk: Quarterly results approaching
KITEX has shown an aggressive bounce and is now breaking out of an all-time high zone around ₹296. The structure resembles a head and shoulders variant on the daily timeframe. While technically constructive, volume hasn't confirmed yet, which increases the probability of failed breakout or whipsaw.
Another red flag: This stock is known for locking in Upper/Lower Circuits, which can trap liquidity if momentum fades. Plus, with results around the corner, event risk adds another layer of uncertainty.
⚙️ Trade Plan (Not a Fresh Call, but Educational Insight)
🔹 Entry Idea: ₹296+ confirmed close with volume
🔹 CMP at ₹311 — not an ideal R:R for fresh entry without follow-through
🔹 SL (Closing Basis): ₹239.75 (recent base zone)
🔹 Watch for:
Volume pickup
Retest of breakout zone
Price holding above ₹296 for 1–2 sessions
💡 Consider entering with a small test quantity only if you're comfortable with the risks and volatility.
📚 Educational Takeaway
Not every breakout is clean. Watch how price behaves around ATH zones — these are high-pressure areas. Volume and follow-through matter more than the breakout candle itself.
Stocks with LC/UC tendencies and near-term events demand a cautious approach. Your edge comes not from the pattern — but from your patience and trade management.
⚠️ Risk Management Matters
Size your position wisely. No setup is worth oversized exposure — especially when volatility and newsflow collide. Trade only with a plan and discipline.
📌 Disclaimer
I am not a SEBI-registered advisor. This is for educational purposes only. Do your own research and analysis before taking any position.
Inverse Head and Shoulders
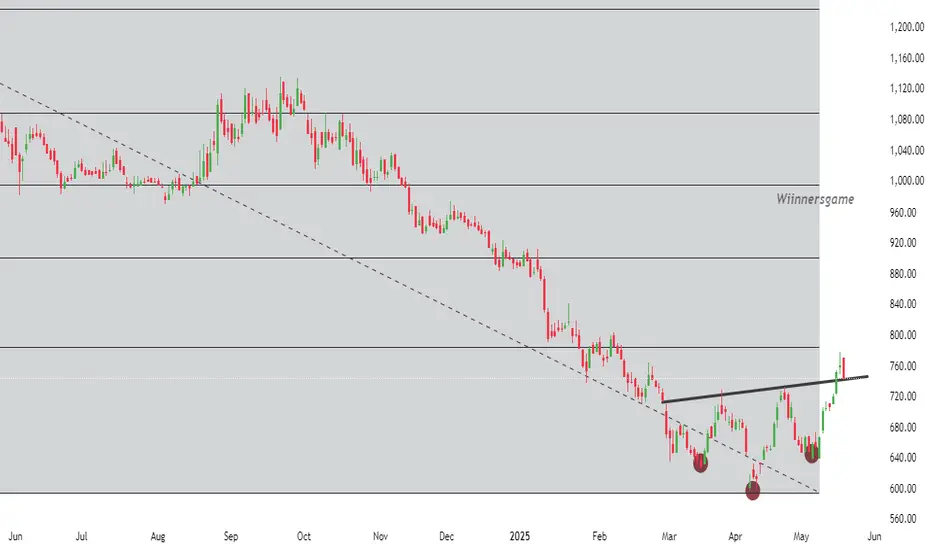
TATA TECH- BULLISH BREAKOUT HAPPENINGTATATECH 740, has given inverse H&S breakout, bullish breakout after long consolidation. Stock has retested its breakout zone. Fresh momentum will continue if sustain above 760 for at least 850-900 levels. Volume and momentum is not supportive for time being
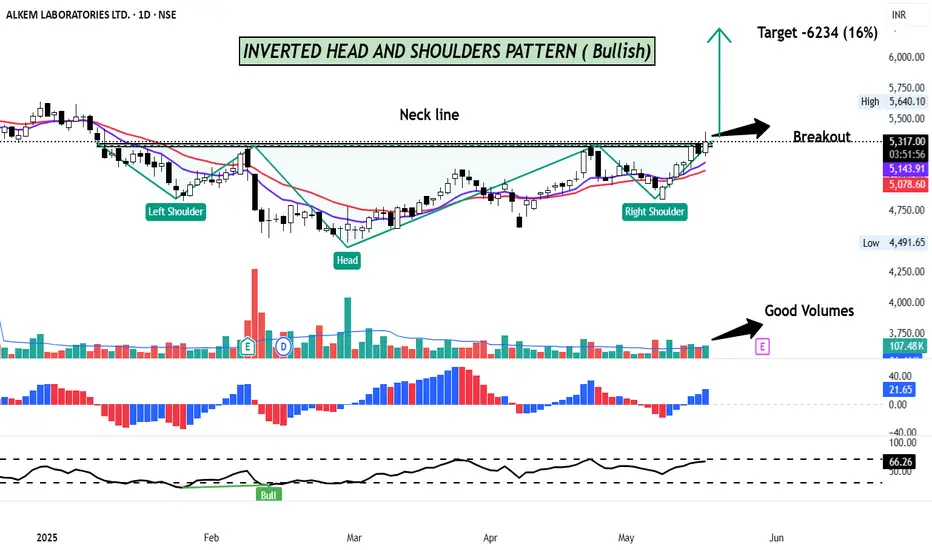
Alkem Labs-Inverse Head & Shoulder Pattern Breakout ( Bullish )Alkem Labs broke the neckline of Inverted Head and Shoulder on the daily chart with good volumes and it is looking good for a decent run.
The inverse head and shoulders pattern is a bullish reversal pattern in technical analysis, indicating a potential shift from a downtrend to an uptrend. It's characterized by three consecutive troughs, with the middle trough (the "head") being the lowest, and the other two troughs (the "shoulders") forming higher lows. The neckline is a trendline connecting the highs of the shoulders and the head.
On the Daily timeframe, the stock is trading above its 11 day EMA and 22 day EMA,and RSI is at 66 suggesting positive bias.
CMP - 5340
TARGET- 6234 (16%)
SL- 5180
Disclaimer: This is not a Buy/Sell recommendation. For educational purpose only. Kindly consult your financial advisor before entering a trade.
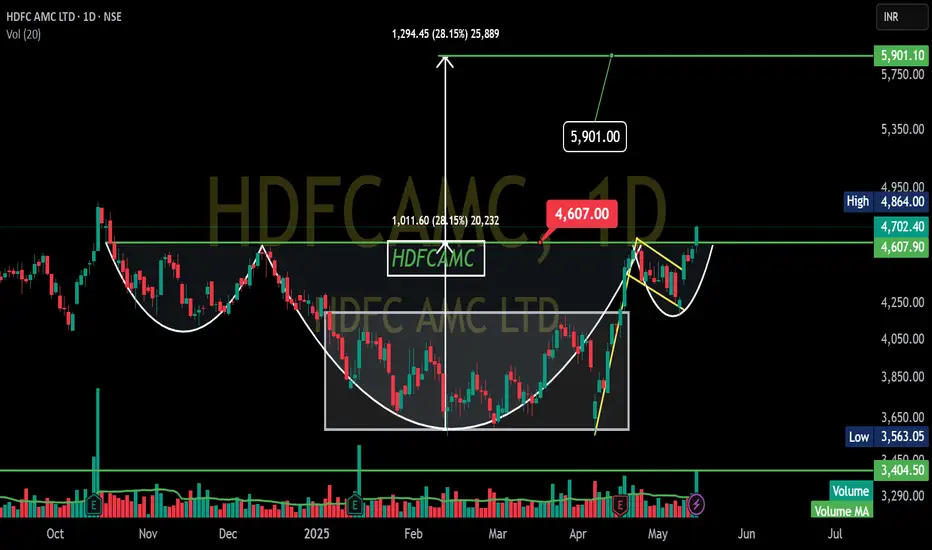
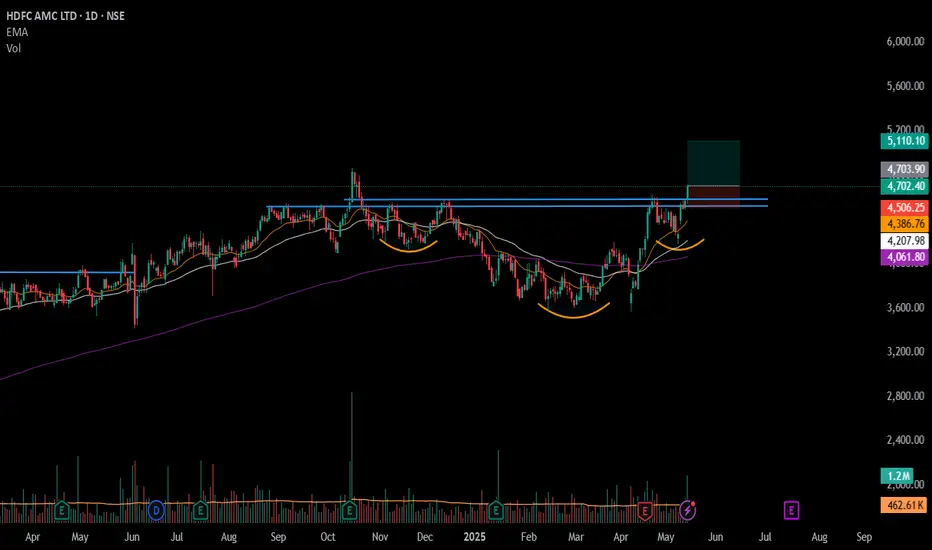
HDFCAMC - Inverted head and shoulder - Breakouttechnical analysis of the HDFC AMC LTD chart you've shared.
Looking at the price action, potential Inverted head and should pattern forming, which is generally considered a bullish sign.
Here's a simplified breakdown:
Head: Notice the rounded bottom shape that formed roughly between Dec 2024 and early April 2025. This suggests a period of consolidation before a potential upward move.
Handle: After reaching a high around ₹4,607, the price has pulled back and is now consolidating in a smaller downward sloping channel (highlighted by the yellow lines). This pullback is forming the "handle" of the pattern.
Breakout Level: The horizontal line you've drawn around ₹4,705 acts as a resistance or neckline. A sustained break above this level could signal the completion of the cup and handle pattern.
Target: Potential target around ₹5,901. This target is often estimated by measuring the depth of the head and adding it to the breakout level.
In simple terms:
The stock price went down, formed a rounded bottom (the head), then went up and is now taking a small dip (the handle). If it breaks above the ₹4,700 level, it might head towards the ₹5,901 area.
Overall, this chart suggests a potential upward move for HDFC AMC if the cup and handle pattern is confirmed with a breakout above ₹4,700.
#HDFCAMC - IHNS BreakOut in DTF 📊 Script: HDFCAMC
Key highlights: 💡⚡
📈 Inverse Head & Shoulders Set up in Daily Time Frame.
📈 Price consolidated near Resistance.
📈 BO with Volume
📈 MACD Crossover
📈 RS Line making 52WH
📈 One can go for Swing Trade.
BUY ONLY ABOVE 4700 DCB
⏱️ C.M.P 📑💰- 4703
🟢 Target 🎯🏆 – 8.6.0%
⚠️ Stoploss ☠️🚫 – 4.20%
️⚠️ Important: Market conditions are Okish, Position size 25% per Trade. Protect Capital Always
⚠️ Important: Always Exit the trade before any Event.
⚠️ Important: Always maintain your Risk:Reward Ratio as 1:2, with this RR, you only need a 33% win rate to Breakeven.
✅Like and follow to never miss a new idea!✅
Disclaimer: I am not SEBI Registered Advisor. My posts are purely for training and educational purposes.
Eat🍜 Sleep😴 TradingView📈 Repeat 🔁
Happy learning with MMT. Cheers!🥂
Camlinfine offers good Risk To Reward. Add to WL⚠️ HIGH-RISK, HIGH-REWARD OPPORTUNITY
Stock: CAMLINFINE
Time Frame: 🕒 Daily
🎯 Entry Strategy
📌 Entry Trigger: ₹133.6 (Wait for a weekly close above this level)
📈 Targets
T1: ₹144.4
T2: ₹168.8
T3: ₹186.2
ATH Potential: ₹231.39
🔻 Stop-Loss (SL): ₹111.7 (16% risk)
🔍 Technical Highlights
📐 Trendline Breakout followed by a healthy consolidation.
Formation of a ☕ Cup & Handle pattern—indicative of bullish momentum.
🔄 Inverse Head & Shoulders, signaling a potential trend reversal.
⚠️ Risks to Consider
Weak fundamentals, with poor ROE and ROCE.
Volume needs significant improvement for sustained momentum.
💡 Why This Could Work
If this marks the start of a trend reversal, the potential reward is substantial.
However, this is a high-risk bet, so position sizing and risk management are absolutely critical.

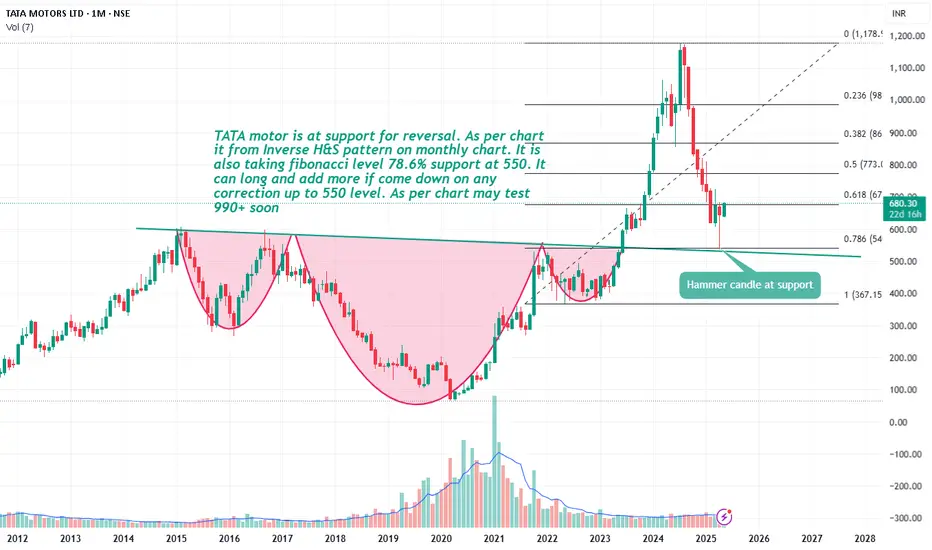
Tata motor long on any correction.TATA motor is at support for reversal. As per chart it from Inverse H&S pattern on monthly chart. It is also taking fibbonacci level 78.6% support at 550. It can long and add more if come down on any correction up to 550 level. As per chart may test 990+ soon.
SBI form Inverse H&S.SBI form Inverse H&S pattern. Today gives break out of neckline 780. SBI is at demand zone add more if come down to 780. Close below 760 would be the violation of this pattern.
As per chart it may test 785-807 soon.
As per OI data on dated 17.04.2025 there is considerable OI shading on CE side and OI build up on PE side. Stock is in good momentum as upper Bolinger Band tested and expanded. As per indicator all are bullish only Moving average need to improve. There are good chance for retest the neckline.

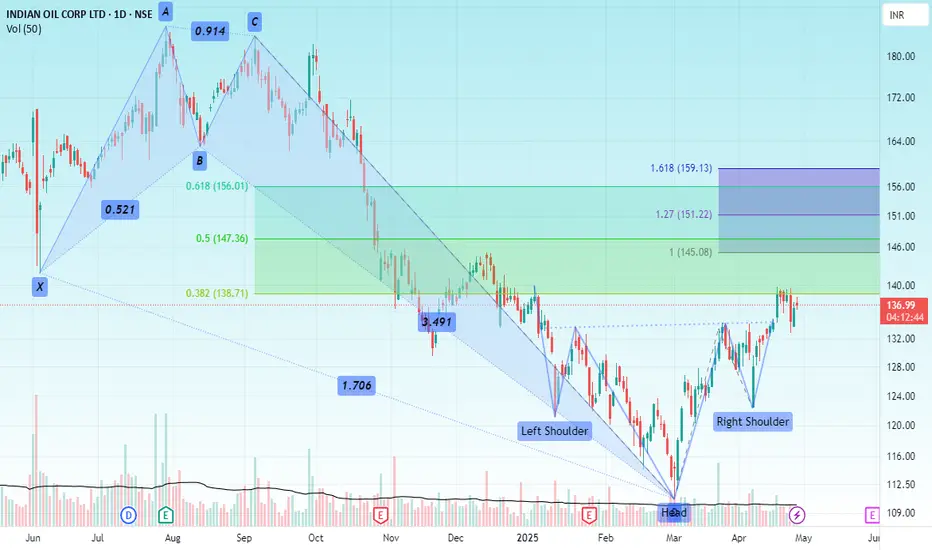
IOCHello & welcome to this analysis
A deep 6 months correction lead to the formation of a Bullish Harmonic Crab pattern in March 2025 post which during accumulation (consolidation) phase formed an Inverse Head & Shoulder.
A 38% retracement of the bullish harmonic pattern has been done and now its completing a pullback of the IHS breakout by retesting the neckline.
Potential upside levels are 145 and 160 for both the IHS & Bullish Harmonic Crab
All the best
POWER GRID - INVERSE HEAD & SHOULDERS BREAKOUTSymbol - POWERGRID
Power Grid Corporation of India Ltd. is a Maha-ratna Public Sector Enterprise and a key player in the Indian power transmission sector. It operates as a central transmission utility and is involved in the planning, implementation, and maintenance of transmission systems across the country.
Recently, the stock has exhibited a notable bullish breakout after forming an Inverse Head and Shoulders pattern. A classic reversal formation signaling a shift from a downtrend to an uptrend. Following the breakout, the stock may witness a retest of the neckline zone, which now acts as a support area - around 300 to 303 range. This zone offers a favorable risk-reward entry for positional investors anticipating further upside.
The projected target from this breakout lies near the 350-355 zone, offering a potential 17-20% upside from current levels, based on the height of the pattern added to the breakout point.
For prudent risk management, a stop loss below 280 is advisable, just below the right shoulder, to protect against unexpected downside.
Overall, the breakout of a well-formed Inverse Head and Shoulders on a higher time frame charts presents a bullish outlook for Power Grid, making it a strong candidate for medium-term investment consideration.
Disclaimer: The information provided here should not be construed as a buy or sell recommendation. It reflects my personal analysis and my trading position. Please consider this trading idea for educational purposes only. Thank you!

(NSE:SUNPHARMA) Inverted H&S Breakout Eyes New ATH Chart Analysis:
Sun Pharma has formed a textbook Inverted Head & Shoulders (H&S) pattern on the daily timeframe, signaling a strong bullish reversal. The pattern completed with a clean breakout above the neckline at ₹1,820 , accompanied by a surge in trading volume (highest in 2 weeks). This validates buyer conviction and sets the stage for a sustained upward move.
Key Levels:
Neckline: ₹1,820
Resistance Targets:
Target 1: ₹1,910
Target 2: ₹1,960 (All-Time High, ATH)
Support Zone:1,750
Trade Setup:
Entry Zone: ₹1,820–1,835 (post-breakout retest opportunity)
Stop Loss: ₹1,750 (below the right shoulder to avoid false breaks)
Why This Works?
✅ Pure Price Action Focus: The analysis relies solely on pattern structure, volume, and key levels—no indicators cluttering the chart.
✅ Volume Confirmation: Breakout supported by above average volume, reinforcing bullish momentum.
✅ Pattern Perfection: Classic Inverted H&S structure with well-defined neckline and symmetry.
✅ Breakout Conviction: Price closed decisively above ₹1,820, indicating strong follow-through.
For Indicator Users:
Traders who incorporate tools like RSI or Moving Averages can cross-verify this setup with their preferred strategies. For instance, the breakout aligns with bullish momentum on higher timeframes.
Risk Management:
Trail stops to lock profits as price approaches ₹1,910.
Partial profit booking at ₹1,910 (T1) recommended.
Conclusion:
Sun Pharma’s breakout above ₹1,820 opens the door for a rally toward its ATH. Pure price action traders can leverage the clean setup, while others may combine it with their preferred indicators. Focus on the neckline (₹1,820–1,835) for potential entries, and maintain strict risk management.
*This analysis is for educational purposes only and does not constitute financial advice, investment recommendation, or an offer to buy/sell securities. Trading involves substantial risk of loss, and past performance is not indicative of future results.

SBIN Upside potential with a Bullish Bias The Bank Index has been performing since few days
Also structure level SBIN is poised for an upmove, it has a pattern Inverse Head & Shoulders which is a bullish pattern and with a significant upside technically
Suggested to Buy at CMP or wait to retrace at 780s zone
SL 750s zone
Target 870s zone

Union Bank of India - Inverse Head & Shoulders Breakout!Union Bank of India (NSE: UNIONBANK)—Inverse Head & Shoulders Breakout! 🚀
📈 Chart Overview:
The stock has formed a multiple inverse head & shoulders pattern, indicating a strong bullish reversal.
A downtrend resistance has been breached, confirming bullish momentum.
🔍 Key Levels:
Resistance Levels: ₹140, ₹150
Support Levels: ₹125, ₹120
📊 Observations:
Volume spike supports the breakout, signaling strong buying interest.
RSI at 66.34, approaching overbought levels but still has room for further upside.
Sustaining above ₹130.02 will confirm further bullishness.
🚀 Trading View:
A breakout above ₹135 could lead to a further rally toward ₹140-₹150.
Any retest of ₹130.02 can act as a potential buying opportunity.
📌 Disclaimer: This is for educational purposes only. Always conduct your research before making any investment decisions.

Sun Pharma's Inverse Head and Shoulders: Bullish Setup Ahead!Hello Traders! Today, we’re taking a look at Sun Pharmaceutical and a potential Inverse Head and Shoulders pattern that's setting up on the chart. This pattern is a classic bullish reversal setup that indicates the stock could be gearing up for an upward move, especially if the neckline breakout gets confirmed. The price has already formed the left shoulder , the head , and now we’re watching the right shoulder develop.
Once the neckline breakout happens, we’ll have a solid confirmation of the bullish move. This would give us an opportunity for fresh entries, while those already in the trade can hold their positions with a trailing stop loss . A piercing line candlestick pattern is also forming, showing increased buying interest at the right shoulder , adding more confidence to this setup.
For the entry, keep an eye on the range around 1730-1713 , with a stop loss set at 1684 to protect from unexpected moves. The targets for this trade are 1748 for short-term gains, 1792 for medium-term moves, and the final long-term target of 1587 . If this pattern confirms, we could see a nice rally in Sun Pharma . Let’s stay sharp and manage risk effectively as we watch this pattern unfold!
Disclaimer:- This analysis is for educational purposes only. Please trade responsibly and consult a financial advisor before making any decisions.
If you found this analysis helpful, don’t forget to like, follow, and share your thoughts in the comments below! Your support keeps me motivated to share more insights. Let’s grow and learn together—happy trading!

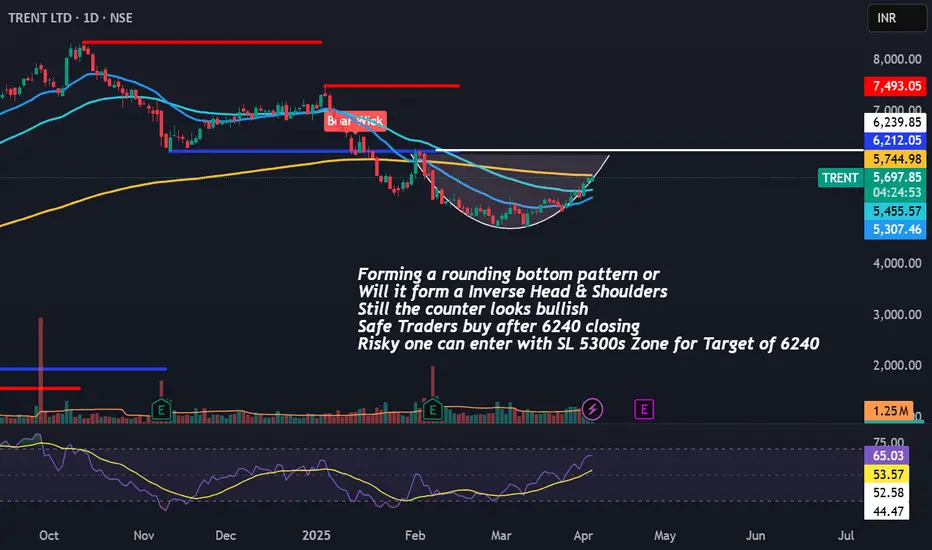
Trent Bullish Bias Target of 6240/-Forming a rounding bottom pattern or
Will it form a Inverse Head & Shoulders
Still the counter looks bullish
Safe Traders buy after 6240 closing
Risky one can enter with SL 5300s Zone for Target of 6240
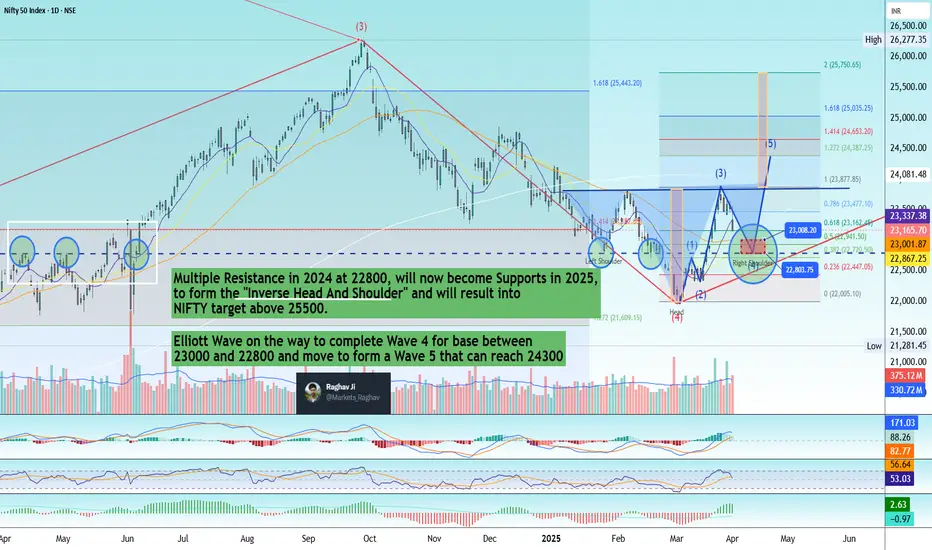
Shocked by Nifty50's sharp correction? Don't worry!Today NIFTY has crashed by 350+ points and reached 23165, a correction from 23800 levels .
Let me explain, This Nifty Daily chart is a classic example of how many fundamentals of Technical Analysis are satisfied.
1) Old resistances in 2024 at 22800 will now become Support levels
2) If it goes to 23000 and stops at 22800 levels it also fulfils the Wave 4 criteria, which says that Wave 4 never gets in Wave 1 territory
3) If this happens, the chart also completes an Inverse Head and Shoulder's Right Shoulder bottom to make an up-move towards the Neck.
4) if it crosses the Neck, the targets of Nifty will be above 25500, which will be 2500+points.
Technicals are beautiful only when you practice them.
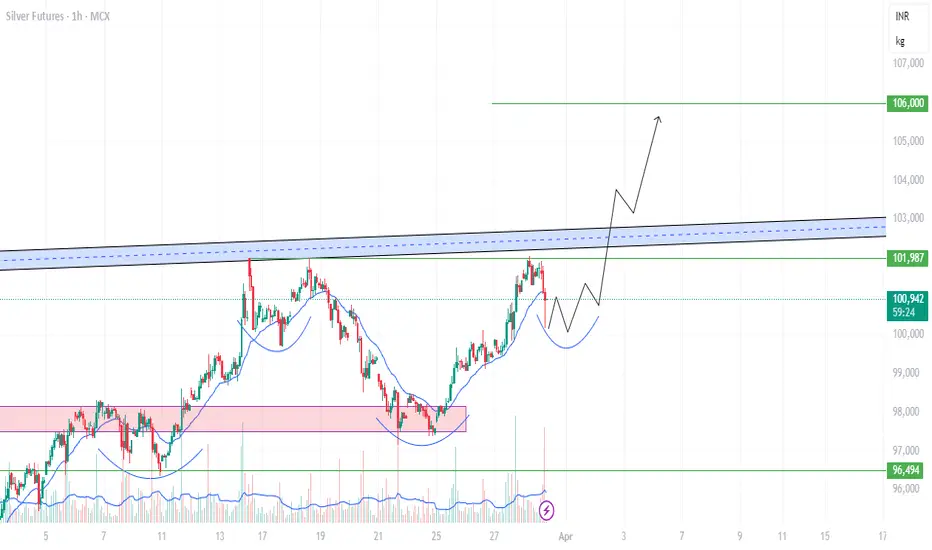
Inverse Head and Shoulder pattern In Silver ? New high Soon?chart shows an Inverse Head and Shoulders pattern in Silver Futures on the 1-hour timeframe.
The neckline (resistance) is marked by the blue zone, which, if broken with strong volume, could confirm a bullish breakout. The projected price movement (black arrow) suggests a potential rally toward ₹106,000.
A confirmation would come if the price breaks above the ₹101,987 - ₹103,000 resistance zone with volume.
Place SL below the right shoulder (~₹100,000) for a safe trade.
Zomato is showing weakness it may test 170 soon.Zomato is weak on monthly and weakly chart. It forms Fake breakout with double top pattern on monthly chart.
As per chart showing weakness on daily chart also as RSI drag below 40. It can short on any rise or here for target 170 soon.

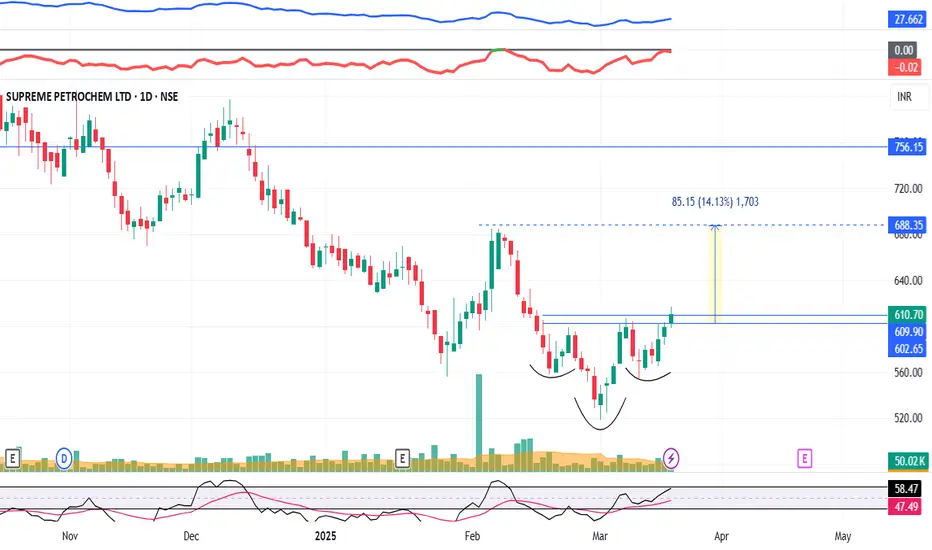
SPLPETRO : #SPLPETRO #swingtrade #patterntrading
SPLPETRO : Swing Trading
>> Inverse H&S pattern visible
>> Good Strength in Stock
>> Volume Building up
>> Risk Reward Favourable
Swing Traders can lock profit at 10% and keep Trailing
Please Boost, comment and follow us for more Learnings.
Note : Markets are still Tricky and can go either ways so don't be over aggressive while choosing & planning your Trades, Calculate your Position sizing as per the Risk Reward you see and most importantly don't go all in
Disc : Charts shared are for learning purpose only, not a Trade recommendation. Do your own research and consult your financial advisor before taking any position.
Inverse Head and Shoulders pattern on the Silver Futures (MCX)The 4-hour Silver Futures (MCX) chart is showing a clear Inverse Head and Shoulders pattern, a bullish reversal signal. The pattern comprises a left shoulder, head, and right shoulder, with the neckline around the ₹97,800 - ₹98,300 region.
The price is currently testing this neckline, and a successful breakout above this level, confirmed by increased volume, could trigger a significant upward move.

Bitcoin showing weakness. It may test 76076Bitcoin chart is weak now. weakly RSI below 60 MACD also negative. Double top pattern form and correction showing. As per chart it may test 76076 soon. It can short on any bounce up to 92000.
These is Neckline place near 76076 of Inverse H&S pattern. It would be retest of neckline.

Redington Ltd – CNH & Inverse H&S Trade with Caution!🚀 Pattern Highlights
Cup and Handle & Inverse Head and Shoulders:
Redington is showing a potential Cup and Handle (CNH) formation alongside an Inverse Head and Shoulders, signaling a breakout at ₹238–₹240.
📊 Technical Levels
Entry: ₹238–₹240 (Breakout Level)
Stop Loss: ₹181 (24% below, on a daily closing basis)
Target: ₹340 (~42% upside, positional/medium-term)
Risk-Reward Ratio: ~1:1.75
🕵️♂️ Observations
1️⃣ The stock is trading within an ascending channel, forming higher lows.
2️⃣ It's below its 52-week high but not correcting much during this bearish phase.
3️⃣ The channel top may act as a key resistance.
4️⃣ Still in Higher High (HH) and Higher Low (HL) format while many other stocks have transitioned to Lower High (LH) and Lower Low (LL) structures.
5️⃣ Volume confirmation will be crucial for a breakout.
⚠️ Risks to Consider
Market Sentiment: Current market conditions are bearish, with indices correcting and most sectors showing weakness.
Bearish Transition?: No confirmation if this is a bull market correction or the start of a bear market.
Earnings Season: Quarterly results are around the corner, which could bring surprises.
📌 Why Risk Management Is Key
Example: Newgen Software recently broke out at ₹1,548 (ATH), moved ~15%, but then plunged 41% in just 9 trading sessions, trapping bulls.
Solution: Trade light with 7–10% of your usual position size (e.g., buy 7 shares if you usually buy 100). This limits risk while keeping you involved.
🏁 Conclusion
Trade cautiously: Position size, risk management, and patience are your best tools here.
If the stock doesn’t fall further, it could be an ideal candidate when the market reverses and bottoms out.
For Beginners: Avoid this trade for now. Add it to your watchlist and observe.
✨ Final Thoughts
Redington is trading tightly above its key DMAs with narrow-range candles. This indicates strength despite market weakness. Watch closely for a breakout confirmation.
🔍 Disclaimer
This is not financial advice. Do your own research (DYOR) and consult a financial advisor before making investment decisions. Trading involves risks, and capital is at stake. This idea is shared for educational purposes only.

#REDINGTON - Potential Break Out / Feb'25📊 Script: REDINGTON
Key highlights: 💡⚡
📈 IH&N Formation in Weekly chart.
📈 IH&N Formation in Daily chart also
📈 Went into a Side Ways consolidation for over a Nine months.
📈 Volume spike seen in past
📈 MACD Cross Over.
📈 One can go for Swing Trade.
🟢 If you have any questions regarding the setup, please feel free to leave your inquiries in the comments, and I will respond promptly.
BUY ONLY ABOVE 233 DCB
⏱️ C.M.P 📑💰- 226
🟢 Target 🎯🏆 – NA%
⚠️ Stoploss ☠️🚫 – NA%
⚠️ Important: Always Exit the trade before any Event.
⚠️ Important: Always maintain your Risk & Reward Ratio.
✅#Boost, #Like & #Follow to never miss a new idea! ✅
Disclaimer: I am not SEBI Registered Advisor. My posts are purely for training and educational purposes.
Eat🍜 Sleep😴 TradingView📈 Repeat 🔁
Happy learning with MMT. Cheers!🥂
