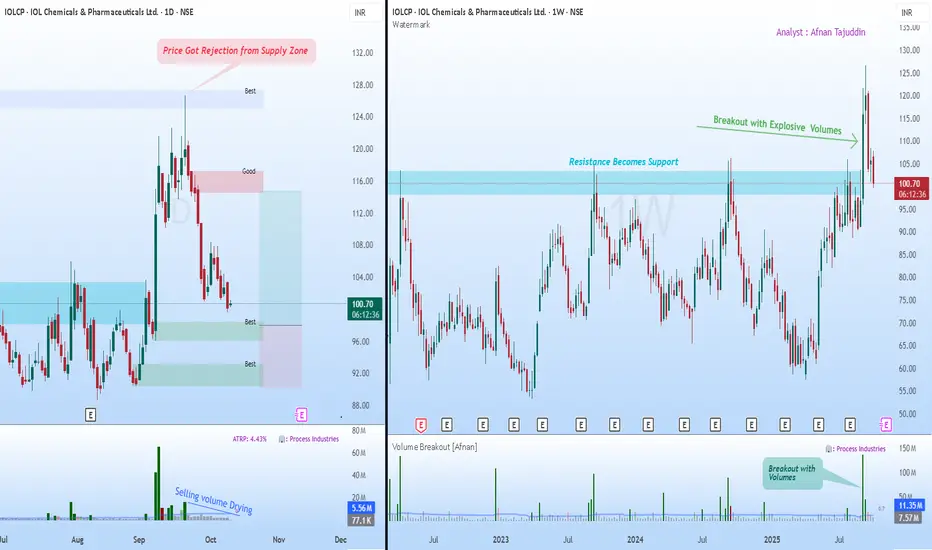
Supply & Demand Setup in IOLCP Could Signal Next Big Move📊 Supply & Demand View 📊
If you’ve been watching IOL Chemicals lately, you’ve probably noticed how cleanly it’s been respecting those key supply and demand structures. These zones aren’t random—they’re the visible fingerprints of institutions building or offloading positions in stages. When price revisits such levels, we often see sharp, almost surgical reactions.
Now, what’s catching my eye on the daily chart is the recent rejection from a supply zone. The pushback was clear, triggering a short-term decline. But here’s where it gets interesting: the selling volume has been steadily tapering off. That usually suggests the aggressive sellers are stepping aside, hinting that downside momentum could be losing steam.
Meanwhile, we’ve got multiple untested demand zones forming below—areas where buyers have shown conviction before. If price drifts into one of these regions again, I wouldn’t be surprised to see a fresh wave of institutional buying step in.
🚀 Breakout Retest View 🚀
Zooming out to the weekly chart tells a complementary story. After grinding under a major resistance for months, the stock finally broke through with explosive volume —the kind that only big money typically leaves behind. That breakout wasn’t just a blip; it reset the broader structure.
Now, the same resistance level has flipped into support—a textbook case of the law of polarity . As long as price continues to respect that zone, the larger trend remains firmly constructive.
What I find compelling is the combination of elements here: strong breakout volume, a healthy pullback, and structure alignment across timeframes. All signs point to this being a typical retest phase rather than a reversal.
✨ Final Takeaway ✨
Both charts are speaking the same language. The daily timeframe is hinting at exhaustion from sellers, while the weekly view reinforces the idea of a bullish continuation once demand reasserts itself. Should price stabilize around those lower demand zones, we could be looking at the next leg of the trend unfolding from there.
💡 Risk Management Reminder 💡
It’s easy to get carried away when the setup looks clean, but the market doesn’t owe certainty to anyone. Stick to your stop-loss, size your positions with care, and remember that discipline—more than any indicator—is what protects your capital.
“Charts reveal opportunities, but discipline secures profits.”
🔄 Stay patient, stay consistent — the market rewards preparation, not prediction. 🔄
This breakdown is shared purely for educational purposes and shouldn’t be taken as a trading or investment recommendation. I’m not a SEBI-registered analyst.
Iolcplong
IOLCP LONG _ trade only in the zonesLong Candidate With Strong Weekly Candle with Volume.
Since price bounced already better to buy upon retracement at 385. or after strong closing above 514.
Short to Long term traders accumulate more at 294 /289.
More view in the charts.


Late night Technical analysis talk - only potential stocks Late-night Tech series of ours provides you with potential stocks :)

IOLCP at crucial levels! | CHART#18IOL Chemicals & Pharmaceuticals Ltd. engages in the manufacture of organic and inorganic chemical compounds. It operates through two segments: Chemicals and Drugs. The Chemical segment produces and sells ethyl acetate, iso butyl benzene, acetyl chloride, and mono chloro acetic acid. The Drug segment offers a various active pharmaceutical ingredients such as ibuprofen, metformin, fenofi brate, and lemotrigine.
*Stock Analysis*
Stock has been flowing inside a descending channel (Yellow) after reaching its peak at 898.90 levels.
Sub channel has been formed inside this channel which is of opposite nature (Violet) with above average volume which indicates potential buyers around this region.
Sub channel lost its upward momentum on touching the main channel at 725 levels thus retracing to 600 levels and probably took support at trendline.
Volume spike is seen at 600 levels, RSI pointing upwards so we can establish 600 levels as Demand/Buying Zone.
Once its enters the channel (Violet), upward travel starts to 725 and 790 levels.
Coming to the fundamentals - IOLCP is a fundamentally strong company which has its roots in chemical industry.
It has a CAGR of 67%, ROE track record of 51.94% and its a Debt free company.
P/E ratio is nearly 8.54 which is less than Industrial average due to consistent increase in Earnings.
*Important Levels to Watch*
-- Entry @ above 670 levels on support
-- Target @ 725 | 790
-- SL @ 525
Notes :
FII has reduced the stake from 7.7% to 5.9% YoY. Major stake(50%) is with public. So stock can be affected by news based panic selling
India's specialty chemicals market to grow to $40 billion by 2025: McKinsey
▢ Feel free to suggest your view on this as learning is earning here.
▢ Drop a follow here😉 @GokulHari
Happy Trading :)
-- GokulHari
❗❗ Disclosure : I am not a SEBI registered analyst. The information provided here is for education purposes only. I will not be responsible for any of your profit/loss with this suggestions. Consult your financial advisor or do your own analysis before taking any decision ❗❗

IOLCP - Bullish - LT ViewThe trend has been broken and now retesting the trend line. A good level to buy to ride the trend.
Keep note of the stop loss mentioned in the chart.
Happy trading :)
