Fusion Micro Finance DailyFusion Micro Finance Daily Chart. Stock Posted Good Quarter Result. Breakout Soon Candidate. Keep in your Watch list..
IPO

Fusion Micro FinanceIPO Base Breakout-
Fusion given cup and handle Ipo base breakout looking good for above target

BIKAJI - IPO BASE BREAKOUTStock broke out into new high ground after just a 10% deep correction post listing


Latent view analytics Stock is trading below ipo price
It has produced good results
Expect for good upward movement
All levels mentioned in chart
Trade according to levels
Latent View Analytics reports Q2 earnings.
▶️Net profit up 71.7% at Rs 37.2 cr Vs Rs 21.7 cr (YoY)
▶️Revenue up 39.7% at Rs 132.4 cr Vs Rs 95.8 cr (YoY)
▶️EBITDA up 40.5% at Rs 37.2 cr Vs Rs 26.5 cr (YoY)
▶️EBITDA margin at 28.1% Vs 27.9% (YoY)

Fundamentally good stock trading at the demand zone.Syrma SGS Technology gave a decent listing gain of 27-30% and thereafter went as high as 324 giving 78% returns.
This gem has corrected to 270 zones once from where it gained 38% and currently it is back at the demand zones of 270.
A Fundamentally good stock is available at nearly 50-60% less than its ATH. Can surely be accumulated for long and medium term.

GLENMARK LIFESCIENCES BREAKOUTI analyzed GLS on yesterday and today it had given breakout of the previous range by blasting nearly 8%. More strength above 450. Still trend hasn't changed but more chances of bullishness, falling wedge pattern forming in weekly tf.

CMS info near to its IPO base breakoutCMS info systems is near to its IPO base breakout.
want to learn more about IPO base trading.
contact 7500505750

TEGA Industries B/O and reversal from bottomThis stock has made double bottom in Daily time frame and has reversed the trend.
The stock is trading with good volumes so liquidity wont be an issue.
the stock is new to market as this was listed recently through IPO window and has created a great returns through listing gains.
profit booking in the stocks by big players led the stock to decline. now it is slowly gaining the momentum.
Place strict stop loss according to your risk appetite and holding period.
do not allocate major chunk of the capital to any stocks, diversify your investments across various sectors and caps.
This is not a recommendation.
this is my view for the stock I and urge you all to do your own research and analysis before investing.
Note. Nifty has been in a bull rally since few weeks now and a small correction can be seen in coming days. A red candle bigger than previous one day / two days candle is the sign to sell and to save the capital. (applies to all short term positions of the trade) once the capital is saved we can take another trade at any time. Cutting the losses is the key.
I have attached below the links for related ideas, please have a look and share your opinions on that in the comment box below.
Thank you see you soon with another idea.

APTUS FINANCE HOLDINGAptus Finance -
Time frame - 1 hr
Study -
1. Unable to cross 363 resistance level
2. took a strong support near 300
3. closed at 328
4. 10 times volume increase on Friday from support zone
This chart is for only educational purpose
No trade is recommended

IPO cup completed the cup pattern at IPO high and positive price action today in nifty breakdown of 2%

triangular pattern breakout headed towards All time highThis breakout is similar to NSE:DEVYANI .
In Devyani Int. Ltd. pattern is similar but having more data.
.What did happen to Devyani Int. ltd.?
Devyani moved to "All time high resistance'' & hold the upper level then breakout with engulf candle.
So, high probability is that it may behave the same.
13% away from all time high (we should capture this move)
Only one target= All time high
"Happy Swing Trading"

PayTM - Target 800. GO GO GO!!!Paytm has been consolidating in a range for the last four months. The sentiment is still bearish as the price continues to trend higher in a channel forming an interesting classical cup handle price pattern. A failed breakout failing is an excellent opportunity to enter.
Target 800 Stop 698 Enter 715

Kalyan Jewelers - Shining bright Kalyan Jewelers is been in a correction since IPO, a decent consolidation and breakout is visible with volumes and momentum now, Lets see that it can be an outperformer from here..

LIC LISTING DAY UPDATE : SHOULD YOU HOLD IT OR SELL IT ??Hello !!
Welcome to the quick update of LIC INDIA share, one of the biggest IPO that was listed today morning.
Even after a lot of hype and huge market share, LIC IPO was not given much importance by the investors. The IPO was listed at a discount of around 9% at Rs 872. The retail investors got the gains as the IPO was provided at a discount to them. However, we saw some buying at the Rs 872 level, pushing the price all the way up to Rs 918. As of now, with the 1 min timeframe chart, I can see the stock can touch up to Rs 941.
LIC may be a good stock for long-term buying. As of now, we need to wait for a clear picture. Let's see how the market responds by the day close and we can take a possible entry if we see some positive response.
This is not financial advice, please do your own research before investing and we are not responsible for any of your losses or profits.
Please like and share and comment on this idea if you liked it.

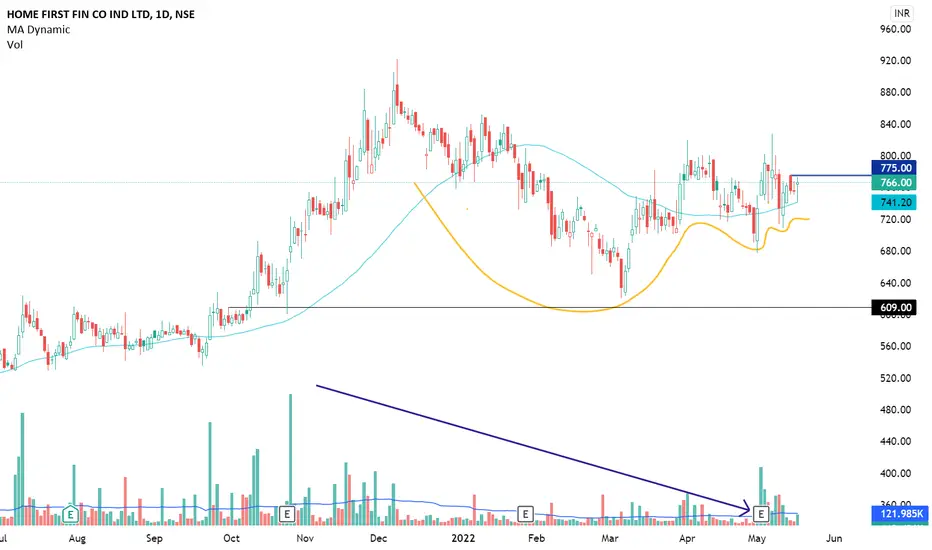
HomeFirst-VCP HomeFirst is exhibiting volatility contraction near 50MA after its run up post the IPO base breakout.
MANYAVAR heading for IPO base breakoutStock is moving out of a tight range on daily towards listing day high.
High RR trade if works I’m favour
Took a position @881 with a 3% stop.

Expecting Good ReversalNSE:CARTRADE
High probablity setup in CarTrade.
Stock is in Good Uptrend and tring to break the Resistance.
The Drastic fall Since the IPO might reverse from here
Reason of the Very disappointing performance of the company was
truly its Weak Fundamentals.
As the Company has improved over its Fundamentals I expect
a good growth into it.
This is what I think is Attracting Investors into it.
if the Stocks Closes above 660 then I expect it
to Further move towards 700-760
NOTE - THE ABOVE IDEA IS MY PERSONAL VIEW
PLEASE MAKE YOUR OWN RESEARCH TOO.
Happy Investing....!!!

BUY METRO BRAND Cmp 545 with stoploss of 512 and 2nd sl 498 with an open tgt . RSI also given Breakout .
Company has also announced an interim dividend ex DATE 16 March,
DO ur own research before Buying .

Yet another red day as Indices drift lowerNIFTY 50 EOD ANALYSIS 14-12-21
In this post, I talk about the analysis for the day and the trading range for tomorrow. The video discusses with the help of the charts how the indices as well as leading stocks performed during the day and their likely play tomorrow.
O 17283.20
H 17376.20
L 17225.80
C 17324.90
EOD -43.35 points / -0.25%
SGX Nifty 14-12-21 @ 1845h = +25 points
FII DII = -342 Crores
CHART BASED CONCLUSIONS using 5 Minutes Chart
Nifty opened with a strong gap down and then made an immediate recovery. It tried to move towards the previous close but then sold-off and made a new low.
And then bounced back from there and as FTSE opened it breached the previous close only to begin yet another sell-off of 100+ points but failed to end flat or even closer to 17375-80.
The moves were quite choppy throughout as there was a hard battle ongoing between the bulls and the bears.
In the process, Nifty has made a lower high and a lower low.
NIFTY WEIGHT LIFTERS & DRAGGERS
Top 5 Lifters contributed = 25
Top 5 Draggers contributed = 59
Net = -34
BANK NIFTY WEIGHT LIFTERS & DRAGGERS
Top 3 Lifters contributed = 34
Top 3 Draggers contributed = 68
Net = -34
POSITIVES
The indices managed to make a good recovery from their day lows.
FII selling is well below 1.000 Crores and is indicating cooling off of the selling pressure.
NEGATIVES
Reliance ended below 2400 and this is going to weigh a lot on Nifty performance.
India Vix has gone up.
HDFC twins, and Kotak Bank are still in the negative and this is impacting the indices.
TRADING RANGE FOR 15 Dec 21
Nifty Support = 17200-300 may well be the new base.
Nifty resistance = 17400-450-500-550-600 on a closing basis.
Bank Nifty Support = 36200-500-800
Bank Nifty resistance = 37000-200-500-700
INSIGHTS / OBSERVATIONS
Both the indices had a narrower range in comparison to yesterday and even though they ended in red, but the extent of redness is lesser.
My reading is that the indices now seem to evince buying interest around today’s lows. This means that 36500 on Bank Nifty and 17200 on Nifty may well prove to be the new swing base or areas of interest or value.
Though FTSE was positive - the extent lowered as it progressed, but our indices somehow managed well to close in the red. This was quite evident as Bank Nifty was not allowed to close even on a 5 minute candle in the last one hour. This also made Nifty end in red.
Reliance and Bajaj Finance were the leading draggers yesterday and they have maintained their position at the level. This is why Nifty ended in red today. And for Bank Nifty, Kotak Bank and HDFC Bank were responsible for the red closing. Even if these 4 do not drop further, the indices could start seeing some greenery in the numbers and on the charts.
What do you feel about this?
Here is the video link --
Thank you, and Happy Money Making!
Umesh
14-12-21
NOTE --
This write-up is not a prediction mechanism for the movement of Indices in the Indian markets as the markets are unpredictable in nature. I may refer to many data points in the article but I do not base my view on any of these standalone. In fact, I prefer to react to the price moves than predict the price moves. I also do not review Open Interest. Whatever data points I am using, are all stated in the article. The article title, as well as its contents, can at best be stated as --- This Is How I Read Nifty. I hope I have been able to set the expectations right.
---


Morning Fall, Afternoon bounce back & a flat EODNIFTY 50 EOD ANALYSIS 10-12-21
In this post, I talk about the analysis for the day and the trading range for tomorrow. The video discusses with the help of the charts how the indices as well as leading stocks performed during the day and their likely play tomorrow.
O 17476.05
H 17534.35
L 17405.25
C 17511.30
EOD -5.55 points / -0.03%
SGX Nifty 10-12-21 @ 2000h = +46 points
FII DII = -706 Crores
CHART BASED CONCLUSIONS using 5 Minutes Chart
Nifty opened with a mild gap down and then sold off to test 17450 levels and then immediately bounced back and made high for the day and then met with the long standing resistance around 17540 and fell in a gradual manner.
In the process it made failed attempts to retest 17500 and then fell further towards 17400.
For almost an hour, Nifty could not make u its mind as there was an intense fight going on between the bulls and the bears around 17400 levels.
Eventually, bulls managed to win and made a sustained and steady recovery but failed to close above the previous close.
NIFTY WEIGHT LIFTERS & DRAGGERS
Top 5 Lifters contributed = 95
Top 5 Draggers contributed = 93
Net = +2
BANK NIFTY WEIGHT LIFTERS & DRAGGERS
Top 3 Lifters contributed = 97
Top 3 Draggers contributed = 88
Net = +9
POSITIVES
Nifty closed the week above 17500 and Bank Nifty above 37100. This is a good relief after seeing a lot of negativity in the last few days.
It is good to see non heavyweight stocks helping Nifty stay neutral and in case of Bank Nifty scrips like IDFC First Bank also putting in a great show.
The Advance-Decline ratio is around 60-40 which is good considering the fact that the market was quite choppy especially in the session up to 1300h.
NEGATIVES
FIIs keep selling and not sure when this is likely to stop.
HDFC twins and Kotak Bank kept the indices under pressure throughout the day.
Choppiness is prevalent in the market but India Vix is going down. This is a confusing situation and I view it as a negative for the traders.
The indices have made a lower high and Bank Nifty has also made a lower low.
TRADING RANGE FOR 12-17 Dec 21
Nifty Support = 17200-300 may well be the new base.
Nifty resistance = 17550-600-625-700-800
Bank Nifty Support = 36200-500-800
Bank Nifty resistance = 37200-500-700-38000
INSIGHTS / OBSERVATIONS
Here is my tweet posted in the morning related to Bank Nifty:
37000 was fought heavily by the bulls and bears in the last hour yesterday and the bulls just managed to win. Today, the bears did not allow the bulls to take it easy and 37000 became a hard line to sustain. However, today as well, the bulls managed to close the day above 37000 and at 37105 to be precise. This is a positive sign.
The first half till 1300h was very choppy for both the indices. India Vix was for sometime in the positive but as the indices started forming intraday base, it started falling. The recovery in indices was welcome, however, premium decays were seen in both the indices even on 37000 and 17500 CEs compared to the previous close as well the EOD prices.
I generally like situations where the deputy leader scrip rallies and supports the indices. It shows that as and when the big head is down, the deputy is capable enough to hold the fort. This was the case with TCS which overshadowed Infosys today.
What do you feel about this?
Here is the video link --
Thank you, and Happy Money Making!
Umesh
10-12-21
NOTE --
This write-up is not a prediction mechanism for the movement of Indices in the Indian markets as the markets are unpredictable in nature. I may refer to many data points in the article but I do not base my view on any of these standalone. In fact, I prefer to react to the price moves than predict the price moves. I also do not review Open Interest. Whatever data points I am using, are all stated in the article. The article title, as well as its contents, can at best be stated as --- This Is How I Read Nifty. I hope I have been able to set the expectations right.
---

ZOMATO short view zomato mcap of 1.5 L cr
a technical bearish aggressive scenario shall take place
as there are already enough peers against it and the craze of the same might fade away
and margins are shallow
i see stock moving south accordingly
