ENTERO: Trendline Breakout From IPO Base, Chart of The WeekFrom IPO Euphoria to Reality Check: Is Entero Healthcare Finding Its Footing at ₹1,000? Last Week, it broke the Trendline after Taking Support on the IPO base. Let's Understand in "Chart of the Week"
As per the Latest SEBI Mandate, this isn't a Trading/Investment RECOMMENDATION nor for Educational Purposes; it is just for Informational purposes only. The chart data used is 3 Months old, as Showing Live Chart Data is not allowed according to the New SEBI Mandate.
Disclaimer: "I am not a SEBI REGISTERED RESEARCH ANALYST AND INVESTMENT ADVISER."
This analysis is intended solely for informational purposes and should not be interpreted as financial advice. It is advisable to consult a qualified financial advisor or conduct thorough research before making investment decisions.
Price Action Analysis:
Overall Trend Structure:
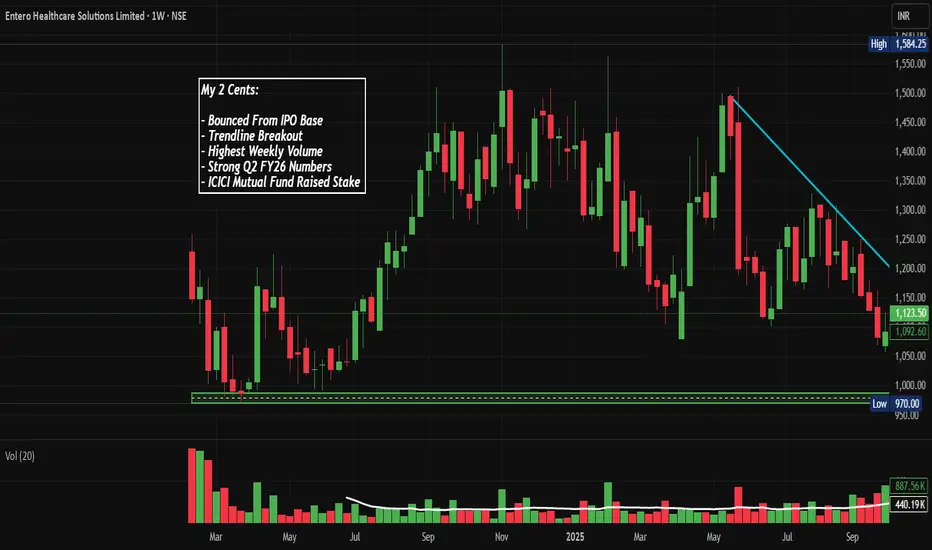
The stock exhibits a classic post-IPO distribution pattern that has transitioned into a prolonged corrective phase. After listing at premium levels, Entero Healthcare established an all-time high of around ₹1,584 in the early trading sessions. Since then, the stock has been in a consistent downtrend, forming a descending channel pattern characterised by lower highs and lower lows.
The current price action at ₹1,123 represents a potential inflexion point, with the stock attempting to reverse from its 52-week low of ₹944. This level has now been tested multiple times, suggesting it may be forming a demand zone.
Base Formation and Consolidation Zones:
A Critical IPO base zone around the ₹950-1,000 level represents the convergence of several technical factors:
- Initial Public Offering pricing memory
- Multiple tests of support over several weeks
- High volume accumulation zone
- Psychological round number support at ₹1,000
The stock spent considerable time between ₹1,100-1,300 during the mid-2025 period, forming what appears to be a distribution zone where early investors and IPO allocates likely exited positions.
Trendline Analysis:
A prominent downtrend line connects the series of lower highs from the peak at ₹1,584 down to current levels. This trendline has acted as dynamic resistance throughout the decline, with multiple failed breakout attempts. The angle of decline suggests aggressive selling pressure that has only recently started to moderate.
The recent price action shows the stock attempting to break above this multi-week downtrend line, which, if successful on sustained volume, could signal a trend reversal.
Current Price Structure:
Recent candlestick patterns show increasing buying pressure:
- Strong bullish candle with 17.95% gain, breaking above recent consolidation
- Price attempting to reclaim the ₹1,100-1,200 zone
- Reduction in selling pressure as evidenced by smaller-bodied bearish candles in recent sessions
Volume Spread Analysis:
Volume Profile:
The volume bar chart at the bottom reveals several critical insights:
Initial listing period showed extremely high volumes (approaching 3M shares), reflecting IPO excitement and allocation distribution. As the stock price declined, volume generally decreased, which is typical of a loss of interest and momentum.
Recent sessions have shown a notable pickup in volume, particularly:
- The current session is showing 2.17M shares traded
- This represents the highest weekly volume since the post-IPO period
- Volume spike coinciding with price bounce from the ₹944 low
Volume-Price Correlation:
The relationship between price and volume provides important context:
- Downtrend was accompanied by declining volume, suggesting weak conviction in the selling
- Recent bounce from ₹944 came with significant volume expansion, indicating institutional or informed buying
- The volume surge at support levels suggests accumulation rather than distribution
- Volume on up days is starting to exceed volume on down days, a positive divergence
Volume at Key Levels:
The IPO base around ₹1,000 has seen sustained high volume, creating a significant support zone. This volume cluster suggests that many participants have established positions at these levels and are likely to defend them.
Key Support and Resistance:
Major Support Levels:
Primary Support: ₹944 - This represents the 52-week low and has been tested multiple times. A breakdown below this level would be technically significant and likely trigger stop losses.
Secondary Support : ₹1,000 (IPO Base) - This psychological level and IPO reference point have provided support during multiple retests.
Tertiary Support: ₹1,100 - This level has acted as both support and resistance during the consolidation phase and represents a minor demand zone.
Major Resistance Levels:
Immediate Resistance: ₹1,200 - This level represents the recent consolidation zone ceiling and the lower boundary of the prior distribution range.
Primary Resistance: ₹1,300 - Strong resistance zone where the stock has repeatedly failed to sustain higher prices. This area coincides with multiple supply zones from earlier in the year.
Major Resistance: ₹1,400 - The upper boundary of the post-IPO distribution range. Breaking above this would negate the bearish structure.
Ultimate Resistance: ₹1,584 (All-Time High) - The peak was established shortly after IPO listing. A move to this level would represent a full recovery.
Downtrend Line Resistance:
The descending trendline connecting the highs currently intersects around the ₹1,150-1,200 zone. This dynamic resistance will need to be convincingly broken for the downtrend to be considered over. The current price action suggests this breakout may be in progress.
Major Technical Patterns:
Falling Wedge (Potential): In the most recent price action, there are early signs of a falling wedge pattern forming, characterised by converging trendlines as the stock makes lower lows with decreasing momentum. This is typically a bullish reversal pattern.
Double Bottom (Forming): The chart shows a potential double bottom pattern with lows around ₹944 separated by several weeks. This pattern would be confirmed on a break above ₹1,200 with volume.
Candlestick Patterns:
Recent price action displays several notable candlestick formations:
- Hammer candles at the ₹944 support level, indicating rejection of lower prices
- Doji candles during consolidation phases, showing indecision
- Today's strong bullish engulfing pattern suggests a momentum shift
- Decreasing size of bearish candles in the downtrend, showing exhaustion
Chart Pattern Implications:
The combination of these patterns suggests:
- Downtrend may be exhausting
- Support at ₹944 is holding firm
- Volume accumulation at lows indicates smart money positioning
- Breaking the downtrend line could trigger technical buying
- A confirmed reversal would target ₹1,300-1,400 initially
Fundamental and Sectoral Backdrop:
Company Overview:
NSE:ENTERO operates as a leading healthcare products distributor in India, ranking among the top three in the sector. Founded in 2018 by promoter Prabhat Agrawal, the company has rapidly scaled its operations through both organic growth and strategic acquisitions.
Business Model and Operations:
Core Business: Distribution and marketing of pharmaceutical and surgical products, including generic formulations, surgical consumables, medical devices, nutraceuticals, biosimilars, and hospital consumables.
Infrastructure: The company operates an extensive distribution network with 101 warehouses across 20 states, serving over 95,300 retail pharmacies and more than 3,600 hospitals.
Growth Strategy: Aggressive expansion through acquisitions. In FY2025 alone, the company acquired stakes in seven distribution entities, including 80% stakes in Avenir Lifecare and Gourav Medical Agencies, and the full acquisition of Suprabhat Pharmaceuticals and Devi Pharma Wellness.
Technology Edge: Utilises a proprietary technology platform for demand fulfilment and supply chain optimisation, positioning itself as a "Healthcare Supply Chain Solutions Specialist."
Financial Performance:
Revenue Growth: Demonstrated strong top-line growth with Q2 FY2025-26 showing 20.1% year-over-year growth and 11.8% quarter-on-quarter increase to ₹5,135 crores.
Market Capitalization: Currently around ₹4,888 crores
Profitability Journey: The company was loss-making from FY2021-2023 but turned profitable in FY2024. For the full year FY2025-2026, profit reached ₹107.43 crores, marking a significant turnaround.
Institutional Interest:
Recent institutional activity indicates growing confidence:
ICICI Prudential Mutual Fund acquired approximately 21.82 lakh shares at ₹950 per share in December 2025, signalling institutional confidence at current levels.
The acquisition was part of bulk deals, with a total transaction value of around ₹207.3 crores, showing significant institutional capital allocation.
This institutional buying coincides with the technical support zone, suggesting smart money accumulation at perceived value levels.
Sectoral Dynamics:
India's Healthcare Distribution Opportunity:
The Indian healthcare sector is experiencing transformative growth, valued at ₹31.87 lakh crores ($372 billion) in 2023 and projected to reach ₹54.67 lakh crores ($638 billion) by 2025, representing a 17.5-22.5% CAGR.
Healthcare spending is increasing from 3.3% of GDP to an expected 5% by 2030, driven by government initiatives, insurance penetration, and rising middle-class healthcare consumption.
Market Structure: The healthcare distribution sector in India remains highly fragmented, with consolidation opportunities. Entero's strategy of acquiring regional distributors aligns with this consolidation trend.
Growth Drivers:
- Expanding hospital infrastructure: Private hospitals adding 4,000+ beds with ₹11,500 crore investments in FY26
- Rising insurance penetration: Over 550 million Indians are now covered under health insurance schemes
- Tier 2 and Tier 3 city expansion: 55-60% of new hospital beds coming from secondary cities
- Ageing population: A Growing elderly demographic requiring chronic disease management
- Medical tourism: Expected to reach $14.31 billion by 2029
Competitive Positioning:
Strengths:
- Pan-India presence with an extensive warehousing network
- Authorised distributor for top pharmaceutical companies
- Strategic relationships with leading corporate hospital chains
- Technology-driven platform providing operational efficiency
- Aggressive growth through acquisitions in a fragmented market
Challenges:
- Capital-intensive business model requiring continuous working capital
- Thin margins are typical of distribution businesses
- Integration risk from multiple acquisitions
- Competition from established distributors and direct distribution by manufacturers
Credit Rating and Financial Health:
India Ratings affirmed Entero Healthcare's issuer rating at IND A-/Stable in December 2025, indicating adequate credit quality with a stable outlook.
Working Capital Intensive: A Significant portion of IPO proceeds (₹600 crores) is allocated for long-term working capital requirements, highlighting the capital-intensive nature of the business.
Strategic Outlook:
The company is well-positioned to benefit from several macro trends:
Healthcare Sector Consolidation: As the industry matures, organised distribution players like Entero will gain market share from fragmented local distributors.
Digital Health Integration: The digital health market is expected to grow at a 24.4% CAGR from 2025-2030, and Entero's technology platform positions it to capitalise on this trend.
Supply Chain Optimisation: Post-pandemic focus on resilient healthcare supply chains favours established distribution networks.
Rural Penetration: Government push for rural healthcare infrastructure creates distribution opportunities beyond metros.
Risk Factors:
Business Risks:
- High dependence on working capital financing
- Potential for inventory obsolescence in pharmaceutical distribution
- Regulatory changes in pharmaceutical pricing and distribution
- Competition from direct-to-pharmacy models by manufacturers
Financial Risks:
- Debt levels from acquisition financing
- Integration challenges from multiple acquisitions
- Margin pressure in a competitive distribution landscape
Key Metrics to Watch:
- EBITDA margin improvement from operational leverage
- Return on capital employed as brownfield expansions mature
- Working capital efficiency and cash conversion cycle
- Market share gains in key geographies
My 2 Cents:
Entero Healthcare is at a critical technical juncture, testing the boundaries of a months-long downtrend. The stock has established a strong support base around ₹944-1,000, coinciding with IPO pricing memories and significant institutional buying. Recent volume surge and price action suggest potential trend reversal, though confirmation requires a sustained break above ₹1,200.
The technical setup presents a balanced risk-reward for traders willing to use tight stops below ₹944, with initial upside targets of ₹1,300-1,400 if the reversal confirms.
From a fundamental perspective, Entero Healthcare operates in a structurally attractive sector with strong tailwinds. The company has demonstrated impressive revenue growth and recently achieved profitability. Its extensive distribution network and strategic acquisitions position it well for continued market share gains in a consolidating industry.
However, investors should note the capital-intensive nature of the business, integration risks from rapid acquisitions, and the need for sustained margin improvement to justify valuations.
The alignment of technical support with institutional buying at ₹950 levels and the strong sectoral backdrop creates an interesting setup. The stock appears to be transitioning from the IPO distribution phase to the potential accumulation phase. For position traders, the current levels offer an entry opportunity with defined risk below ₹944 and potential reward toward ₹1,300-1,400.
The key catalysts to watch include:
- Quarterly results demonstrating margin expansion
- Successful integration of recent acquisitions
- Sustained volume above ₹1,200 confirming trend reversal
- Further institutional accumulation
- Sector-wide tailwinds from healthcare spending growth
The convergence of technical base formation, institutional interest, and strong sectoral dynamics creates a compelling narrative, though investors should remain mindful of execution risks and maintain appropriate position sizing with stop losses.
Full Coverage on my Mid-Week Newsletter coming Wednesday.
Keep in the Watchlist and DOYR.
NO RECO. For Buy/Sell.
📌Thank you for exploring my idea! I hope you found it valuable.
🙏FOLLOW for more
👍BOOST if you found it useful.
✍️COMMENT below with your views.
Meanwhile, check out my other stock ideas on the right side until this trade is activated. I would love your feedback.
As per the Latest SEBI Mandate, this isn't a Trading/Investment RECOMMENDATION nor for Educational Purposes; it is just for Informational purposes only. The chart data used is 3 Months old, as Showing Live Chart Data is not allowed according to the New SEBI Mandate.
Disclaimer: "I am not a SEBI REGISTERED RESEARCH ANALYST AND INVESTMENT ADVISER."
This analysis is intended solely for informational purposes and should not be interpreted as financial advice. It is advisable to consult a qualified financial advisor or conduct thorough research before making investment decisions.
Ipobase
ROLEXRINGS: Trendline BO & IPO Base Bounce, Chart of the WeekFrom IPO Highs to back to IPO Base: Can Rolex Rings Break the Downtrend After 64% Crash?
After Promoter Buying and Decent Mangment Commentary Post Q2 FY26 Amid US Tariff, Let's Decode in This Week's "Chart of the Week"
As per the Latest SEBI Mandate, this isn't a Trading/Investment RECOMMENDATION nor for Educational Purposes; it is just for Informational purposes only. The chart data used is 3 Months old, as Showing Live Chart Data is not allowed according to the New SEBI Mandate.
Disclaimer: "I am not a SEBI REGISTERED RESEARCH ANALYST AND INVESTMENT ADVISER."
This analysis is intended solely for informational purposes and should not be interpreted as financial advice. It is advisable to consult a qualified financial advisor or conduct thorough research before making investment decisions.
Price Action:
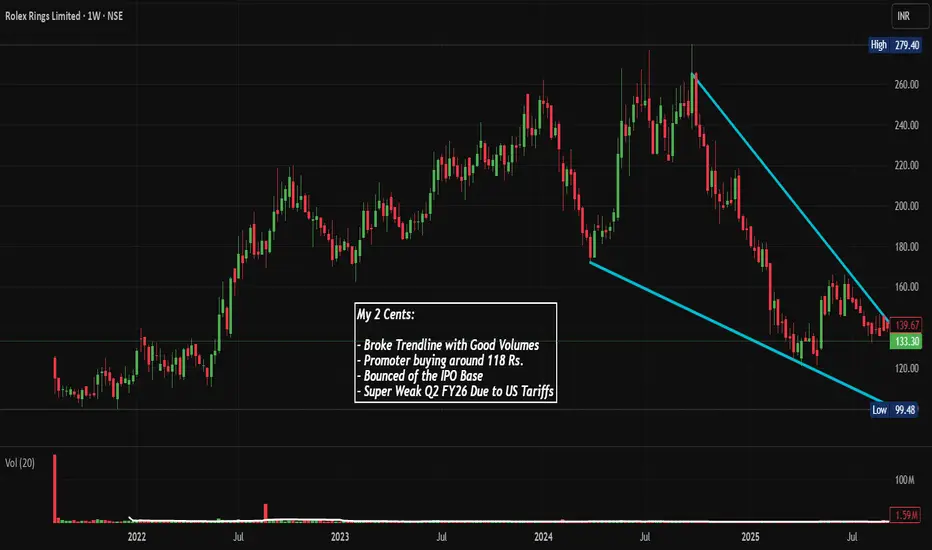
- The stock has witnessed a severe downtrend from its peak of approximately ₹280 in mid-2024 to a low of ₹99.48, representing a decline of approximately 64% from peak levels
- The chart displays a classic bearish trend characterized by lower highs and lower lows throughout 2024 and into 2025
- Price action shows the stock trading near its 52-week lows, with current price around ₹111 after bouncing from the ₹99.48 IPO Base
Trendline Analysis:
- A descending trendline has been drawn connecting the highs from mid-2024 through late 2025
- This trendline has acted as strong dynamic resistance, rejecting price advances multiple times
- The trendline currently extends downward toward the ₹100-110 zone, suggesting continued bearish momentum unless broken decisively
- The stock broke this trendline with good volumes recently, as evidenced by the spike in volume to 76.29M from an average of 6.23M.
Volume Spread Analysis:
- Average volume: 6.23M shares
- Recent surge: 76.29M shares (more than 12x average)
- Volume spike coincides with the trendline breakout attempt and bounce from lows
- This extraordinary volume surge suggests significant institutional or promoter buying interest
- Volume pattern shows accumulation at lower levels, which is a positive sign
- Higher volumes during bounce from support indicate strong conviction in buyers
Base Formation & Support Levels:
Key Support Zones:
- Primary Support (IPO Base): ₹98-120 zone - This was the IPO issue price and has historical significance as a psychological support level
- Immediate Support: ₹99.48 - The recent low established, which acted as a strong bounce point
- Secondary Support: ₹100 - Round number psychological support
- A potential base formation is emerging in the ₹99-120 range after months of decline
Resistance Levels:
- Immediate Resistance: ₹130-140 zone (previous support turned resistance)
- Intermediate Resistance: ₹160-170 (multiple rejections in this zone during the downtrend)
- Major Resistance: ₹180-200 zone (previous consolidation area)
- The descending trendline acts as dynamic resistance currently around ₹150-160
- Ultimate Resistance: ₹240-280 zone (peak highs from 2024)
Technical Patterns:
Descending Channel:
- The stock has been trading within a well-defined descending channel since mid-2024
- Lower boundary of channel approximately at ₹100, upper boundary following the drawn trendline
- Recent price action suggests potential channel breakout attempt
Double Bottom Formation (Potential):
- The chart shows a potential double bottom pattern forming around the ₹100 level
- First bottom at ₹99.48 (recent low)
- Second bottom would need to be confirmed near similar levels with higher low
- Neckline resistance would be around ₹140-150 zone
- This pattern, if confirmed, could signal trend reversal
Falling Wedge (Forming):
- The narrowing range between descending trendline and support suggests a falling wedge pattern
- Falling wedges are typically bullish reversal patterns
- Breakout above the trendline with volume could trigger significant upside
My Key Technical Observations:
- The stock has been in a sustained downtrend for approximately 18 months
- Recent price action shows signs of exhaustion at lower levels
- Trendline break with massive volume is a significant development
- The stock is oversold and due for a technical bounce
- Risk-reward ratio favors long positions from current levels with stop loss below ₹99
My Technical Outlook:
Bullish Case:
- Trendline breakout with exceptional volume
- Support holding at IPO base (₹118) and recent low (₹99.48)
- Potential reversal patterns forming
- Oversold conditions on longer timeframes
- Smart money accumulation evident from volume analysis
Bearish Case:
- Long-term downtrend still intact until sustained breakout
- Multiple resistance levels overhead
- Weak fundamental performance in recent quarters
- Sectoral headwinds persist
Sectoral and Fundamental Backdrop:
Company Overview:
NSE:ROLEXRINGS , headquartered in Rajkot, Gujarat, is among India's leading manufacturers of forged and machined bearing rings and automotive components in the private sector. The company boasts a forging capacity of 144,750 metric tons per annum (MTPA) and an annual machining capacity of 73 million pieces. It serves clients across India and 15 international markets spanning North America, Europe, and Africa.
Product Portfolio:
- Bearing Rings (approximately 45-47% of revenue): Ball bearing rings, cylindrical, tapered, and spherical types for automotive, railways, industrial, and wind turbine applications
- Automotive Components (approximately 53-55% of revenue): Transmission components (gear blanks, ring gears, sun and pinion, shafts), engine components (pulleys, cam lobes), chassis components (wheel hubs, Gen2 and Gen3 bearing components, output shafts, CVJ components), and exhaust system components
Sector Analysis: Auto Components Industry:
Industry Challenges (2025):
The auto components sector has faced significant headwinds through 2025, with demand moderation across passenger vehicles, commercial vehicles, and two-wheelers impacting component manufacturers. The sector is experiencing increased competitive intensity, with OEMs exerting pressure on suppliers to reduce costs while simultaneously demanding higher quality standards and faster delivery cycles.
Growth Drivers:
- Domestic automobile demand remains relatively robust
- Electric vehicle (EV) and hybrid segment growth (company derives 8% of FY25 revenue from this segment)
- China+1 strategy benefiting Indian manufacturers
- Localization push by global OEMs
Financial Performance Analysis:
Recent Performance (Q2 FY26):
Rolex Rings reported net sales of ₹271.38 crores in Q2 FY26, marking a 6.93% sequential decline from ₹291.58 crores in Q1 FY26 and a 9.62% year-on-year drop from ₹300.27 crores in Q2 FY25. Net profit declined 9.94% quarter-on-quarter to ₹44.34 crores from ₹49.16 crores in Q1 FY26.
Margin Pressure:
Operating margins (excluding other income) have declined from a peak of 22.89% in June 2024 to 20.21% in September 2025, a contraction of 268 basis points over five quarters. This margin compression reflects pricing pressures and unfavorable product mix shifts.
Profitability Metrics:
- PE Ratio: 19.97
- PB Ratio: 3.24
- ROE: 17.48% (latest quarter, down from historical average of 22.12%)
- ROCE: 26.44%
Key Fundamental Challenges:
US Tariff Impact:
While the company had previously guided for 14-16% top-line growth for FY26, management has now moderated this to "early teen growth" if US tariffs persist, with higher growth expected in FY27. The company notes that US customer-related volumes have slowed considerably until there is clarity on the final trade deal. However, there's a 25% US custom duty waiver in major portion of exports to US, effective from November 1, 2025.
Export-Domestic Mix:
- Exports: 51-52% of revenue
- Domestic: 48-49% of revenue
- Bearing rings export business facing subdued global demand, particularly in industrial segment
- Auto components export business showing resilience, especially in Europe and Mexico
Positive Developments:
Strong Order Book:
The company has Rs 1.75 billion of order inflows expected to flow from Q2FY26, which can be ramped up to Rs 2.5 billion in FY27. The management expects 15% blended growth for FY26 and 10% growth guidance for FY27.
Operational Excellence:
The significant EBITDA margin expansion in Q1FY26 to 26.5%, up from 21.9% in Q4FY25, demonstrates management's strong grip on cost control and operational efficiencies. The company has successfully commissioned a 9MW solar plant (expected to be operational by December 2025), adding to existing 17.08MW capacity, which aids margin improvement.
Balance Sheet Strength:
The company has transitioned to a net cash position from previous debt levels, demonstrating strong cash management. For FY26, management has guided a much lower capital expenditure of ₹30-35 crore, which can easily be funded by internal accruals.
Strategic Positioning:
Market Position:
Rolex Rings ranks top 5 amongst 130 active competitors in the forging and machining space. The company is benefiting from the China+1 theme, receiving improved traction from the US and Europe as an alternative to Chinese suppliers.
Customer Diversification:
The company is actively diversifying its customer base and expanding into value-added products for EVs/Hybrids which require complex machining and fetch approximately 200 basis points higher margins over standard offerings.
Strengths:
- Strong domestic market presence
- Diversified product portfolio across bearing rings and auto components
- Healthy order book visibility for FY26-27
- Improved operational efficiency and margin trajectory (when excluding tariff headwinds)
- Net cash position providing financial flexibility
- Competitive positioning in forging capacity
Risks:
- Export market volatility due to global trade tensions and tariffs
- Sustained margin pressure from OEM cost reduction demands
- Subdued growth in commercial vehicle and industrial segments
- High dependence on automotive sector cyclicality
- Revenue degrowth trend in recent quarters
Valuation Perspective:
At current levels around ₹111, the stock trades significantly below its historical highs and near book value. While near-term challenges persist, the long-term structural growth story of India's automotive sector, coupled with the company's strong market position and improving operational metrics, presents a compelling risk-reward opportunity for patient investors.
Management Outlook:
The company anticipates recovery in bearing rings business by Q3-Q4 FY26 and expects full recovery in export markets to take four to six quarters. The management remains confident about achieving EBITDA margins of 23.5-24% in FY26 and over 24% in FY27, supported by improved operational leverage, product mix enhancement, and benefits from renewable energy investments.
Full Coverage on my Newsletter this Week
Keep in the Watchlist and DOYR.
NO RECO. For Buy/Sell.
📌Thank you for exploring my idea! I hope you found it valuable.
🙏FOLLOW for more
👍BOOST if you found it useful.
✍️COMMENT below with your views.
Meanwhile, check out my other stock ideas on the right side until this trade is activated. I would love your feedback.
As per the Latest SEBI Mandate, this isn't a Trading/Investment RECOMMENDATION nor for Educational Purposes; it is just for Informational purposes only. The chart data used is 3 Months old, as Showing Live Chart Data is not allowed according to the New SEBI Mandate.
Disclaimer: "I am not a SEBI REGISTERED RESEARCH ANALYST AND INVESTMENT ADVISER."
This analysis is intended solely for informational purposes and should not be interpreted as financial advice. It is advisable to consult a qualified financial advisor or conduct thorough research before making investment decisions.
YATRA: Spectacular Recovery, Chart of the Week Post Q1 FY26From IPO Disaster to Cup & Handle Breakout: NSE:YATRA Spectacular Recovery Rally May Just Be Getting Started post Strong Q1 FY26 Numbers
As per the Latest SEBI Mandate, this isn't a Trading/Investment RECOMMENDATION nor for Educational Purposes; it is just for Informational purposes only. The chart data used is 3 Months old, as Showing Live Chart Data is not allowed according to the New SEBI Mandate.
Disclaimer: "I am not a SEBI REGISTERED RESEARCH ANALYST AND INVESTMENT ADVISER."
This analysis is intended solely for informational purposes and should not be interpreted as financial advice. It is advisable to consult a qualified financial advisor or conduct thorough research before making investment decisions.
Price Action Analysis:
Chart Pattern Identification:
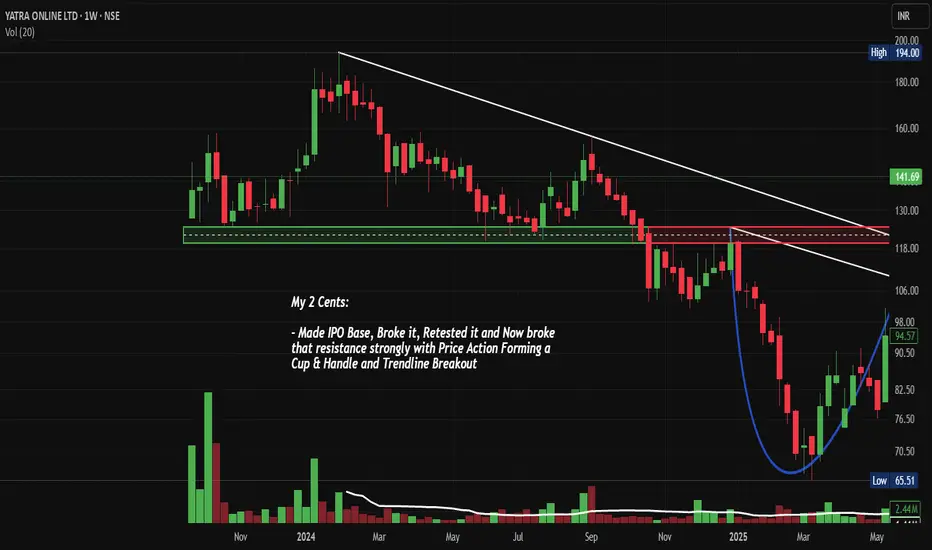
- Primary Pattern: Cup & Handle Formation (Bullish Reversal Pattern)
- Cup formation period: March 2024 to May 2025
- Handle formation: May 2025 to July 2025
- Breakout confirmation: August 2025 with strong volume spike
Key Price Levels:
- IPO Base Level: ₹125-130 (Initial listing range)
- All-Time High: ₹194.00 (Early 2024 peak)
- Major Support Levels:
- ₹118 (Cup base/IPO resistance turned support)
- ₹106 (Handle low)
- ₹90-95 (Previous resistance cluster)
- Major Resistance Levels:
- ₹160 (Next logical resistance)
- ₹180-185 (Pre-ATH resistance zone)
- ₹194 (All-time high)
Trend Analysis:
- Long-term Trend: Bullish reversal after prolonged downtrend
- Medium-term Trend: Strong bullish momentum post-breakout
- Short-term Trend: Consolidating after breakout with bullish bias
Volume Spread Analysis:
Volume Characteristics:
- Breakout Volume: Exceptional surge to 134.47M (significantly above average)
- Volume Confirmation: Strong institutional participation is evident
- Historical Volume Pattern: Low volume during handle formation followed by breakout explosion
Volume Spread:
- Volume surge indicates genuine breakout with institutional backing
- Previous accumulation phase visible during cup formation
- Current volume levels suggest sustained interest
Key Support & Resistance:
Dynamic Support Levels:
- Immediate Support: ₹125-130 (Breakout level/IPO base)
- Secondary Support: ₹118 (Cup rim level)
- Critical Support: ₹106 (Handle low - stop loss reference)
Resistance Levels:
- First: ₹160 (38.2% retracement from ATH)
- Second: ₹180-185 (Pre-ATH consolidation zone)
- Ultimate: ₹220-240 (Cup & Handle measured move)
Technical Indicators & Patterns:
Classical Patterns:
- Cup & Handle: Completed with successful breakout
- Rounding Bottom: Visible in the cup formation
- Ascending Triangle: Formed during handle consolidation
Key Technical Observations:
- Price action shows strong momentum post-breakout
- Previous IPO resistance at ₹125-130 now acting as support
- Breakout occurred with a gap-up opening, indicating strong sentiment
Sectoral Backdrop:
Online Travel Industry Overview:
- India Online Travel Market expected to reach USD 23.10 billion in 2025 and grow at a CAGR of 7.76% to reach USD 33.90 billion by 2030
- Online travel booking service market in India expected to reach projected revenue of US$57,924.4 million by 2030 with a CAGR of 10.6%
- India's travel industry is valued at $178 billion, fueling economic growth with travel stocks offering lucrative investment opportunities
Market Position:
- Yatra Online Ltd. was identified as one of the major companies operating alongside MakeMyTrip, EaseMyTrip, and Cleartrip
- Strong competitive position in a growing market
- Recovery phase post-pandemic showing robust growth trajectory
Fundamental Backdrop:
Financial Metrics:
- Market Cap: 2,223 Crore, Revenue: 900 Cr, Profit: 49 Cr (TTM)
- Promoter Holding: 64.46% (Strong management commitment)
- Trading at 2.84 times book value at 45.8 times P/E
Operational Assessment:
- The company has a low return on equity of 2.90% over the last 3 years
- Profitability achieved, indicating operational efficiency improvement
- Revenue growth trajectory supported by sector tailwinds
Growth Lever:
- Beneficiary of India's domestic tourism boom
- Digital transformation in travel booking
- Post-pandemic recovery in the travel sector
- The government's focus on tourism development
Market Outlook & Catalysts:
Positive Catalysts:
- Travel & Tourism market in India projected to grow by 8.07% (2025-2029)
- Increasing domestic travel penetration
- Corporate travel recovery
- Digital adoption acceleration
Key Risk Factors:
- Intense competition from larger players
- Seasonal business variations
- Economic slowdown impact on discretionary spending
- Regulatory changes in the travel sector
Key Monitoring Points:
- Sustained holding above the ₹125 breakout level
- Volume sustainability in the coming sessions
- Broader market conditions and sector rotation
- Company's Next Few quarterly results and guidance updates.
Full Coverage on my Newsletter this Week
Keep in the Watchlist and DOYR.
NO RECO. For Buy/Sell.
📌Thank you for exploring my idea! I hope you found it valuable.
🙏FOLLOW for more
👍BOOST if you found it useful.
✍️COMMENT below with your views.
Meanwhile, check out my other stock ideas on the right side until this trade is activated. I would love your feedback.
As per the Latest SEBI Mandate, this isn't a Trading/Investment RECOMMENDATION nor for Educational Purposes, it is just for Informational purposes only. The chart data used is 3 Months old, as Showing Live Chart Data is not allowed according to the New SEBI Mandate.
Disclaimer: "I am not a SEBI REGISTERED RESEARCH ANALYST AND INVESTMENT ADVISER."
This analysis is intended solely for informational purposes and should not be interpreted as financial advice. It is advisable to consult a qualified financial advisor or conduct thorough research before making investment decisions.
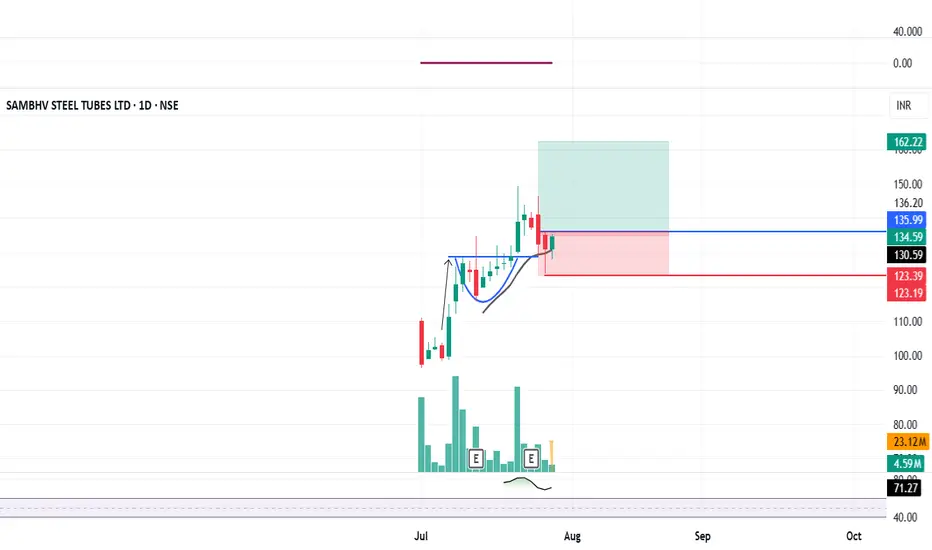
SAMBHV: IPO Base Breakout + Retest done#SAMBHV #ipostock #breakoutstock #trendingstock #swingtrading
SAMBHV : Swing Trading
>> Breakout & Retest done
>> Trending stock
>> Good Strength & Volumes
>> Low Risk High Reward Trade
Swing Traders can lock profits at 10% & Keep Trailing
Pls Comment , Boost and Follow for more such Analysis
Disc : Charts shared are for Learning Purpose and not a Trade recommendation, Consult your Financial advisor or a SEBI Registered Advisor before taking position in it.
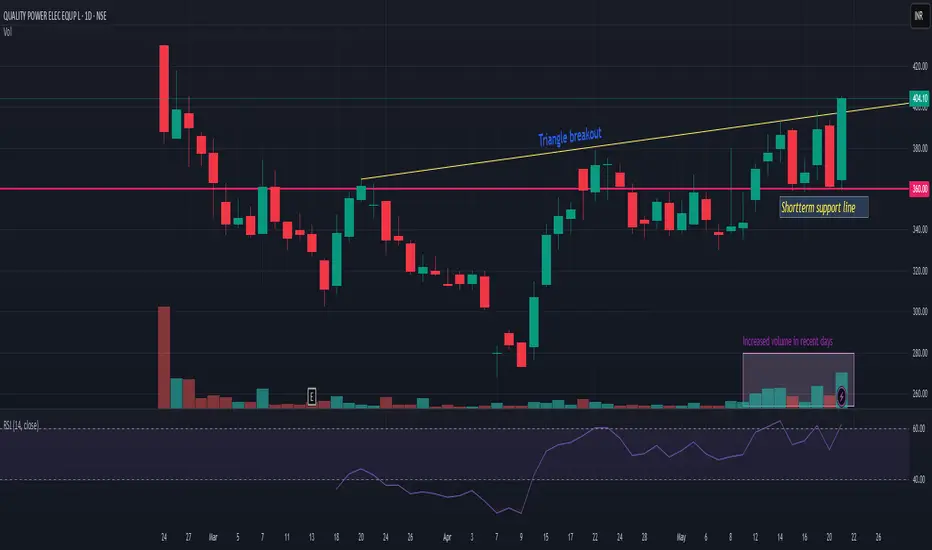
QPOWERQPOWER is recently listed IPO stock and now it has given triangle breakout with decent volume. 355-60 is very strong support. Closing below this may change my view. Upper side we may see momentum till 470-510. Risk reward is quite favorable. Another thing which i observed is today it is trading at all time high volume after listing day. So probability of holding and continuing momentum is quite high. keep it on radar.
Senores Pharmaceuticals IPO Base BreakouAnalysis: Senores Pharmaceuticals
Structure: IPO Base Breakout 🌟
Entry: Above ₹610 (preferably on a closing basis)
Stop Loss (SL): ₹499 (Closing Basis) ❗
SL Percentage: -18.20% 📉
Target Levels:
T1: ₹849 (+39.18%) 🎯
Risk-to-Reward (R:R): 1:2.15 ⚖️
Technical Highlights:
📌 Volume Surge: Today's volume is 2x-3x higher than previous sessions, indicating strong interest.
📌 Price Action:
Candle traded right at the All-Time High (ATH) but didn’t close above it.
Pharma sector is holding up despite the broader market correction.
📌 Market Condition:
Risky Setup: Trading against the trend as Nifty remains below 200 DMA and 50 DMA.
Overall market structure is still weak, increasing the probability of a big fall.
Key Strategy:
⚡ Buy Small Quantity: At breakout levels; wait for a potential retest to add more.
⚡ Position Sizing is Key: Due to the deep SL, risk management is crucial.
⚡ Discipline Required: Avoid emotional trading in such setups.
Risks:
1️⃣ Nifty Weakness: Broader market correction can weigh on individual stocks.
2️⃣ Trend Reversal: Pharma sector performance is not guaranteed to sustain in this correction.
💬 Trade Safe and Stay Disciplined!
⚠ Disclaimer: This analysis is for educational purposes only and does not constitute financial advice. Always consult with a qualified financial advisor before making any investment decisions.

Transraill. Aiming for IPO Base Breakout. Transraill is aiming for a breakout from it's IPO base. 605 are crucial.
-Entry 605. Safe Traders Wait for a close above this level.
-SL 562 Closing Basis.
Lot of newly listed companies are showing promises. I will try to post the charts later.
This is apt as a positional pick and better to add it in parts. Wait for the breakout to sutain and then wait for a retest.
Position Sizing and risk management should be proper.

Vishal Megamart. All Set for IPO base Breakout?
Vishal Megamart
Entry Zone:The stock has broken above the resistance level of ₹115.00, marking the entry point as it closes higher on a bullish day. This indicates strong momentum.
Stop Loss (SL):A standard stop-loss level is set at ₹107.68 (purple line). This ensures protection in case of price reversal.
There is an additional closing basis SL at ₹99.67. This is a deeper stop-loss for more conservative traders, offering room for price fluctuation.
Volume Analysis:The breakout is accompanied by higher-than-average volume, which validates the bullish move. Increasing volume often signals genuine buying interest.
Trend:The recent candles show a steady uptrend with higher highs and higher lows, supporting a bullish continuation.
Potential Upside:The breakout above resistance opens the possibility of further upside if the stock sustains this level. Watch for potential resistance at higher levels, possibly around ₹120–₹125 (psychological and technical zones).
Trading Plan:
Entry: As suggested, ₹114.00 or near the closing price.
Stop Loss: ₹107.68 (traders) or ₹99.67 (investors).
Target: A logical next resistance level can be identified for booking partial profits or trailing SL to lock gains.
Risks:
False Breakout: Ensure the stock sustains above ₹115.00 for confirmation.
Market Conditions: Broader market sentiment can impact this trade, so stay cautious of volatility.

Sinclair Hotels Ltd. – IPO Base Breakout in Progress.Sinclair Hotels Ltd. – IPO Base Breakout in Progress 🏨
Key Insights:
1️⃣ Breakout Potential:
The stock is testing the April 2024 resistance level and is on the verge of an IPO base breakout.
A confirmed entry above ₹138.5, preferably after a day-close confirmation, strengthens the setup.
2️⃣ Volume Surge:
Recent sessions have witnessed 5x volume spikes, indicating strong institutional or retail interest, which adds credibility to the breakout attempt.
3️⃣ Fundamentals:
Solid ROE (Return on Equity) and ROCE (Return on Capital Employed) metrics highlight financial strength.
However, as a microcap, it requires extra caution due to potential volatility.
Trading Strategy:
Primary Setup:
Entry: Above ₹138.5 (post a daily close confirmation).
Stop Loss (SL): ₹117 (Closing Basis).
Target Zones: Medium-term upside could be significant, depending on momentum post-breakout.
Risk Management:
Position sizing is critical, given the stock's microcap nature, which may result in sharp moves.
Key Notes for Traders:
Watch for volume confirmation during the breakout attempt. Sustained high volumes would validate the move.
Be mindful of broader market conditions, as microcaps are particularly susceptible to bearish sentiment.
Sinclair Hotels Ltd. presents an exciting breakout opportunity for those willing to embrace calculated risk. Patience is key—let the stock confirm its strength!
And please, as always, Do your research. Enter only if you understand the risk. GoodLuck!

KROSS - Ready For IPO Base BreakoutKROSS - Ready For IPO Base Breakout
Price is consolidating tightly near resistance zone, indicating reduced selling pressure and potential for a breakout. ₹225-₹230 serves as the breakout level.
Volume Trends:
Volume decreased during the handle formation, showing healthy consolidation.
Expect an increase in volume on a breakout above ₹230 to confirm the move.
Targets:
Based on the cup's depth, the potential upside can be projected at ₹270, ₹300, and ₹330 as key resistance levels.
Entry Point:
A confirmed breakout above ₹230 with high volume would signal an entry.
Stop Loss:
Place a stop loss below ₹210, which is slightly below the handle's lower boundary, ensuring a favorable risk-reward ratio.

KROSS : IPO Base Breakout Soon#Kross #breakoutstock #breakoutsoon #breakoutcandidate #trendingstock
KROSS : IPO Base Breakout Soon
>> Good Base formation
>> Entry on Closing Above GAP Area
>> Good Strength & Volumes Building up
>> Trending setup
>> High Probability Trade
Swing Traders can lock 10% profit & keep trailing
Note : In the current Market Scenario even the best of Trading setup's can fail so Trade only Good setup's with proper Risk Management, set of rules for Stop-loss & proper position sizing.
Please give a Boost or comment if u r Liking the analysis & Learning from it. Keep showing ur Love by following
Disclaimer : This is not a Trade Recommendations & Charts/ stocks Mentioned are for Learning/Educational Purpose. Do your Own Analysis before Taking positions.

AEROFLEX : IPO Listing Day High Broken#AEROFLEX #breakout #vcpsetup #vcppattern #IPOstock
AEROFLEX : Swing Trade
>> IPO Listing Day High Broken
>> VCP Formation
>> Good Strength & Volumes
>> Upside Potential min 25-30 %
Swing Traders can lock 10% profit & keep trailing
Note : In the current Market Scenario even the best of Trading setup's can fail so Trade only Good setup's with proper Risk Management, set of rules for Stop-loss & proper position sizing.
Please give a Boost or comment if u r Liking the analysis & Learning from it. Keep showing ur Love by following
Disclaimer : This is not a Trade Recommendations & Charts/ stocks Mentioned are for Learning/Educational Purpose. Do your Own Analysis before Taking positions.

IPO Base strategies.Ipo based breakouts always works good when it breaks the first day high,
but while trading such stocks we need to keep watch on the movement of the stock when it breaks the high.
if breakout don't sustain it can leads to lose.
and if it sustains there is high probability of good returns in few days.
This is just my own opinion, trade using your own strategies and risk.

IPO Base strategies.Perfect retest after breakout is the best indicator for good bullish move of the share.

IPO BASE TRADE 📌SWING TRADE FOR NEXT WEEK🚀
Hello Traders⚡
I am a Swing Trader by Passion i only trade on Momentum Stock's.
📌I Post Daily SWING CHARTS Analysis on My Trading view profile..
So let's Start
📌TRADE ANALYSIS OF ------------
• Potential Breakout Chart
• IPO BASE TRADE
• Short Range Consolidation
• Price Can Take Retest from support Line
• Overall The Price Is Moving In HH-HL Formation
• Volume Buildup Near BO Zone
• Looks Good For 10-20% Upside Levels After The Breakout
📌 If you have any questions about any stock you can comment on post 📱
📌Disclaimer:-
This all charts analysis are only for educational purposes only
I do not provide any CALL or Tips

BREAKOUT IN INDGN📌SWING TRADE FOR NEXT WEEK🚀
Hello Traders⚡
I am a Swing Trader by Passion i only trade on Momentum Stock's.
📌I Post Daily SWING CHARTS Analysis on My Trading view profile..
So let's Start
📌TRADE ANALYSIS OF -INDGN-
• Potential Breakout Chart
• IPO BASE TRADE
• Short Range Consolidation
• Price Can Take Retest from support Line
• Overall The Price Is Moving In HH-HL Formation
• Volume Buildup Near BO Zone
• Looks Good For 10-20% Upside Levels After The Breakout
📌 If you have any questions about any stock you can comment on post 📱
📌Disclaimer:-
This all charts analysis are only for educational purposes only
I do not provide any CALL or Tips

BREAKOUT IN IXIGO📌SWING TRADE FOR NEXT WEEK🚀
Hello Traders⚡
I am a Swing Trader by Passion i only trade on Momentum Stock's.
📌I Post Daily SWING CHARTS Analysis on My Trading view profile..
So let's Start
📌TRADE ANALYSIS OF IXIGO
• Potential Breakout Chart
• IPO Base Trade
• Short Range Consolidation
• Price Can Take Retest from support Line
• Overall The Price Is Moving In HH-HL Formation
• Volume Buildup Near BO Zone
• Looks Good For 10-20% Upside Levels After The Breakout
📌 If you have any questions about any stock you can comment on post 📱
📌Disclaimer:-
This all charts analysis are only for educational purposes only
I do not provide any CALL or Tips

BREAKOUT IN WTICAB📌SWING TRADE FOR NEXT WEEK🚀
Hello Traders⚡
I am a Swing Trader by Passion i only trade on Momentum Stock's.
📌I Post Daily SWING CHARTS Analysis on My Trading view profile..
So let's Start
📌TRADE ANALYSIS OF -WTICAB-
• Potential Breakout Chart
• IPO base Trade
• Short Range Consolidation
• Price Can Take Retest from support Line
• Overall The Price Is Moving In HH-HL Formation
• Volume Buildup Near BO Zone
• Looks Good For 10-20% Upside Levels After The Breakout
📌 If you have any questions about any stock you can comment on post 📱
📌Disclaimer:-
This all chatrs analysis are only for educational purposes only
I do not provide any CALL or Tips

IPO BASE BREAKOUT IN CHAVDAHello Traders⚡
I am a Swing Trader by Passion i only trade on Momentum Stock's.
📌I Post Daily SWING CHARTS Analysis on My Trading view profile..
So let's Star 📌SWING TRADE FOR NEXT WEEK🚀
t
📌TRADE ANALYSIS OF CHAVDA
• Potential Breakout Chart
• IPO BASE TRADE
• Short Range Consolidation
• Price Can Take Retest from support Line
• Overall The Price Is Moving In HH-HL Formation
• Volume Buildup Near BO Zone
• Looks Good For 10-20% Upside Levels After The Breakout
📌 If you have any questions about any stock you can comment on post 📱
📌Disclaimer:-
This all chatrs analysis are only for educational purposes only
I do not provide any CALL or Tips

IPO BREAKOUT IN BLSEHello Traders⚡
I am a Swing Trader by Passion i only trade on Momentum Stock's.
📌I Post Daily SWING CHARTS Analysis on My Trading view profile..
So let's Star 📌SWING TRADE FOR NEXT WEEK🚀
t
📌TRADE ANALYSIS OF BLSE
• Potential Breakout Chart
• IPO BASE TADED
• Short Range Consolidation
• Price Can Take Retest from support Line
• Overall The Price Is Moving In HH-HL Formation
• Volume Buildup Near BO Zone
• Looks Good For 10-20% Upside Levels After The Breakout
📌 If you have any questions about any stock you can comment on post 📱
📌Disclaimer:-
This all chatrs analysis are only for educational purposes only
I do not provide any CALL or Tips

JLHL / Jupiter Life Line - 4 months consolidation / IPO Base BOJupiter Life Line Hospitals Ltd
1) Time Frame - Weekly.
2) The Stock has been in a consolidation since (September, 2023). Now It has given a breakout & Closed at it's All Time High with good bullish momentum in weekly time frame.
3) It's an IPO Base Breakout. The stock may reach the target of 1400 in the short term. Good fundamentals.
4) Recommendation - Strong Buy

BREAKOUT IN IREDA📌SWING TRADE FOR NEXT WEEK🚀
Hello guys,
I am a swing trader by passion i only trade on swing stocks.
📌I post daily SWING CHARTS analysis on my trading view profile..
so let's start
📌TRADE ANALYSIS OF IREDA :-
•Breakout of VCP pattern
•Price in Tightness
•Volume increases build-up
•Bullish trend/ make good structure also
•Made good price action
•Make higher highs/higher lows
📌 If you have any questions about any stock you can comment on post 📱
📌Disclaimer:-
This all chatrs analysis are only for educational purposes only
I do not provide any CALL or Tips

Sigachi Industries (IPO Base Breakout)Sigachi Industries is giving IPO base breakouts on the weekly and monthly charts. Closing above 63.40 every week can open gates for 77, 93, and 107 levels. Also, a rounding bottom structure has formed on the weekly and monthly charts.
Disclaimer: I am not a SEBI registered analyst. All the stocks are for educational purposes. Investors must consult a financial advisor before making any investment. It is not a buy or sell recommendation.
