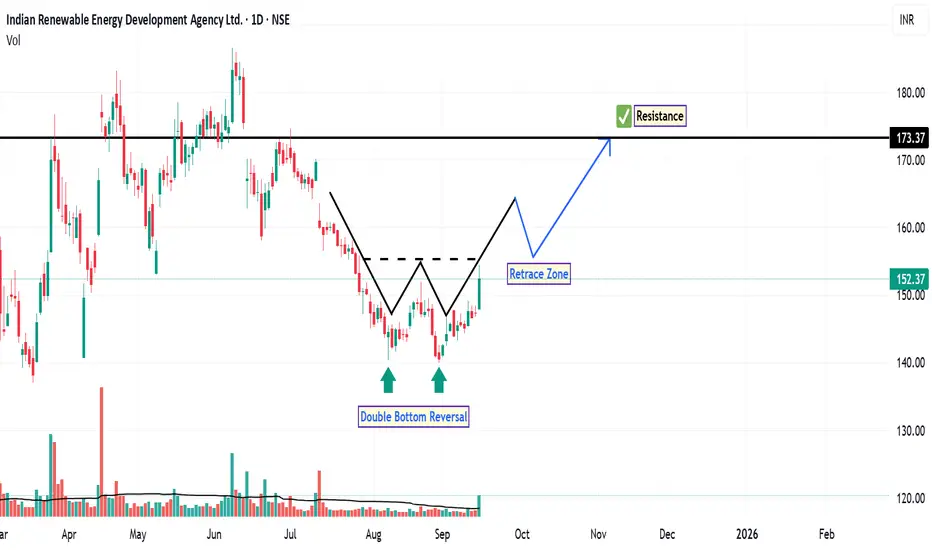
IREDA: Double Bottom in PlayOn the daily time frame, the chart of IREDA has recently displayed a double bottom reversal pattern , a classic technical formation often associated with a potential shift from bearish to bullish sentiment. This pattern, marked clearly on the chart, suggests that buyers may be stepping in at a previously defended price level.
In the preceding downtrend, the stock failed to establish a new low and instead broke above a prior swing high, indicating a CHoCH in market structure. This shift is typically interpreted by technical analysts as a transition from bearish to bullish momentum.
The RSI is currently above 60 , approaching the overbought zone. While this suggests strong buying interest, it also warrants caution as price may be nearing short-term exhaustion. However, in trending markets, RSI can remain elevated for extended periods. Additionally, the stock has managed to close above both the 20-day and 50-day EMAs, accompanied by increased volume, which adds credibility to the bullish setup. These moving averages often act as dynamic support levels and trend confirmation tools.
Based on this technical structure, the next potential resistance levels are identified near ₹160, followed by ₹173 . A technical stop-loss level could be considered at a daily close below ₹140 , which aligns with the double bottom support zone.
Disclaimer: This analysis is intended solely for educational and informational purposes. It does not constitute investment advice or a recommendation to buy, sell, or hold any financial instrument. Market conditions are subject to change, and trading decisions should be made based on individual research, risk tolerance, and consultation with a licensed financial advisor.
IREDA
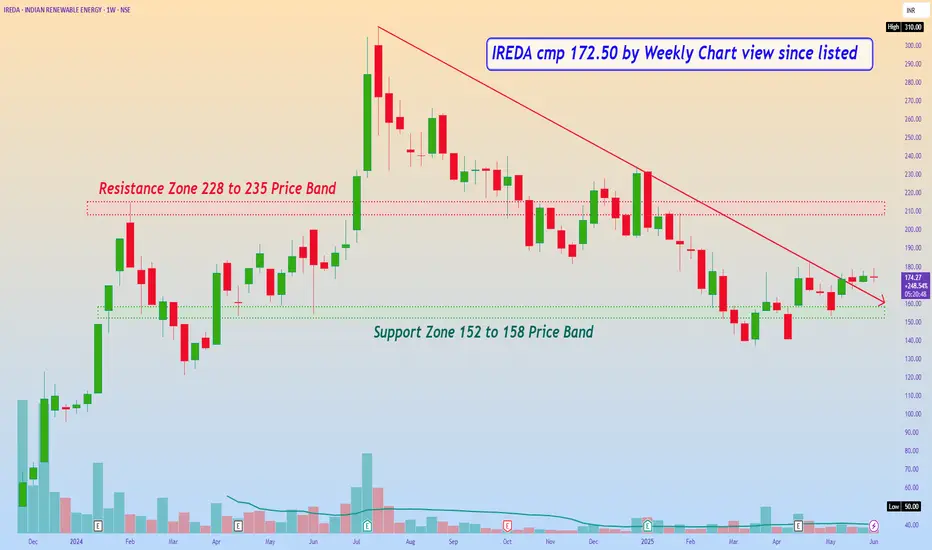
IREDA cmp 172.50 by Weekly Chart view since listedIREDA cmp 172.50 by Weekly Chart view since listed
- Support Zone 152 to 158 Price Band
- Resistance Zone 228 to 235 Price Band
- Stock Price sustained above Support Zone after a good test retest
- Subject to good Volumes increase happens it maybe a slow upside move to observe
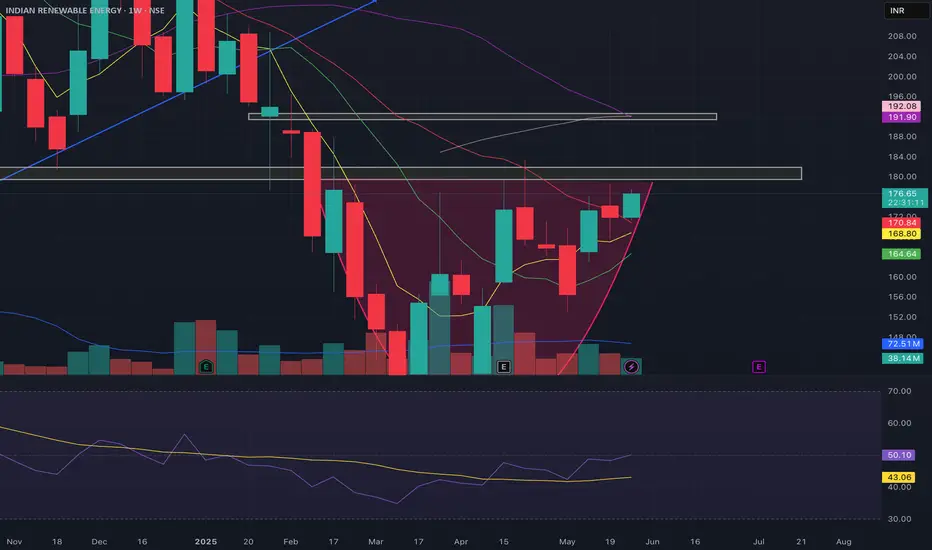
IREDA all set to give a 10% upsideCUP formation in W.
RSI divergence gaining strength.
Presently at resistance of 180.
CMP 176, TGT 193 SL: 160
IREDA - a Good Buy!IREDA can be a good buy from this till 200 levels for swing trade for the month of January, 2025.
Disclaimer -
1- I am not a Financial Advisor
2- This is only for educational purpose.
3- I am not responsible for any of your trades .
4- Your profits or loss are not my responsibility its on your own risk completely .
5- I simply share my views towards Market , So before taking trade consult your personal Financial Advisor .

IREDA - Positional target 300-> CMP 222 / 1d timeframe
-> Breaking out the channel trend
-> Bouncing from the support line
-> Crossing 20/50/100 EMA
-> Positional target will be 300
-> Good Luck, Traders!

Indian Renewable Energy Development Agency- Breakout OpportunityDate : 5-Dec-2024
LTP : Rs. 220.86
Targets: (T1) Rs. 265 --> (T2) Rs. 310 --> (T3) Rs. 389
SL : Rs. 183
Technical View:
• NSE:IREDA was going through it's primary downtrend since 15-Jul-2024.
• After touching the high of 310 on 15-Jul-2024, it has retraced 41% to 181.40 level.
• NSE:IREDA has breakout from it's primary downtrend with higher than average volume.
• NSE:IREDA is trading above 20 DEMA and 50 DEMA since last couple of sessions.
• RSI is in buy zone and trading at 62.74. MACD has crossed 0 line on 5-Dec-2024 and trading at 1.19.
• Looking good to start an upward journey from here.
Liked the analysis? Boost/Like this idea and follow my ID.
Disclaimer: I am not a SEBI registered analyst/consultant and not recommending anyone to take any BUY or SELL position in stock market. Investing in stock market is risky and one should do a self analysis and validation before investing in stock market. My ideas are published for learning purpose only and are available to everyone at no cost/charge.

IREDA up side move possiblenear the price 200 will be the best entry point in IREDA
Investment opportunity
price moving in parallel channel now going down
i thing possible to hit near swing highs and have potential to go all time high
good fundamental stock

IREDA -INVESTMENT OPPORTUNITY IREDA is down 15-20% from it's high but it's financials are strong.
Price action on charts also trying to say it can move upside but confirmation will be when price test it's previous resistance and hold that levels and break resistance.
If this price action is formed on charts then price will move towards its major resistance.

KPI GREEN IS LOOKING BULLISHKPI GREEN is looking strong at current market price as this area giving strong support to the buyers. Also price rejected multiple times from this area. All views are my personal

*IREDA cmp 232.19 by Daily Chart view since it is listed**IREDA cmp 232.19 by Daily Chart view since it is listed*
- Stock hit ATH 310.00 on Monday 15-Jul-2024
- Symmetrical Triangle breakout done and sustained
- 228 to 235 Resistance Zone been Tested and Retested
- Volumes pretty flat need to increase by good quantity
- Support at 221 > 207 > 194 with Resistance at 242 > 255 > 268
- *Price closure above Resistance Zone for few days will fresh upside momentum*

IREDA - Ready To Bounce From Support🔊 IREDA - Ready To Bounce From Support
IREDA - INDIAN RENEWABLE ENREGY
⌛Duration - Short Term (3 month to 5 month)
📊📈 Trade Logic - Bouncing from Long Term Support Area
CMP - ₹232.37
Time Frame - Weekly
🎯Target 1 : ₹260
🎯Target 2 : ₹280
🎯Target 3 : ₹300
🛑 Stop : ₹210/₹220
🏆 Risk/Reward Ratio (1: 2.5)
Disclaimer: The stock information shared here is not a recommendation to buy, sell, or hold. It reflects my own analysis and is intended solely for educational purposes. Any actions you take based on this information are your responsibility, and the admin of this channel is not liable for any financial gains or losses. Please consult a financial advisor before making any investment decisions. I am not a SEBI-registered advisor.

IREDA Completes Wave4, Strong reversal to be seen towards 400🚨#StrongReversal on #IREDA 🚀
CMP: 230
High: 310
✅Wave 4 Complete on #ElliottWave, Reversal Begins at 230
🎯Targets: range between 360 and 426
📈MACD and RSI show a reversal.

IREDA Shorterm pattern In shorter IREDA showing impulsive movement
Wave 1 retraced to 78.6%
Wave3 attained 161.8%
Wave 4 retraced 38.2% may go to 50% , price movement above around 270 , can show unmoved forming 5th wave.
Elliott wave analysis
Open for any suggestions and reviews.

IREDA ( going to shoot up ); 2024- best pick; min 100% ROIMay be going to became "Hot stock - 2024"
Fundamentally good stock,
Good For short term/ long term investment in cash market'.
Leave a " Like If you agree ". 👍
.
.
Enter only after breaking & close above " Yellow box" mentioned.
'
'
Don't make complicated trade set-up.📈📉
Keep it " simple, focus on consistency💹
Refer our old ideas for accuracy rate🧑💻
Valuable comments are welcomed-✌️
.
Refer old ideas attached below🧲
Follow for regular updates👍

IREDA - PIVOT buy point triggered for swing trade#IREDA
~ Stock bouncing back from 10 MA support
~ Looks strong for swing trade
~ Expected level to watch - 280, 290
#SWINGTRADE

Indian Renewable Energy Development Agency- Breakout OpportunityDate : 29-Jul-2024
LTP : Rs. 266
Next Resistances: (1) Rs. 310 --> (2) Rs. 358
SL : Rs. 232 on daily close basis
Technical View:
• NSE:IREDA is in it's primary uptrend and was recently going through it's secondary downtrend.
• After touching the high of 310 on 15-Jul-2024, it has retraced 25% to 232 level.
• On 29-Jul-2024, NSE:IREDA has broke out from its secondary down trend.
• NSE:IREDA is trading above 21 DEMA, 20 DMA and 50 DMA.
• RSI is trading in buy zone at 60.95.
• MACD is trading at 17.48.
• Looking good to start a new swing from here.
Disclaimer : I am not a SEBI registered analyst/consultant and not recommending anyone to take any BUY or SELL position in stock market. Investing in stock market is risky and one should do a self analysis and validation before investing in stock market. My ideas are published for learning purpose only and are available to everyone at no cost/charge.

IREDA Analysis!NSE:IREDA Analysis on a Daily Timeframe!
Triangle Pattern Formation in IREDA!
Triangle Pattern Breakout in IREDA!
Analysis:
As we can see the stock in moving in a triangle since December 2023. It was continuously consolidating in it. On 27th June it tried breaking out the resistance but unable to sustain above the resistance. Today again it has been successfully given the breakout and able to close above the breakout. As i marked all the important levels on the chart please have a look.
Trade Setup:
Entry = Current price level is good to Enter
Key Level = 214.80 This is the All Time High Level, Price may reverse from this level but if it breaks, will the major uptrend
Target = 455.85
Stop Loss = Below 173 or as per your Risk To Reward
Disclaimer = Consider my analysis for Educational Purpose only.
Before entering into any trade -
1) Educate Yourself
2) Do your research and analysis
3) Define your Risk to Reward ratio
4) Don't trade with full capital

Indian Renewable Energy Development Agency- Breakout OpportunityDate : 6-Jun-2024
Rating : Buy - Positional Trade
LTP : Rs. 178.30
Targets: (1) Rs. 200 --> (2) Rs. 214 --> (3) Rs. 229
SL : Rs. 158 on daily close basis
Technical View:
• NSE:IREDA is in its primary uptrend and was recently going through it's secondary downtrend.
• After touching the high of 200.25 on 3-Jun-2024, it has retraced 23% to 154 level.
• On 6-Jun-2024, NSE:IREDA has broke out from its secondary down trend with high volume.
• RSI is trading at 50.95 and MACD is trading at 2.67.
• Looking good to start a new swing from here.
Disclaimer : I am not a SEBI registered analyst/consultant and not recommending anyone to take any BUY or SELL position in stock market. Investing in stock market is risky and one should do a self analysis and validation before investing in stock market. Ideas are published for learning purpose only.

Indian Renewable Energy Development Agency- Breakout OpportunityDate : 14-May-2024
Rating : Buy - Positional Trade
LTP : Rs. 173.15
Targets: (1) Rs. 185 --> (2) Rs. 214
SL : Rs. 154 on daily close basis
Technical View:
• NSE:IREDA is in its primary uptrend and was recently going through it's secondary downtrend.
• After touching the high of 192.20 on 29-Apr-2024, it has retraced 17% to 158.70 level.
• On 14-May-2024, NSE:IREDA has broke out from its secondary down trend with high volume.
• NSE:IREDA has also closed above 20 DMA and 21 DEMA on 14-May-2024.
• RSI is trading at 56.16 and MACD is trading at 3.07.
• Looking good to start a new swing from here.
Disclaimer : I am not a SEBI registered analyst/consultant and not recommending anyone to take any BUY or SELL position in stock market. Investing in stock market is risky and one should do a self analysis and validation before investing in stock market. Ideas are published for learning purpose only.

IREDA - Indian Renewable Energy Development Agency Ltd.Date : 3-Apr-2024
Rating : Buy - Positional Trade
LTP : Rs. 157.20
Targets: (1) Rs. 163 --> (2) Rs. 185 --> (3) Rs. 214 --> (4) Rs. 272
SL : Rs. 140
Technical View:
• NSE:IREDA is moving in down trend since 6-Feb-2024.
• After touching the life time high of 214.80 on 6-Feb-2024, it has retraced 44% to 121.05 level.
• NSE:IREDA has broke out from its down trend on 3-Apr-2024 with higher than average volume.
• RSI has crossed over 50 on 2-Apr-2024. MACD is about to crosse over 0.
• Looking good to start a new uptrend from here.
Disclaimer : I am not a SEBI registered analyst/consultant and not recommending anyone to take any BUY or SELL position in stock market. Investing in stock market is risky and one should do a self analysis and validation before investing in stock market.

IREDA RESISTANCEThis stocks momentum is high right now due to the overall renewable energy momentum.

IREDA trade set-upNSE:IREDA has been a darling of traders since listing and now it is following a very beautiful trendline. Traders can keep this line as a stop loss and can continue riding as long as it holds it. IREDA is a PSU which finances green projects and also recently got a Narvratna status.

IREDA NEAR BREAK OUT OF VCPIREDA
Rally - Base - Rally price action
1.First Rally, then forming Base in the VCP pattern (Volatility contraction) & then again expected Rally after break out of the neck line.
2. Close above previous day High(170.4)
3. Close above last week High(169.7)
4. Close above last month High(163.7)
4. High increase in 1 month (+21.2%)
8. Promoter holding 75.00%
9. Pledged percentage 0.00 %
10. Change in Prom Hold 0.00%
11. FII holding 1.36%
12. Chg in FII Hold -0.52 %
13. DII holding 0.94 %
14. Chg in DII Hold -3.43 %
15. Stock PE 36.6
16. Industry PE 17.1
17. ROCE 9.35 %
18. ROE 17.3 %
For Educational Purpose Only
