NIFTY 1D Time frame📊 Current Data
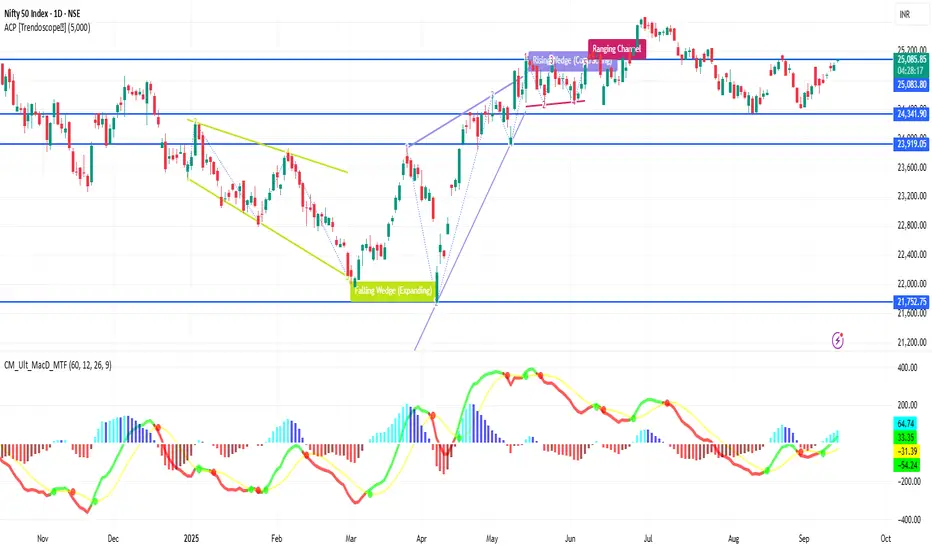
Current trading level: around 25,076 – 25,091
Today’s range: approx. 25,038 – 25,095
52-week range: 21,743 – 26,277
🔑 Key Daily Levels
Resistance Zones
25,090 (near-term resistance just above current trading)
25,153 (recent swing high, major resistance level)
Support Zones
24,994 – 24,950 (immediate support range)
24,800 (strong support zone; crucial for trend continuation)
📉 Trend View
Bullish Case: If NIFTY sustains above 25,090 and breaks 25,153, it could push higher towards 25,200+.
Bearish Case: If it fails to hold 24,950–24,994 and slips below 24,800, downside momentum could strengthen.
Neutral Zone: Between 25,000 – 25,050, NIFTY may consolidate before deciding direction.
IRTC
MARUTI 1D Time frame📍 Current Price Action
Last traded price: ~₹ 15,096
Minimal intraday change (~0.1%, slightly up)
⚙ Technical Indicators
RSI (14): ~72 → strong uptrend / overbought conditions
Stochastic RSI: Low / showing weakness → possible cooling off
CCI (14): ~92 → uptrend strength
MFI (Money Flow Index): ~84 → strong buying pressure
📊 Moving Averages & Trend Strength
Price is above 50-day and 200-day SMAs & EMAs → long-term trend is bullish
20-day SMA/EMA are more neutral-to-slightly bullish
All major moving averages are broadly supporting upwards bias
🔧 Support & Resistance / Pivot Zones
Support Levels: ~₹ 14,900 – ₹ 15,000
Resistance Levels / Pivot: ~₹ 15,300 – ₹ 15,500
🧠 Summary
Maruti is in a strong uptrend on the daily chart. Overbought indicators like RSI and MFI suggest buying strength is high, which also means risk of a short-term pullback or consolidation. Key support ~₹ 15,000 needs to hold for bulls. If price clears resistance near ₹ 15,300-15,500 convincingly, upward move likely to continue.

SENSEX 1D Time frame📍 Current Price Action
Current Level: 81,548
Day’s Range: ~80,320 – 81,550
52-Week Range: 71,425 – 85,978
⚙ Technical Indicators
RSI (14): Around 43 → neutral to slightly bearish zone
MACD: Negative → mild downward pressure still visible
ADX (14): ~35-40 → moderate trend strength
Stochastic Oscillator: Near overbought zone → possible short-term pullback
Moving Averages:
Short-term (5, 10, 20-day): Mixed
Medium & long-term (50, 100, 200-day): Acting as resistance near highs
📊 Key Levels
Immediate Support: 80,800 – 81,000 zone
Immediate Resistance: 81,600 – 81,800 zone
Breakout Levels:
Above 81,800 → upside momentum could target 82,200+
Below 80,800 → downside may test 80,300 – 80,000
🧠 Summary
Sensex is currently at 81,548, near its resistance zone. Trend is neutral to mildly bullish in the short-term. Sustaining above 81,600–81,800 will confirm strength for further rally. A failure to hold could trigger a pullback toward 80,800–80,300.
