ITC 4H Kijun Failure: Is the Downtrend Louder Than the Dividend?The dividend adjustment is complete — price action now carries the final verdict .
On the 4H chart, ITC attempted a Kijun reclaim but failed to gain acceptance. The probe above equilibrium was sold into, followed by compression and a delayed but decisive close back below Kijun. Weekly price action remains under the Kumo , keeping HTF bias firmly bearish.
As long as price fails to close above 324.75 on a 4H basis (high of the reclaim attempt), the bearish structure remains intact.
Downside reference zones: 307.6 → 303.6 → 298.5 → 293.0
Bottom line:
The dividend narrative has faded. The structure hasn’t.
ITC

ITC - WyckoffITC – Weekly Wyckoff Distribution (Schematic #2) in Play
ITC’s weekly structure appears to be unfolding as a Wyckoff Distribution – Schematic #2, suggesting a transition from demand dominance to supply control.
Key observations from the chart :
Preliminary Supply (PSY) marked the first sign of large supply entering after a strong uptrend.
Buying Climax (BC) followed by an Automatic Reaction (AR) confirmed the start of a trading range.
Secondary Test (ST) failed to make new highs, indicating weakening demand.
Upthrust (UT) and subsequent Lower Highs (LPSY) signal repeated absorption of demand by smart money.
Recent breakdown below the range indicates Sign of Weakness (SOW) and confirms Phase D/E behavior.
📉 Implication:
The structure favors distribution completion, with risk skewed to the downside unless price reclaims the prior range convincingly.
📌 Key levels to watch:
Breakdown area as resistance
Major demand zone near ₹277–₹262 (weekly support)
This is a reminder that time spent at the top often precedes the move down.

ITC Limited - EW AnalysisITC Limited Complete analysis in EW theory now in correction phase of super cycle degree expected correction minimum fib retrace of wave1 38.2 % (Super cycle degree) already 30% over so expected reversal possible at 320-280 price level good opportunity for long term Investors and traders

ITC – Sell on Rise | Major Support Zone Ahead📉 ITC – Sell on Rise | Major Support Zone Ahead
Stock: ITC Ltd
Timeframe: Daily
Trend: Bearish (Short-term)
🔍 Technical Analysis
ITC has decisively broken all major support levels, indicating a clear shift in market structure from sideways to bearish. The recent breakdown is accompanied by weak price action, suggesting sellers are in control on rallies.
Post breakdown, the stock is now below key moving averages and struggling to reclaim lost support zones, confirming a sell-on-rise structure.
🔻 Trend Structure
Breakdown of multiple supports
Lower highs formation on daily timeframe
Pullbacks likely to face selling pressure
🔻 Volume Behavior
Breakdown occurred with expanding volumes
Indicates distribution, not panic selling
Any bounce without volume likely to fail
🟢 Strong Buy Support Zone (High Probability Demand Area)
📍 ₹280 – ₹295 zone
This zone is technically important due to:
Fibonacci 0.50 retracement level
Anchored VWAP support
Prior price acceptance area
This zone is expected to act as a strong demand zone where buyers may attempt a reversal or consolidation.
🧠 Trading Plan
🔹 Sell on Rise
Look for rejection signals near broken supports
Avoid fresh longs above resistance until structure improves
🔹 Buy Only at Support
Aggressive longs only if strong price reaction is seen in ₹280–₹295 zone
Look for:
Bullish reversal candle
Volume expansion on bounce
Failure of price to sustain below VWAP
⚠️ Risk Management
Avoid positional longs until price reclaims key resistances
Keep strict stop loss below support zone if attempting counter-trend longs
This is a zone-based trade, not blind buying
📌 Conclusion
ITC remains bearish in the short term and is best approached with a sell-on-rise strategy. A meaningful buying opportunity may emerge only near the ₹280–₹295 strong support zone, supported by Fibonacci 0.50 and Anchored VWAP confluence.
📉 Trade the trend. Respect levels. Manage risk.

Possible support levels for ITCExpecting ITC to hit the mentioned levels for a potential reversal as RSI is sloping downwards and there is Negative news in market the mentioned levels can be used for potential long term investing but only after doing your own research, this is not a buy or sell recommendation
#ITC

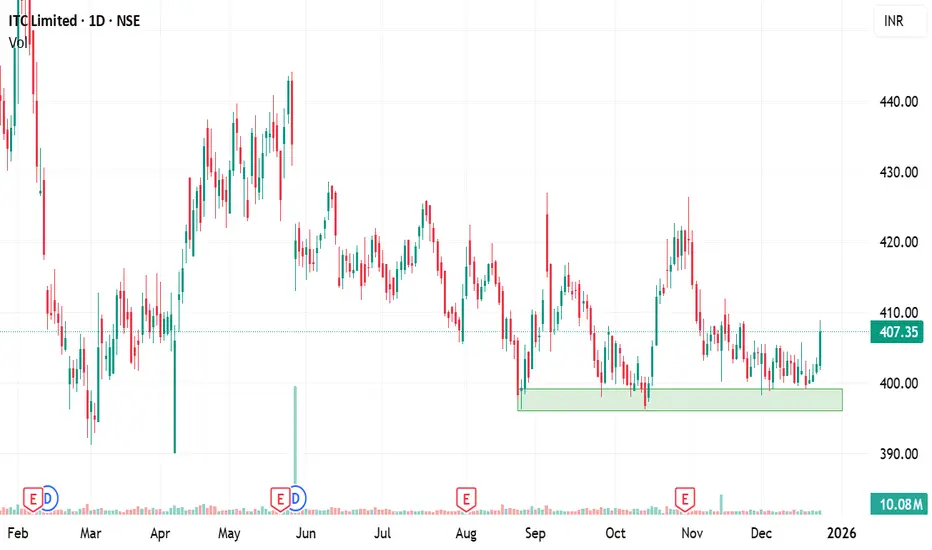
ITC – Technical SetupITC is showing a strong technical structure near the ₹400–₹395 zone, which is acting as a solid support area on the charts. The stock has tested this zone multiple times and has managed to hold, indicating strong demand at lower levels.
Over the last several sessions, ITC was trading in a tight consolidation range, reflecting accumulation. Today’s close above this multi-day consolidation is a positive sign and suggests a potential breakout, with momentum now shifting in favor of the bulls.
The price action indicates that buyers are gaining control, and as long as ITC sustains above the breakout level and the support zone remains intact, the setup looks favorable for an upside move.
Trade Plan:
Buy: As close as 395
Stop Loss: ₹395
Target: ₹425
A close below ₹395 would weaken the structure, so strict stop-loss discipline is advised.
Trade with proper risk management.
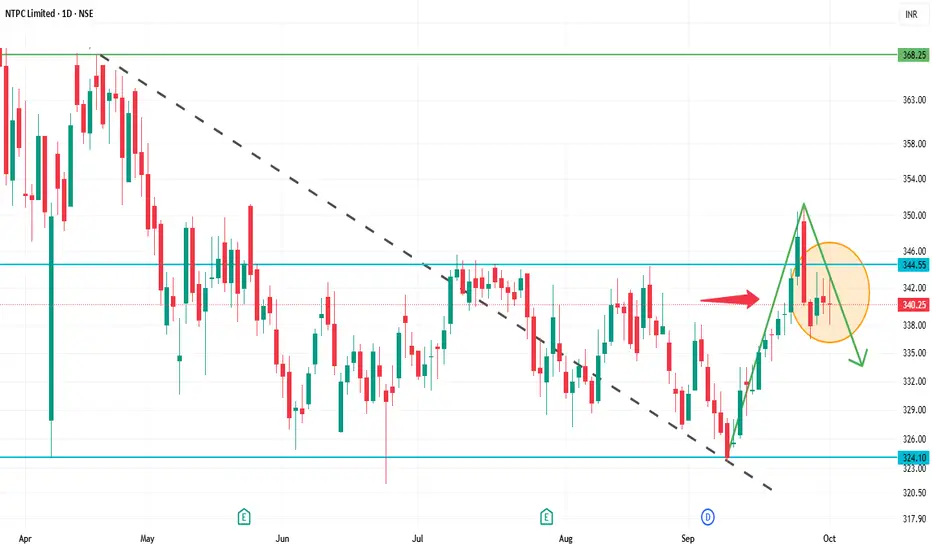
NTPC 1D Time frameCurrent Snapshot
Current Price: ₹340.25
52-Week High: ₹447.75
52-Week Low: ₹292.80
Strategy & Outlook
Bearish Bias: The stock is in a short-term downtrend with negative momentum indicators.
Selling Opportunity: Consider selling near resistance zones (₹343–₹345) with a target towards ₹335–₹340.
Risk Management: Place stop-loss orders above the resistance levels to manage potential upside risks.
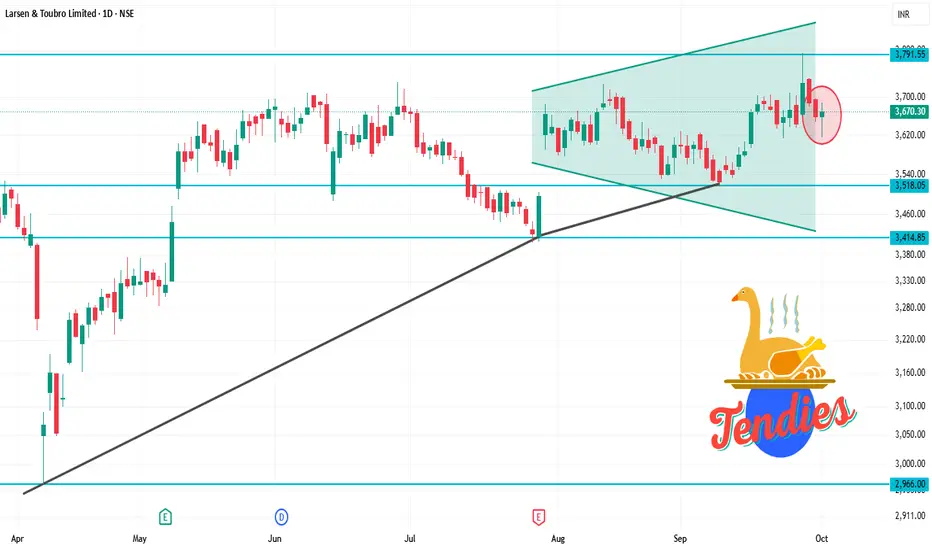
LT 1D Time frameCurrent Snapshot
Current Price: ₹3,670.30
52-Week High: ₹3,963.50
52-Week Low: ₹2,965.30
Strategy & Outlook
Bullish Bias: The stock is in a short-term uptrend with positive momentum indicators.
Buying Opportunity: Consider entering near support zones (₹3,600–₹3,650) with a target towards ₹3,700–₹3,750.
Risk Management: Place stop-loss orders below the support levels to manage potential downside risks.
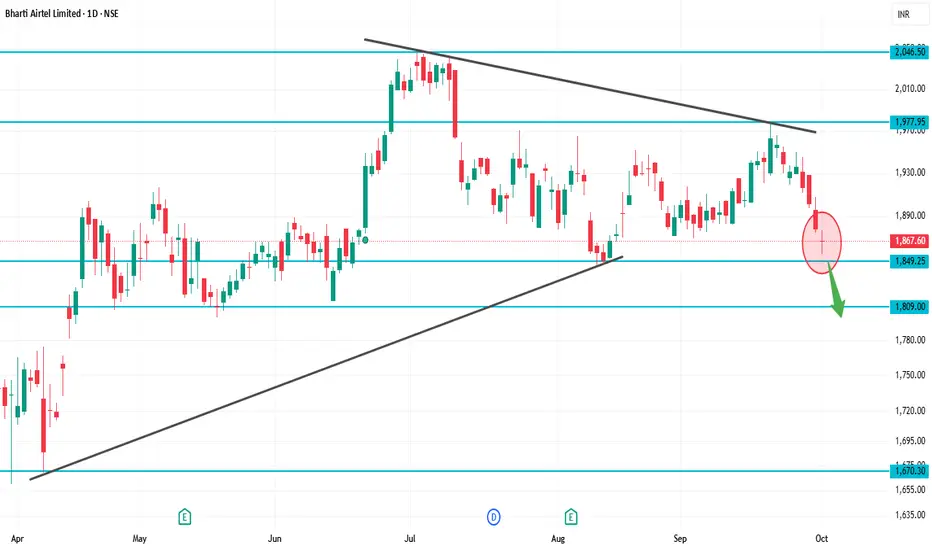
BHARTIARTL 1D Time frameCurrent Price: ~₹1,867
52-Week High: ~₹2,045
52-Week Low: ~₹1,511
Explanation
At ₹1,867, Airtel is just above immediate support (₹1,840–1,850).
If buyers hold this support, stock may bounce back toward ₹1,900+.
But if ₹1,840 breaks, then downside may open toward ₹1,800–1,750.
For bulls, a clean breakout above ₹1,920–2,000 is needed for fresh rally.
BRITANNIA 1D Time frameCurrent Price: ~₹5,953.50
Day’s Range: ₹5,939.50 – ₹6,036.00
52-Week Range: ₹4,506.00 – ₹6,469.90
📏 Key Levels
Immediate Resistance: ~₹6,300
Next Resistance: ~₹6,470 (52-week high)
Immediate Support: ~₹5,800
Next Supports: ~₹5,600 and ₹5,300
🧠 Insights
If Britannia breaks above ₹6,300 with volume, it may push toward ₹6,470+ (new highs).
If it fails to break resistance, expect sideways movement or a pullback toward ₹5,800.
A break below ₹5,800 would signal weakness and can drag it down toward ₹5,600–₹5,300 levels.

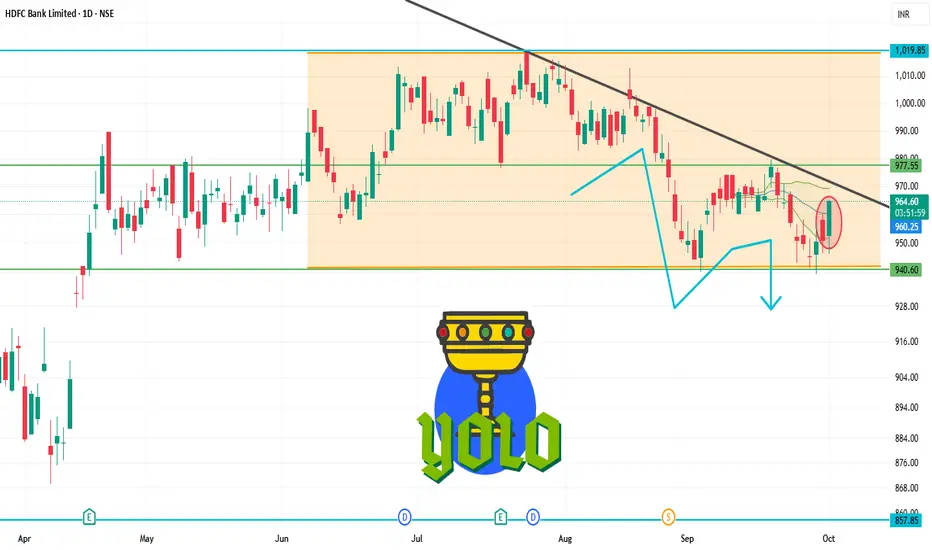
HDFCBANK 1D Time frameOpening Price: ₹950.30
Closing Price: ₹960.45
Day Range: ₹946.00 – ₹961.40
Previous Close: ₹950.30
🧠 Price Action Insights
The stock is trading below key moving averages, confirming the bearish trend.
No significant reversal pattern has formed, suggesting the downtrend may continue.
Watch for a breakout above ₹970.00 for a potential trend reversal.
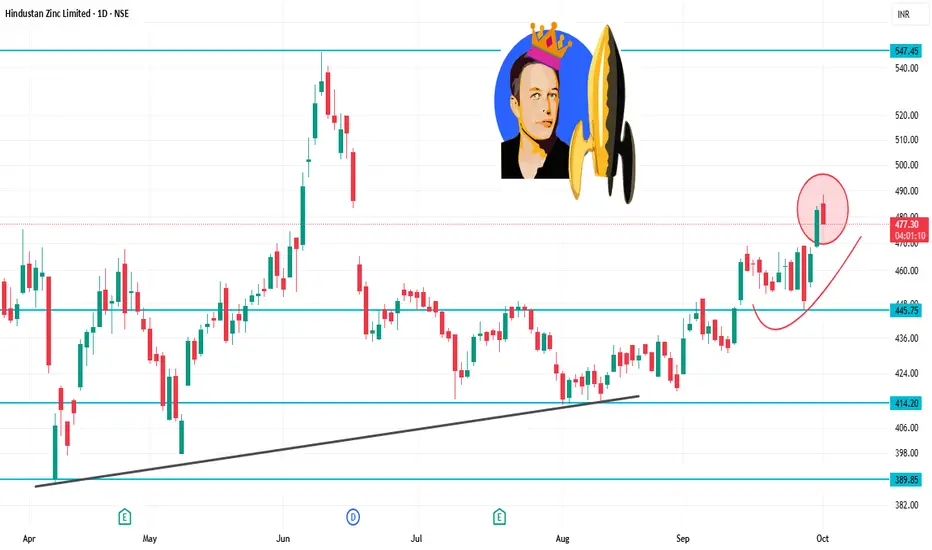
HINDZINC 1D Time frameDay Range: ₹478.35 – ₹488.40
52-Week Range: ₹378.15 – ₹575.40
Volume: 284,459 shares traded
📉 Trend Analysis
The stock is in a downtrend, characterized by:
Lower highs and lower lows.
Failure to break above resistance levels.
The short-term trend remains bearish.
🔮 Conclusion
Hindustan Zinc is in a downtrend with weak momentum.
Break below ₹470.00 could lead to further decline toward ₹460.00.
Break above ₹495.00 would indicate a potential trend reversal.
HEROMOTOCO 1D Time frame📌 Current Status
Closing Price: ₹5,410
Day Change: –35 points (–0.64%)
Day’s High: ₹5,470
Day’s Low: ₹5,380
52-Week Range: ₹4,800 – ₹6,050
🔍 Chart & Price Action Insights
Price is moving sideways, bouncing between support and resistance.
Bulls are defending ₹5,380
Sellers resist above ₹5,470
Watch for a break above ₹5,470 for potential upward momentum
Break below ₹5,380 may trigger a short-term decline toward ₹5,330

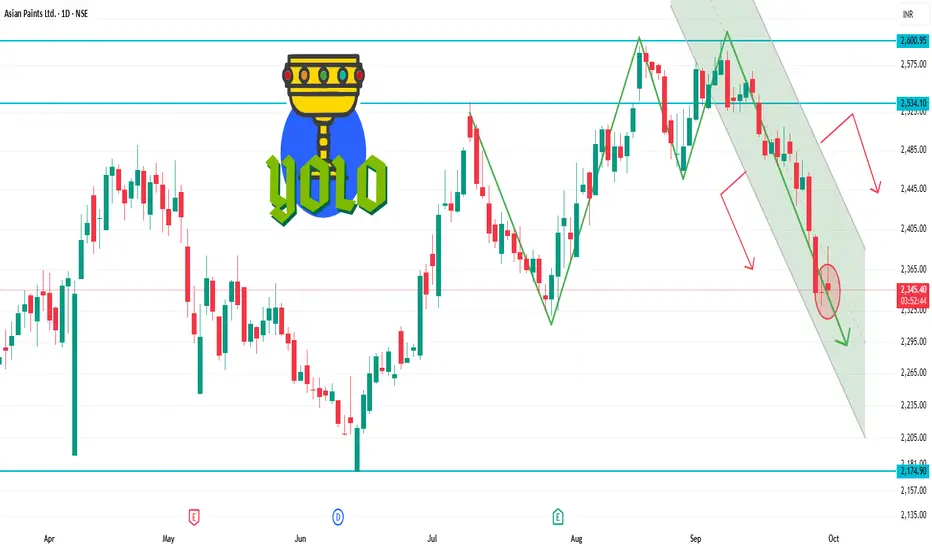
ASIANPAINT 1D Time frameCurrent Price Snapshot
Current Price: ₹2,345.50
Day’s Range: ₹2,342.00 – ₹2,388.80
52-Week Range: ₹2,124.75 – ₹3,358.00
Technical Indicators
RSI (14-day): 44.19 — indicates a neutral to slightly bearish momentum.
MACD: -4.010 — suggests bearish momentum.
Moving Averages:
5-day: ₹2,396.00 — indicates a Sell signal.
50-day: ₹2,389.00 — indicates a Sell signal.
200-day: ₹2,350.00 — indicates a Neutral signal.
Technical Summary: Predominantly Sell signals across various indicators.
Summary
Above ₹2,388.80: Potential rise toward ₹2,400 – ₹2,420.
Below ₹2,342.00: Potential fall toward ₹2,320 – ₹2,300.
Between ₹2,300 – ₹2,380: Likely range-bound movement.
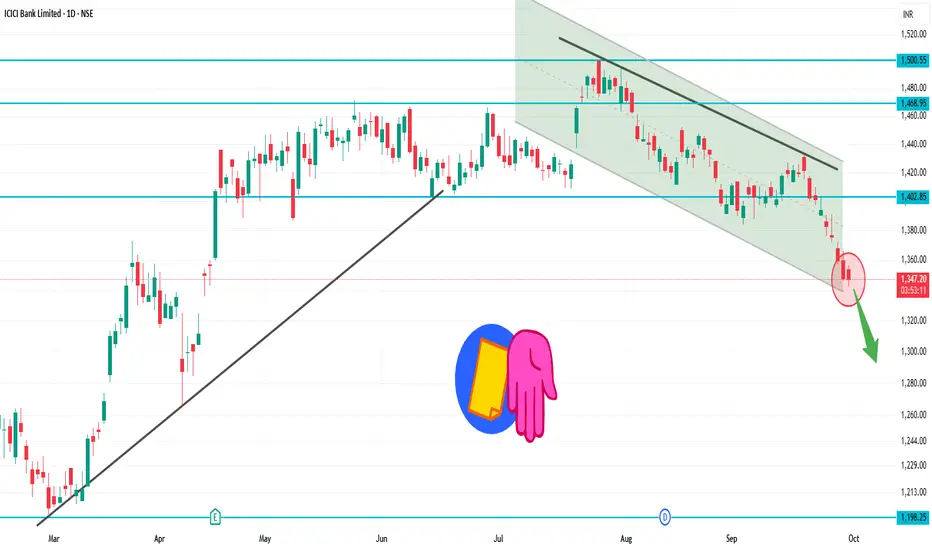
ICICIBANK 1D Time frame₹1,345.80 (NSE)
Day’s Range: ₹1,342.60 – ₹1,356.60
52-Week Range: ₹1,186.00 – ₹1,500.00
📉 Technical Overview
Trend: The stock is trading below its 200-day moving average, indicating a mildly bearish trend.
RSI: Currently at 26.6, suggesting the stock is in the oversold zone.
MACD: At -10.01, reinforcing the bearish momentum.
Moving Averages: A strong sell signal is indicated, with 0 buy signals and 12 sell signals across various timeframes.
🔼 Potential Upside (Rise)
Immediate Resistance: ₹1,355 – ₹1,365
Breakout Target: Above ₹1,365, the next resistance is around ₹1,380 – ₹1,390.
Bullish Confirmation: A close above ₹1,390 could signal a reversal or consolidation.
🔽 Potential Downside (Fall)
Immediate Support: ₹1,340 – ₹1,330
Breakdown Target: Below ₹1,330, the stock may test ₹1,310 – ₹1,300.
Bearish Confirmation: A close below ₹1,300 would strengthen the bearish outlook.
✅ Summary
Above ₹1,365: Potential rise toward ₹1,380 – ₹1,390.
Below ₹1,330: Potential fall toward ₹1,310 – ₹1,300.
Between ₹1,330 – ₹1,365: Likely range-bound movement.
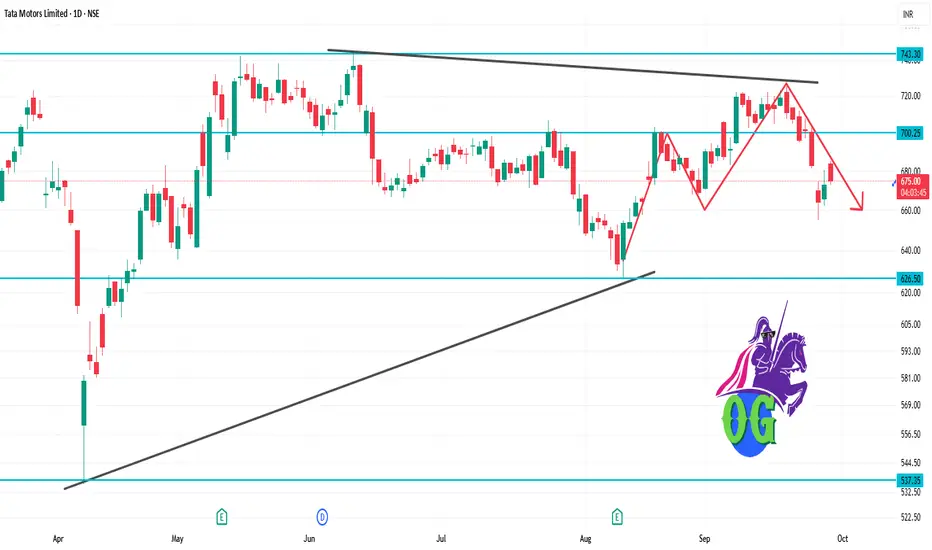
TATAMOTORS 1D Time frameCurrent Market Snapshot
Current Price: ₹675.60
Opening Price: ₹684.00
Day’s Range: ₹673.00 – ₹685.00
Previous Close: ₹672.90
🔑 Technical Indicators
Relative Strength Index (RSI): 48.5 – indicating a neutral condition.
Moving Average Convergence Divergence (MACD): -3.20 – suggesting bearish momentum.
Moving Averages: Trading below the 50-day and 200-day moving averages, indicating a bearish trend.
📈 Key Support & Resistance Levels
Immediate Support: ₹673
Immediate Resistance: ₹685
Pivot Point: ₹679
📉 Market Sentiment
Trend: The stock is trading below its 50-day and 200-day moving averages, indicating a bearish trend.
Volume: Trading volume is higher than average, suggesting increased investor activity.
📈 Strategy (1D Timeframe)
1. Bullish Scenario
Entry: Above ₹685
Stop-Loss: ₹673
Target: ₹690 → ₹695
2. Bearish Scenario
Entry: Below ₹673
Stop-Loss: ₹685
Target: ₹665 → ₹660
⚠️ Risk Management
Limit risk to 1% of capital per trade.
Always use stop-loss to protect against unexpected market movements.
Monitor broader market trends and sector-specific news that may impact stock performance.
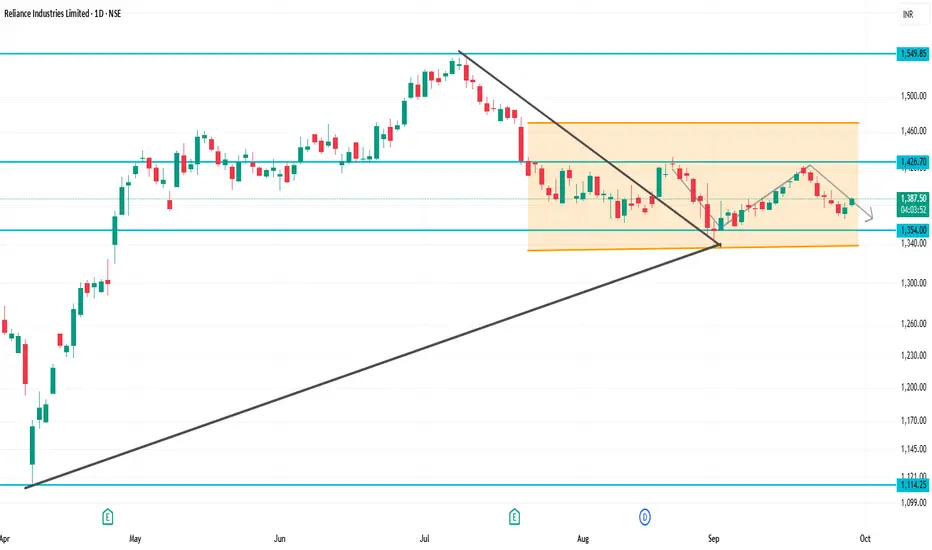
RELIANCE 1D Time frameCurrent Market Snapshot
Current Price: ₹1,383.30
Opening Price: ₹1,381.60
Day’s Range: ₹1,379.00 – ₹1,386.90
Previous Close: ₹1,377.60
🔑 Technical Indicators
Relative Strength Index (RSI): 49.76 – indicating a neutral condition.
Moving Average Convergence Divergence (MACD): -3.20 – suggesting bearish momentum.
Moving Averages: Mixed signals; trading slightly below the 50-day and 200-day moving averages, indicating a neutral to bearish trend.
📈 Key Support & Resistance Levels
Immediate Support: ₹1,379
Immediate Resistance: ₹1,387
Pivot Point: ₹1,383
📉 Market Sentiment
Recent Performance: Reliance Industries experienced a decline of 0.82% on September 25, 2025, underperforming the broader market.
Volume: Trading volume is higher than average, suggesting increased investor activity.
📈 Strategy (1D Timeframe)
1. Bullish Scenario
Entry: Above ₹1,387
Stop-Loss: ₹1,379
Target: ₹1,395 → ₹1,400
2. Bearish Scenario
Entry: Below ₹1,379
Stop-Loss: ₹1,387
Target: ₹1,370 → ₹1,365
⚠️ Risk Management
Limit risk to 1% of capital per trade.
Always use stop-loss to protect against unexpected market movements.
Monitor broader market trends and sector-specific news that may impact stock performance.
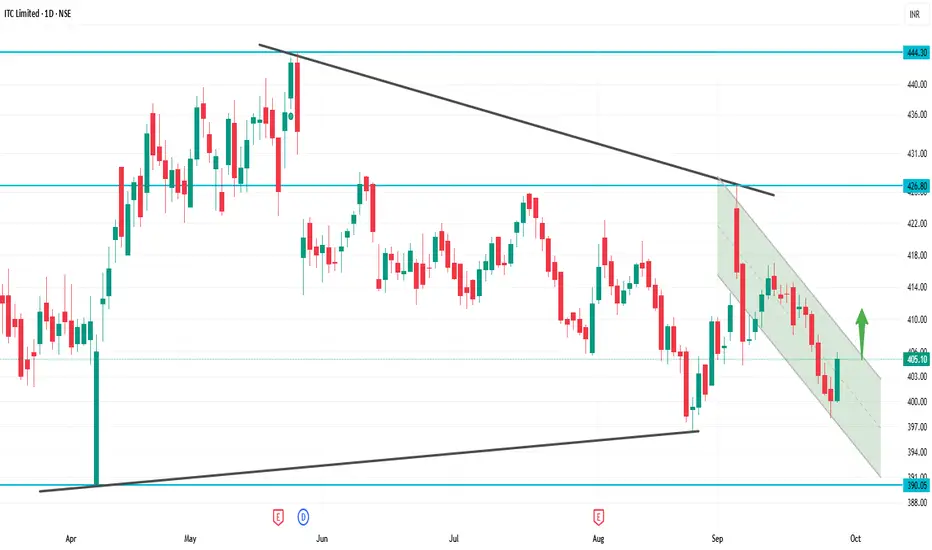
ITC 1D Time frame📊 Updated Snapshot
Current Price: ~₹405
Day Range: ₹402 – ₹410
52-Week High: ₹499
52-Week Low: ₹399
📈 Technical Outlook
Support Zones:
Strong support at ₹405 (current zone)
Next support at ₹398
Resistance Zones:
Immediate resistance at ₹410–₹416
Next resistance at ₹421
Trend Bias: Weak bearish → stock is near 52-week low, testing crucial support.
📌 Step-by-Step View
If it holds above ₹405–₹398: Buyers may step in, possible bounce toward ₹416–₹421.
If it breaks below ₹398: More downside risk opens, weakness can extend further.
Upside revival only above ₹421 closing: That will change trend toward bullish.
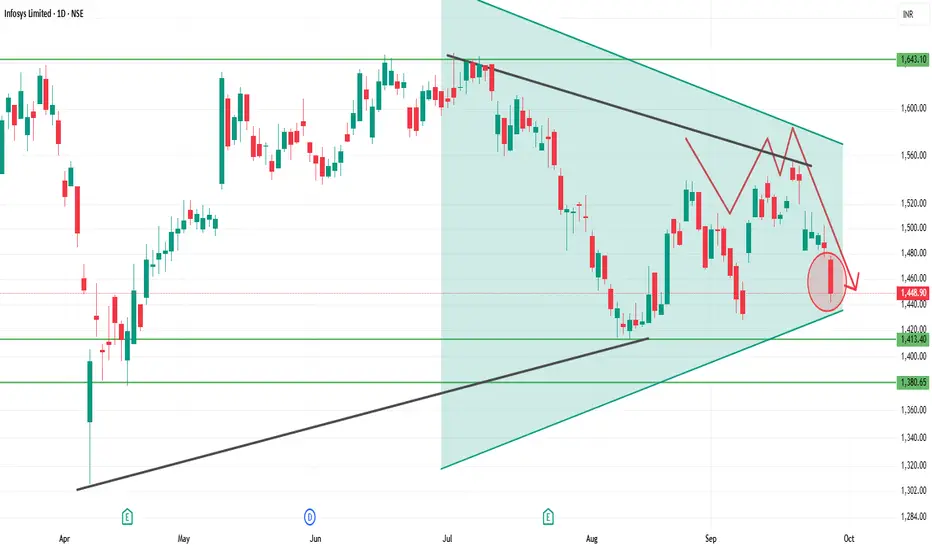
INFY 1D Time frameCurrent Zone: Around ₹1,448 – 1,450 (important support area).
Support Levels:
First support: ₹1,440 – ₹1,448
Next deeper support: ₹1,410 – ₹1,420
Resistance Levels:
Immediate resistance: ₹1,475 – ₹1,485
Strong resistance: ₹1,500 – ₹1,510
Trend Outlook:
Holding above ₹1,448 can trigger a short-term bounce.
Weakness below ₹1,440 may drag it toward ₹1,410.
A close above ₹1,485 would open upside toward ₹1,510+.
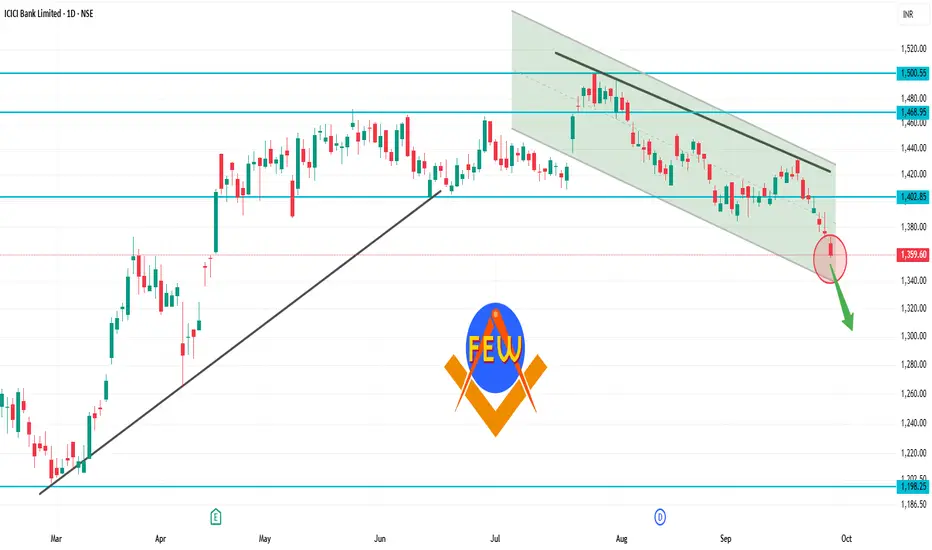
ICICIBANK 1D Time frameClosing Price: ₹1,363.00
Day's Range: ₹1,357.00 – ₹1,372.70
Previous Close: ₹1,375.80
Volume: 18,342,280 shares traded
Market Cap: ₹971,186 crore
52-Week High: ₹1,500.00
52-Week Low: ₹1,186.00
Face Value: ₹2.00
Beta: 0.90
🧾 Financial Highlights
P/E Ratio (TTM): 18.36
P/B Ratio: 3.12
EPS (TTM): ₹74.04
Dividend Yield: 0.81%
ROE: 17.05%
Book Value: ₹436.56
📈 Technical Insights
Trend: The stock is approaching its 200-day moving average, a key technical indicator. A bounce from this level could signal a buying opportunity, while a breakdown may suggest further downside risk.
Support Levels: ₹1,357.00, ₹1,350.00
Resistance Levels: ₹1,375.00, ₹1,400.00
📌 Key Takeaways
Recent Performance: ICICI Bank's stock declined by 0.91%, underperforming the broader market.
Analyst Sentiment: Despite recent volatility, ICICI Bank remains a top pick among analysts for long-term investment.
SENSEX 1D Time frameCurrent Snapshot
Closing / Current Level: ~ ₹ 80,426.46
Day’s Range: High ~ ₹ 81,033, Low ~ ₹ 80,332
Open: ~ ₹ 80,956
⚡ Strategy Thoughts
Bullish approach:
If it recovers above ~80,700 and holds, targets can be 81,000 → 81,300.
Bearish / defensive view:
If Sensex fails near 80,700–81,000, or breaks below ~80,300, downside toward 79,800 and lower comes into play.
Range play:
Between 80,300 and 80,700, you can trade both sides — buy near the bottom of the range, short near resistance — but use tight stops.

LT 1D Time frameClosing Price: ₹3,644.40
Day’s Range: ₹3,635.70 – ₹3,704.00
Previous Close: ₹3,657.60
Change: Down –0.80%
52-Week Range: ₹2,965.30 – ₹3,963.50
Market Cap: ₹5.13 lakh crore
P/E Ratio (TTM): 32.31
Dividend Yield: 0.93%
EPS (TTM): ₹112.81
Beta: 1.20 (indicating moderate volatility)
🔑 Key Technical Levels
Immediate Support: ₹3,635 – ₹3,640
Immediate Resistance: ₹3,700 – ₹3,710
52-Week High: ₹3,963.50
52-Week Low: ₹2,965.30
📈 Technical Indicators
RSI (14-day): 45.2 – indicating a neutral condition.
MACD: Negative, suggesting bearish momentum.
Moving Averages: Trading below the 50-day and 200-day moving averages, indicating a bearish trend.
📉 Market Sentiment
Recent Performance: L&T experienced a decline of 0.80% on September 25, 2025, underperforming the broader market.
Volume: Trading volume was significantly higher than its 20-day average, indicating increased investor activity.
📈 Strategy (1D Timeframe)
1. Bullish Scenario
Entry: Above ₹3,700
Stop-Loss: ₹3,635
Target: ₹3,750 → ₹3,800
2. Bearish Scenario
Entry: Below ₹3,635
Stop-Loss: ₹3,700
Target: ₹3,600 → ₹3,550

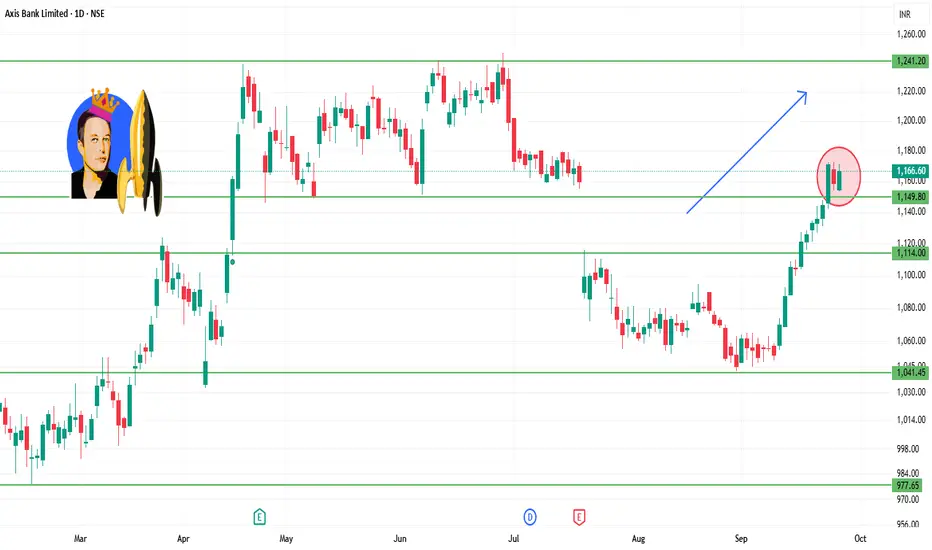
AXISBANK 1D Time frame📊 Daily Snapshot
Closing Price: ₹1,166.10
Day’s Range: ₹1,153.40 – ₹1,171.80
Previous Close: ₹1,158.80
Change: Up +0.28%
52-Week Range: ₹933.50 – ₹1,281.65
Market Cap: ₹3.59 lakh crore
P/E Ratio: 12.9
Dividend Yield: 1.2%
EPS (TTM): ₹90.00
Beta: 1.1 (moderate volatility)
🔑 Key Technical Levels
Immediate Support: ₹1,153.33
Immediate Resistance: ₹1,153.33
Weekly Outlook: Immediate support at ₹1,109.23; major support at ₹1,082.57; immediate resistance at ₹1,153.33; major resistance at ₹1,170.77.
📈 Analyst Insights
Intrinsic Value: Estimated at ₹1,511.77 based on median valuation models, suggesting the stock is trading below its fair value.
📈 Strategy (1D Timeframe)
1. Bullish Scenario
Entry: Above ₹1,153.33
Stop-Loss: ₹1,109.23
Target: ₹1,170.77 → ₹1,200.00
2. Bearish Scenario
Entry: Below ₹1,109.23
Stop-Loss: ₹1,153.33
Target: ₹1,082.57 → ₹1,050.00