KOTAKBANK 1D Time frameCurrent Price: ₹1970.40 (approx)
Day Range: ₹1968 – ₹1981.60
Previous Close: ₹1972.30
🔹 Support & Resistance
Pivot: ₹1975.70
Resistance 1: ₹1983.40
Resistance 2: ₹1989.30
Resistance 3: ₹2002.90
Support 1: ₹1969.80
Support 2: ₹1962.10
Support 3: ₹1948.50
ITC

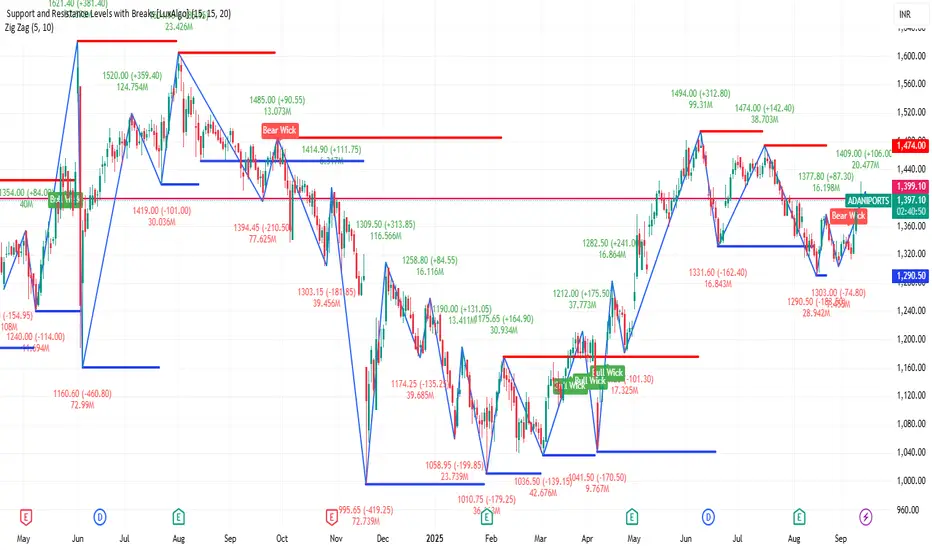
ADANIPORTS 1D Time frameUpdated Snapshot
Current Price: ₹1,399
Day’s Range: ₹1,391 – ₹1,406.50
Previous Close: ₹1,393.10
🔹 Support & Resistance
Support 1: ₹1,391 – ₹1,385
Support 2: ₹1,370 – ₹1,360
Resistance 1: ₹1,406 – ₹1,410
Resistance 2: ₹1,420 – ₹1,430
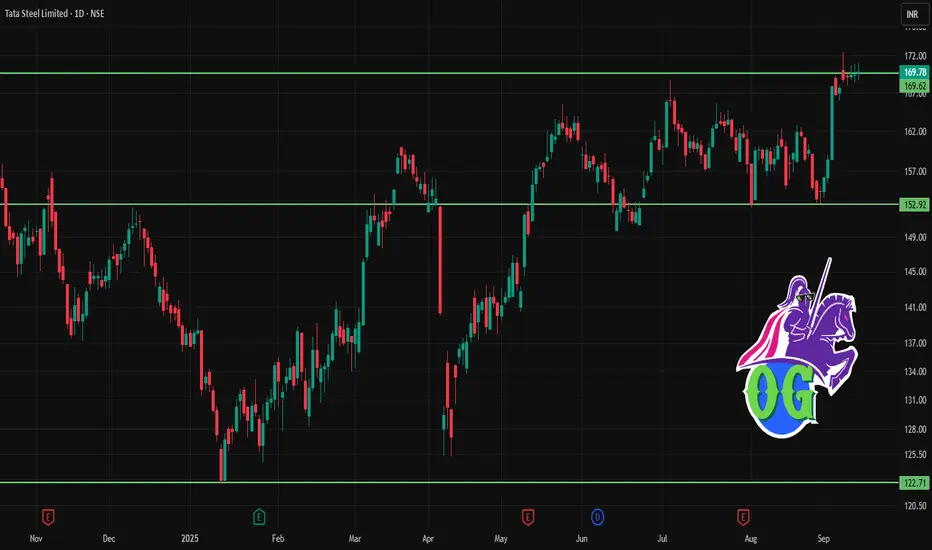
TATASTEEL 1D Time frameCurrent Price & Trend
Current Level: ₹169
Trend: Neutral to slightly bullish → stock is consolidating near support.
Momentum: Price is holding above strong support, but resistance is close.
RSI: Around 55 → neutral, leaning positive.
MACD: Flat to mildly bullish.
Moving Averages: Price is hovering around 20-day average; still above 50-day average → medium-term strength intact.
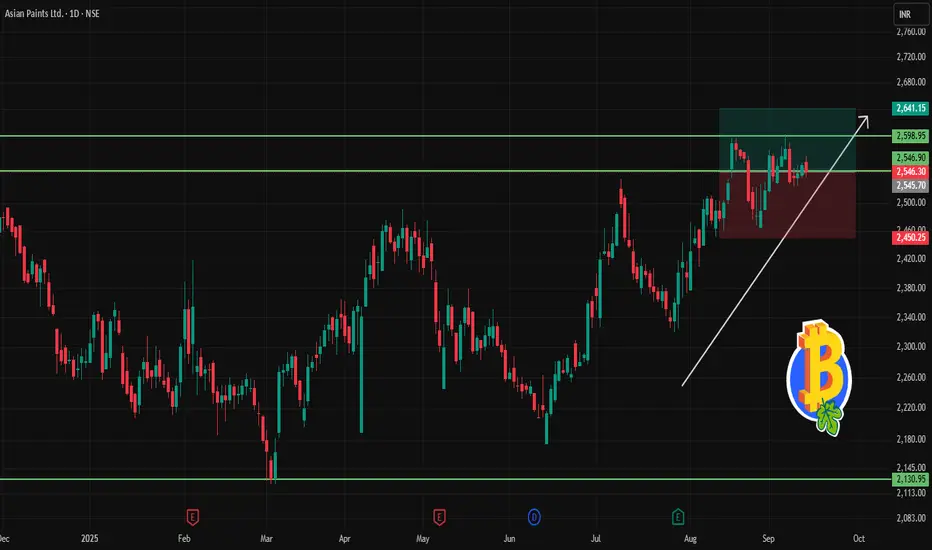
ASIANPAINT 1D Time frameCurrent Status
Price: ~ ₹2,546
It is well below its 52-week high (~₹3,394) and above its 52-week low (~₹2,125)
Market capitalization is large; the stock is considered a large-cap, stable name in decorative paints
Key Metrics
P/E (TTM) is high (≈ 67-70) → indicates expensive valuation relative to earnings
P/B is also elevated (≈ 12-13)
Return on Equity (ROE) ~ 18-20% — reasonable, not exceptional but solid
Bullish Scenario
If Asian Paints can reclaim and hold above ~₹2,550-₹2,600, it may move toward retesting higher resistance levels around ~₹2,750-₹3,000
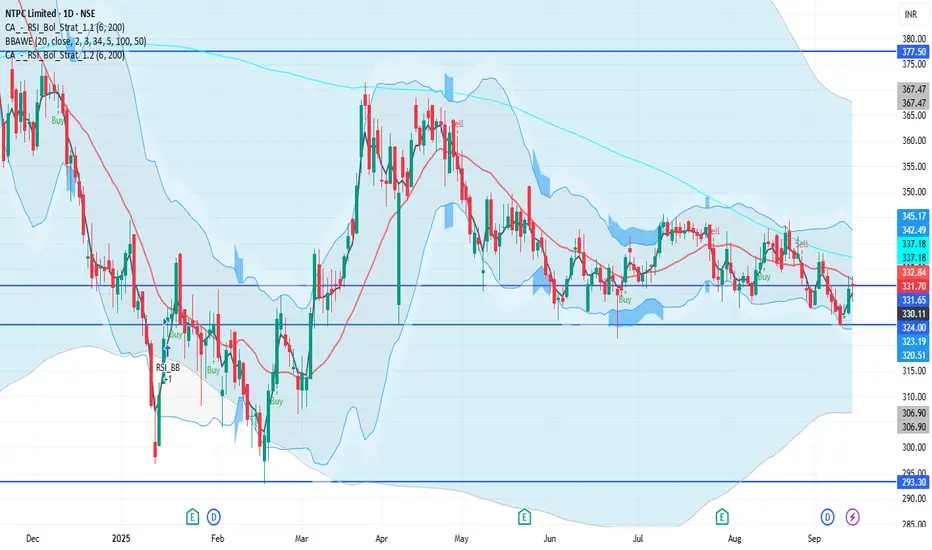
NTPC 1D Time frameCurrent Price & Trend
Price: ₹331.75
Trend: Neutral; trading approximately 26% below its 52-week high of ₹448.30, achieved on September 30, 2024.
Momentum: Indicators suggest a neutral to slightly bullish outlook.
Bullish Scenario
Breakout Above ₹340: A sustained move above ₹340 could target ₹345 – ₹350 in the short term.
KOTAKBANK 1D Time frameCurrent Price & Trend
Price: ₹1,972.30
Trend: Neutral; trading approximately 14.3% below its 52-week high of ₹2,301.90, reached on April 22, 2025.
Momentum: Indicators suggest a neutral to slightly bearish outlook.
Bullish Scenario
Breakout Above ₹1,990: A sustained move above ₹1,990 could target ₹2,000 – ₹2,020 in the short term.

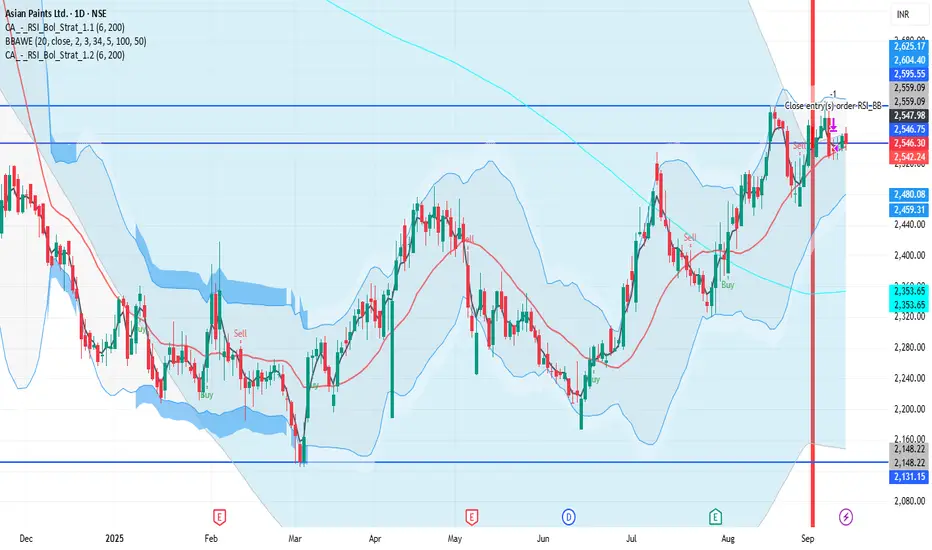
ASIANPAINT 1D Time frameCurrent Price & Trend
Price: ₹2,546.30
Trend: Consolidating near recent highs; trading approximately 25% below its 52-week high of ₹3,394.90.
Momentum: Indicators suggest a neutral to slightly bearish outlook.
Bullish Scenario
Breakout Above ₹2,580: A sustained move above ₹2,580 could target ₹2,600 – ₹2,620 in the short term.
⚠ Bearish Scenario
RELIANCE 1D Time frameCurrent Status
Price is around ₹715
The stock has been showing strength recently, with many of its moving averages (short- to long-term) supporting the rise.
Technical indicators like RSI, MACD, ADX etc. lean positive — buyers seem to have the upper hand.
There’s an inverted Head & Shoulders pattern forming, which is a bullish reversal signal if confirmed. Support zones are holding up so far.
Bullish Scenario
If Tata Motors stays above ₹700–705 support and breaks past ~₹720–725 with volume:
Possible upside to ~₹730-₹740
SBIN 1D Time frameCurrent Price Action (Daily Chart)
Price Range: Stock is moving between ₹815 – ₹830 right now.
Trend: Consolidation with mild bullish bias.
Key Levels
Immediate Resistance: ₹830
Next Resistance: ₹840 – ₹850
Major Resistance: Around ₹875 (previous high)
Immediate Support: ₹815 – ₹820
Strong Support: ₹800 – ₹805
Critical Support: ₹785

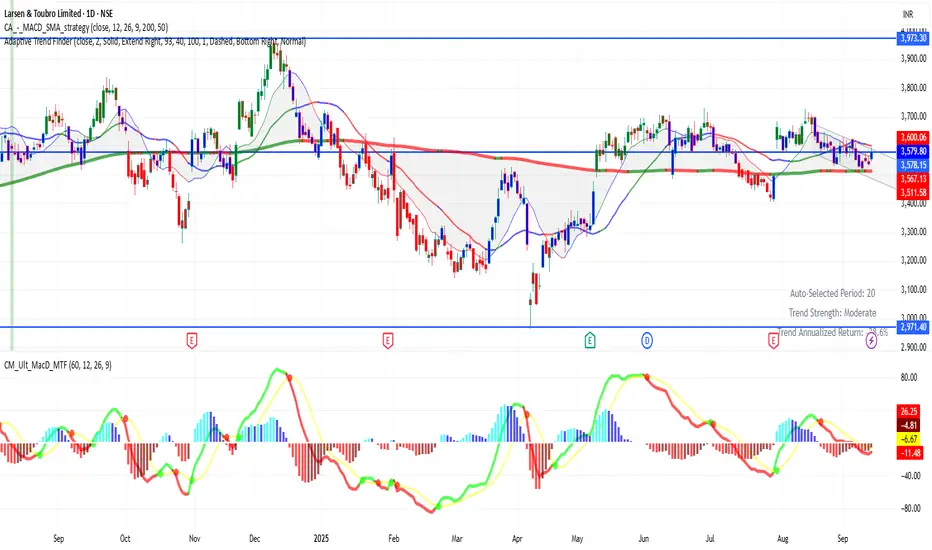
LT 1D Time frame LT — Daily (1D) Time Frame
Current Price: ₹3,579
Key Levels
Immediate Support: ₹3,540
Strong Support: ₹3,400
Immediate Resistance: ₹3,600
Major Resistance: ₹3,900
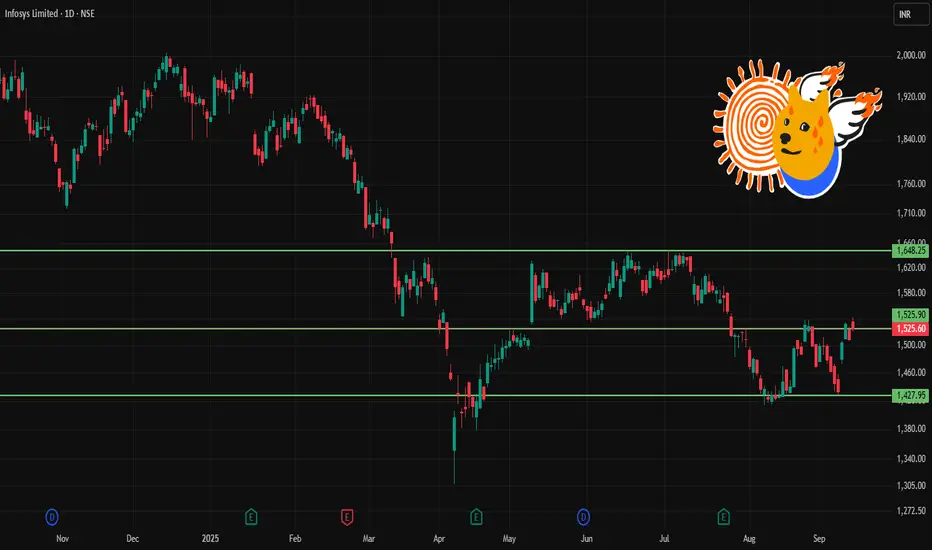
INFY 1D Time frame📉 Current Market Snapshot
Current Price: ₹1,525.60
Previous Close: ₹1,509.70
Day's Range: ₹1,521.10 – ₹1,542.90
52-Week High: ₹2,006.45
52-Week Low: ₹1,307.00
Market Cap: ₹6,33,794 crore
P/E Ratio: 23.0
Dividend Yield: 2.82%
ROE: 28.72%
Debt-to-Equity Ratio: 0.09
Beta: 1.11
EPS (TTM): ₹65.63
Face Value: ₹5.00
VWAP: ₹1,529.86
Volume: 12,856,963 shares
ATR (14): ₹5.72
MFI: 71.75
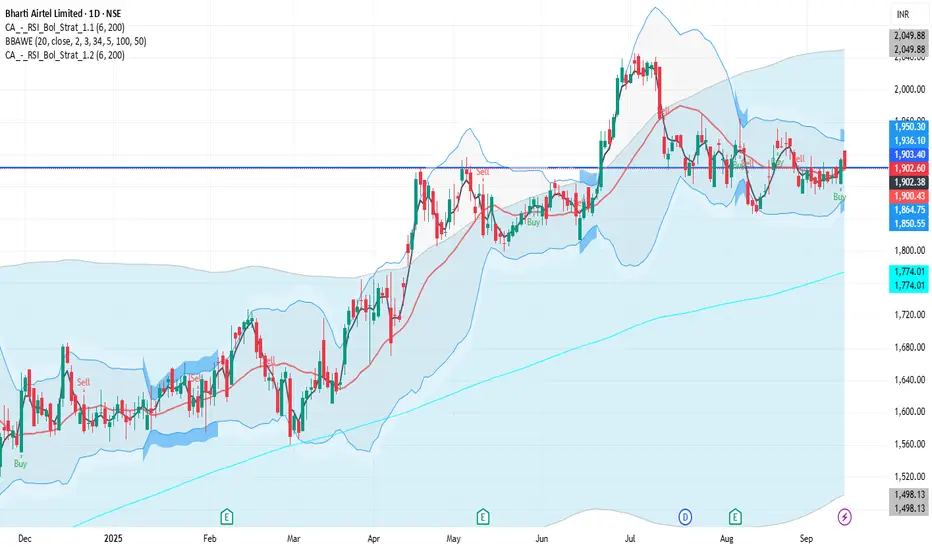
BHARTIARTL 1D Time frame📉 Current Market Snapshot
Previous Close: ₹1,902.00
Day's Range: ₹1,901.60 – ₹1,925.00
52-Week High: ₹2,045.80
52-Week Low: ₹1,511.00
Market Cap: ₹11.03 lakh crore
P/E Ratio: 30.72
Dividend Yield: ~0.81%
ROE: 23.80%
Debt-to-Equity Ratio: 1.88
Beta: 0.94
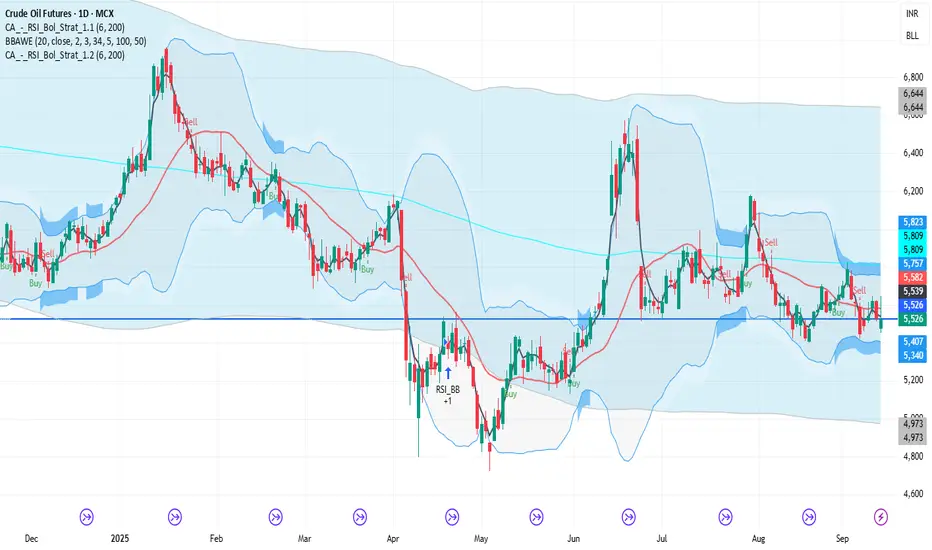
CRUDEOIL1! 1D Time frame📉 Current Market Snapshot (as of September 13, 2025)
Previous Close: ₹5,526
Day's Range: ₹5,454 – ₹5,647
Open: ₹5,480
Close: ₹5,530
📊 Key Levels
Support: ₹5,495, ₹5,442
Resistance: ₹5,663, ₹5,800, ₹5,865
LUPIN 1D Time frame📍 Current Price
₹2,043.40 (closing price)
Short-Term Outlook
Bullish Scenario: A sustained move above ₹2,070 could lead to a test of the 52-week high around ₹2,402.90.
Bearish Scenario: A drop below ₹2,000 may signal a potential pullback toward ₹1,950.

BANKNIFTY 1D Time frame📍 Current Level
₹54,669.60
Short-Term Outlook
Bullish Scenario: A sustained move above ₹55,000 could lead to a test of the 52-week high around ₹57,628.40.
Bearish Scenario: A drop below ₹54,300 may signal a potential pullback toward ₹54,000.

NIFTY 1D Time frame📍 Current Level
25,114.00 (closing value)
Short-Term Outlook
Bullish Scenario: A sustained move above ₹25,200 could lead to a test of the 52-week high around ₹26,277.35.
Bearish Scenario: A drop below ₹25,000 may signal a potential pullback toward ₹24,800.

HDFCBANK 1D Time frame:
📍 Current Price
₹967.30 (closing price)
Short-Term Outlook
Bullish Scenario: A sustained move above ₹975.00 could lead to a test of the 52-week high around ₹1,018.85.
Bearish Scenario: A drop below ₹960.00 may signal a potential pullback toward ₹950.00.

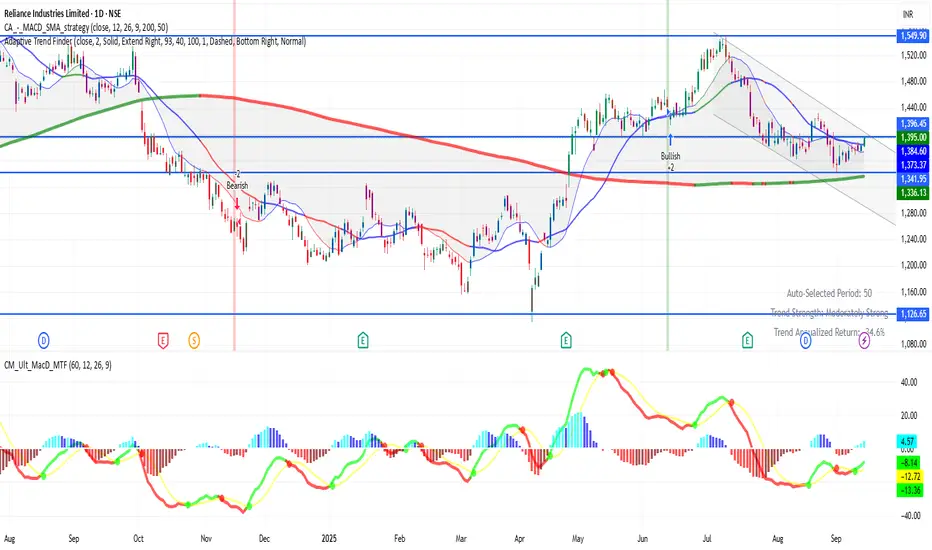
RELIANCE 1D Time frame📍 Current Price
₹1,395.00 (closing price)
Short-Term Outlook
Bullish Scenario: A sustained move above ₹1,400.00 could lead to a test of the 52-week high around ₹1,551.00.
Bearish Scenario: A drop below ₹1,375.00 may signal a potential pullback toward ₹1,350.00.

BPCL 1D Time frame📍 Current Price
₹318.00 (closing price)
Short-Term Outlook
Bullish Scenario: A sustained move above ₹322.65 could lead to a test of the 52-week high around ₹376.00.
Bearish Scenario: A drop below ₹312.30 may signal a potential pullback toward ₹300.00.

TATAMOTORS 1D Time frame📍 Current Price
₹715.25 (closing price)
Short-Term Outlook
Bullish Scenario: A sustained move above ₹731.00 could lead to a test of the 52-week high around ₹1,006.00.
Bearish Scenario: A drop below ₹690.00 may signal a potential pullback toward ₹680.00.

AXISBANK 1D Time frame📍 Current Price
₹1,105.30 (up 1.64% from previous close)
Short-Term Outlook
Bullish Scenario: A sustained move above ₹1,115 could lead to a test of the 52-week high around ₹1,281.65.
Bearish Scenario: A drop below ₹1,080 may signal a potential pullback toward the ₹1,050 level.

MARUTI 1D Time frame📍 Current Price
₹15,325.00
Short-Term Outlook
Bullish Scenario: A sustained move above ₹15,450 could lead to a test of the 52-week high around ₹15,384.
Bearish Scenario: A drop below ₹15,100 may signal a potential pullback toward the ₹14,800 level.

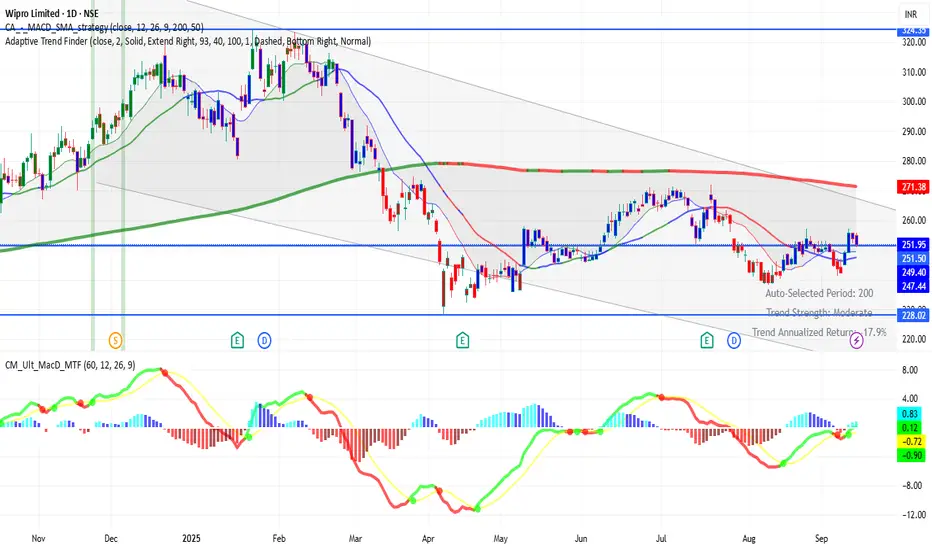
WIPRO 1D Time frame📊 Current Status
Price around ₹252–₹255
Showing recovery from recent support
🔑 Key Levels
Support: ₹242 → ₹240 → ₹230
Resistance: ₹255 → ₹260 → ₹265
✅ Outlook
If WIPRO sustains above ₹255–₹260, more upside is possible. Falling below ₹240 may push price back toward ₹230.