MARUTI 1D Time frame📍 Current Price Action
Last traded price: ~₹ 15,096
Minimal intraday change (~0.1%, slightly up)
⚙ Technical Indicators
RSI (14): ~72 → strong uptrend / overbought conditions
Stochastic RSI: Low / showing weakness → possible cooling off
CCI (14): ~92 → uptrend strength
MFI (Money Flow Index): ~84 → strong buying pressure
📊 Moving Averages & Trend Strength
Price is above 50-day and 200-day SMAs & EMAs → long-term trend is bullish
20-day SMA/EMA are more neutral-to-slightly bullish
All major moving averages are broadly supporting upwards bias
🔧 Support & Resistance / Pivot Zones
Support Levels: ~₹ 14,900 – ₹ 15,000
Resistance Levels / Pivot: ~₹ 15,300 – ₹ 15,500
🧠 Summary
Maruti is in a strong uptrend on the daily chart. Overbought indicators like RSI and MFI suggest buying strength is high, which also means risk of a short-term pullback or consolidation. Key support ~₹ 15,000 needs to hold for bulls. If price clears resistance near ₹ 15,300-15,500 convincingly, upward move likely to continue.
ITC

INFY 1D Time frame📍 Current Price Action
Current Price: ~₹1,509
Day Change: about –1.5%
Daily Range: ₹1,500 – ₹1,515
⚙ Technical Indicators
RSI (14): ~57–60 → neutral to mildly bullish momentum
MACD: Positive → signals upward bias
Stochastic Oscillator: Near oversold zone → indicates possible bounce
ADX (14): ~26 → moderate trend strength
Money Flow Index (MFI): Mid-range → no extreme buying/selling pressure
📊 Moving Averages
Short-term (5, 10-day): Price trading slightly below → short-term weakness
Medium to Long-term (50, 100, 200-day): Price still above → long-term structure supportive
📉 Support & Resistance
Immediate Support: ~₹1,500
Next Support: ~₹1,480 – ₹1,470
Immediate Resistance: ~₹1,512 – ₹1,515
Breakout Target (if above resistance): ~₹1,530 – ₹1,540
🧠 Summary
INFY is neutral to mildly bullish on the daily chart. Support at ₹1,500 is crucial — holding above it keeps momentum intact. If the stock breaks above ₹1,515, it can push toward ₹1,530–1,540. On the downside, breaking below ₹1,500 may invite weakness toward ₹1,480–1,470.

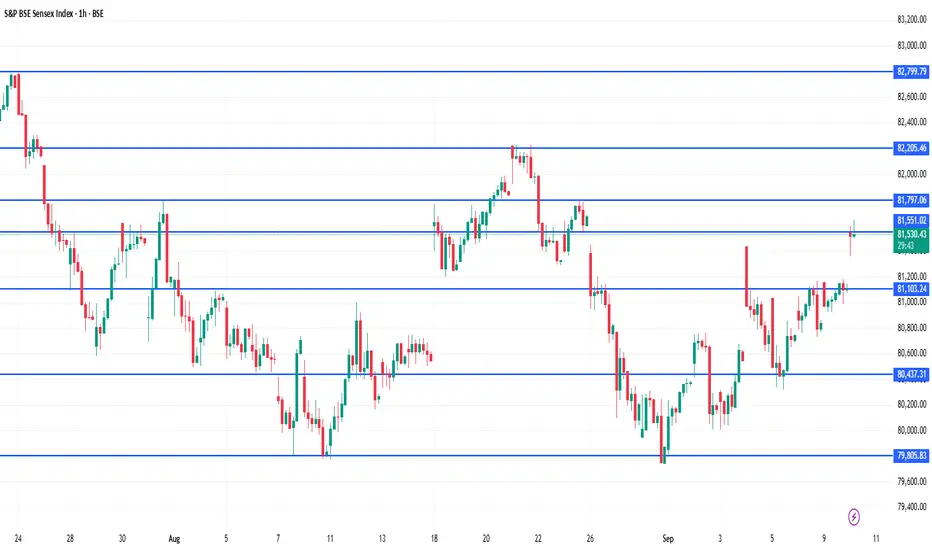
SENSEX 1D Time frame📍 Current Price Action
Current Level: 81,548
Day’s Range: ~80,320 – 81,550
52-Week Range: 71,425 – 85,978
⚙ Technical Indicators
RSI (14): Around 43 → neutral to slightly bearish zone
MACD: Negative → mild downward pressure still visible
ADX (14): ~35-40 → moderate trend strength
Stochastic Oscillator: Near overbought zone → possible short-term pullback
Moving Averages:
Short-term (5, 10, 20-day): Mixed
Medium & long-term (50, 100, 200-day): Acting as resistance near highs
📊 Key Levels
Immediate Support: 80,800 – 81,000 zone
Immediate Resistance: 81,600 – 81,800 zone
Breakout Levels:
Above 81,800 → upside momentum could target 82,200+
Below 80,800 → downside may test 80,300 – 80,000
🧠 Summary
Sensex is currently at 81,548, near its resistance zone. Trend is neutral to mildly bullish in the short-term. Sustaining above 81,600–81,800 will confirm strength for further rally. A failure to hold could trigger a pullback toward 80,800–80,300.

WIPRO 1D Time framw📈 Price Action
Previous Close: ₹255.75
Today's Close: ₹256.50
Daily Range: ₹253.00 – ₹257.00
Volume: 804,499 shares (significantly higher than the 50-day average of 369,496 shares)
52-Week Range: ₹228.00 – ₹324.55
🔧 Technical Indicators
Relative Strength Index (RSI): 63.59 — Indicates bullish momentum.
MACD: Positive — Suggests upward trend.
Moving Averages:
5-day MA: ₹254.50
50-day MA: ₹249.00
200-day MA: ₹265.00
Trend: Bullish, as the stock is trading above short-term moving averages.
Stochastic Oscillator: 76.47% — Indicates overbought conditions, suggesting potential for a pullback.
Average True Range (ATR): ₹0.05 — Indicates low volatility.
📊 Support & Resistance Levels
Immediate Support: ₹253.00
Immediate Resistance: ₹257.00
Pivot Point: ₹255.00
🧠 Trend Analysis
Trend: Bullish
Momentum: Positive
Volatility: Low
Summary: Wipro's stock is exhibiting a bullish trend with positive momentum. The current overbought condition, as indicated by the stochastic oscillator, suggests that the stock may experience a short-term pullback before continuing its upward trajectory. Traders should monitor the support and resistance levels for potential entry and exit points.

SUNPHARMA 1D Time frame📈 1-Day Price Action
current: ₹1,610.50
Open: ₹1,592.50
High: ₹1,614.00
Low: ₹1,592.50
Close: ₹1,611.10
Volume: 1.14 million shares
🔧 Technical Indicators
Relative Strength Index (14): 65.29 — indicates bullish momentum
MACD: 6.80 — suggests upward trend
Moving Averages: 5-day MA: ₹1,608.84, 50-day MA: ₹1,586.46, 200-day MA: ₹1,610.12 — all signaling a buy
Pivot Point: ₹1,610.10 — aligns with current trading level
📊 Trend & Levels
Trend: Bullish
Support: ₹1,600
Resistance: ₹1,620
🧠 Market Sentiment
Analysts maintain a positive outlook on Sun Pharma, with JM Financial retaining a "Buy" rating and a revised target price of ₹2,025, reflecting confidence in the stock's potential for appreciation over the next year.

SENSEX 1hour Time frame📍 Sensex – 1H Important Levels (Current)
🔹 Support Zones
74,200 – 74,300 → Immediate intraday support
73,800 – 73,900 → Stronger support zone
73,400 – 73,500 → Major support, breakdown may trigger further downside
🔹 Resistance Zones
74,800 – 74,900 → Immediate 1H resistance
75,200 – 75,300 → Strong resistance; breakout can fuel upside momentum
75,600 – 75,800 → Major resistance; sellers likely to appear here
⚖️ Quick Summary
Bias: Mildly bullish as long as Sensex trades above 74,200.
A breakout above 74,900 may target 75,200 – 75,800.
A breakdown below 73,800 may drag it towards 73,400.
Current range to monitor: 74,200 – 74,900.
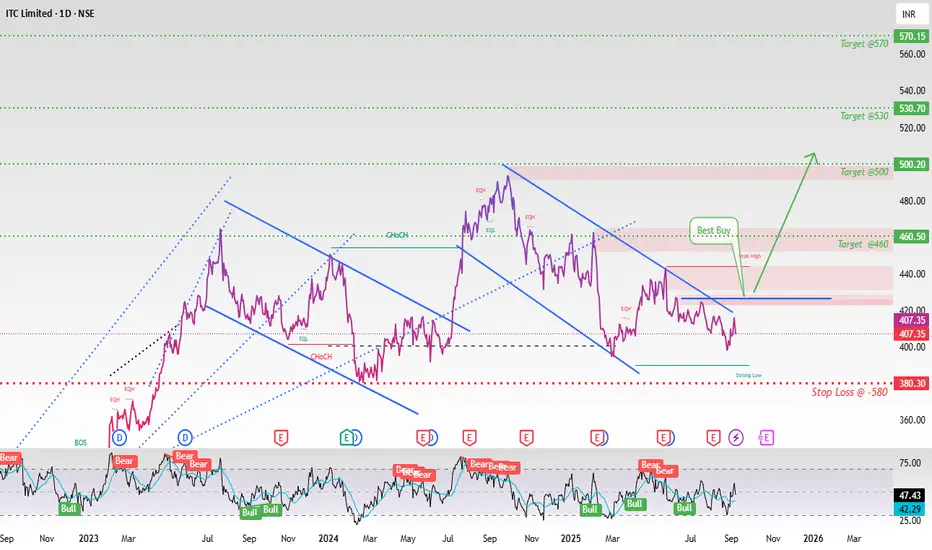
ITC Ltd – Trade IdeaNSE:ITC
ITC Ltd – Trade Idea
Recommendation : BUY
Entry Level : Above ₹425+
Stop Loss : Below support zone of **₹480**
Target Levels : ₹460 / ₹500 / ₹530 / ₹570
---
**Technical Rationale* *
* ITC is forming a **Flag & Pole pattern**, a bullish continuation setup indicating potential for further upside once the consolidation ends.
* Sustaining above ₹425 will likely confirm the breakout, opening room for higher targets.
* Support is well-placed near ₹480; holding this level keeps the bullish momentum intact.
---
**Fundamental Snapshot**
* **P/E Ratio**: \~14.92 – attractive compared to FMCG peers, suggesting reasonable valuation.
* Diversified business model across Cigarettes, FMCG, Hotels, Paper & Agri.
* Strong balance sheet with robust cash flows and healthy dividend payout.
---
**Outlook**
The confluence of **bullish technical structure (flag & pole)** and **comfortable valuations** makes ITC a favorable candidate for **swing to positional trades**.
Risk is well-defined with support near ₹480, while upside potential remains strong toward ₹570 levels.
---
Thanks & Happy Trading
Disclaimer:
This idea is only for educational purposes,
Please Trade at your own RISK''
Options OI Trade Outlook — Bullish Setups Only________________________________________
📊 Options OI Trade Outlook — Bullish Setups Only
“This analysis is shared purely for educational purposes and market awareness — not a trading recommendation.”
(Educational Purpose | Not Financial Advice | SEBI Compliant)
Hello Traders 👋,
Here are today’s 7 Bullish Option Setups based on OI + Price Action + IV + Greeks study.
This is strictly for learning and educational purposes only.
________________________________________
🟢 1. ITC 410 CALL
LTP: 7.25
Sentiment: Bullish | Trend: Up | Strength: 5/5 (Strong)
IV: 13.3 | Delta: 0.55 | Theta: -0.20 | Vega: 0.46
Buildup: Long Build-up
Why?
410 CE shows a strong Long Build-up with price ↑ 70.6% and OI ↑ 31.2%.
Volume jumped +305.9%, confirming active participation.
Low IV makes premiums attractive. Delta 0.55 indicates higher ITM probability.
________________________________________
🟢 2. CGPOWER 700 CALL
LTP: 23.5
Sentiment: Bullish | Trend: Up | Strength: 5/5 (Strong)
IV: 30.9 | Delta: 0.52 | Theta: -0.65 | Vega: 0.79
Buildup: Long Build-up
Why?
700 CE surged +127% in price with OI ↑ 216.5% — strong long confirmation.
Volume spiked +2962%, showing aggressive buying.
IV rising (+10.3%) supports premium expansion.
________________________________________
🟢 3. COLPAL 2340 CALL
LTP: 61.7
Sentiment: Bullish | Trend: Up | Strength: 5/5 (Strong)
IV: 22.4 | Delta: 0.53 | Theta: -1.52 | Vega: 2.64
Buildup: Long Build-up
Why?
2340 CE gained +89.8% in price with OI ↑ 146.9%.
Volume surged +2357%, indicating strong trader interest.
Moderate IV gives a balanced risk-reward setup.
________________________________________
🟢 4. LT 3600 CALL
LTP: 76.25
Sentiment: Bullish | Trend: Up | Strength: 5/5 (Strong)
IV: 15.9 | Delta: 0.55 | Theta: -2.34 | Vega: 4.06
Buildup: Long Build-up
Why?
3600 CE rose +29.2% with OI ↑ 3.6%.
Volume ↑ 71%, confirming active participation.
Delta 0.55 signals higher ITM chances with bullish momentum.
________________________________________
🟢 5. BRITANNIA 5800 CALL
LTP: 172
Sentiment: Bullish | Trend: Up | Strength: 5/5 (Strong)
IV: 21.6 | Delta: 0.57 | Theta: -3.46 | Vega: 6.52
Buildup: Long Build-up
Why?
5800 CE rallied +49.6% with OI ↑ 16.5%.
Volume jumped +566%, confirming buying momentum.
IV rising (+9.4%) shows strong premium expansion potential.
________________________________________
🟢 6. ASIANPAINT 2500 CALL
LTP: 77
Sentiment: Bullish | Trend: Up | Strength: 3.9/5 (Strong)
IV: 20.8 | Delta: 0.59 | Theta: -1.40 | Vega: 2.79
Buildup: Short Covering
Why?
2500 CE benefited from short covering — price ↑ 21% while OI ↓ 21.6%.
This indicates shorts exiting, fueling bullish momentum.
Volume dipped (-15.9%), so position sizing should be careful.
________________________________________
🟢 7. DMART 4800 CALL
LTP: 101
Sentiment: Bullish | Trend: Up | Strength: 5/5 (Strong)
IV: 20.2 | Delta: 0.50 | Theta: -3.53 | Vega: 5.40
Buildup: Long Build-up
Why?
4800 CE rose +12.1% with OI ↑ 17.5% — strong long confirmation.
Volume ↑ 159.9% adds conviction.
IV easing (-6.1%) ensures better fills with controlled risk.
________________________________________
⚠️ Disclaimer – Please Read Carefully
The information shared here is meant purely for learning and awareness.
It is not a buy or sell recommendation and should not be taken as investment advice.
📌 I am not a SEBI-registered investment advisor.
📌 All views expressed are based on personal study, chart patterns, and publicly available data.
📌 Trading in stocks or options carries risk. Markets can move unexpectedly. Losses can exceed capital.
📌 Past setups do not guarantee future outcomes.
👉 Beginners: Use this for study & paper trading only.
👉 Experienced traders: Apply your own risk management & strategy filters.
👉 Always consult a SEBI-registered financial advisor before real trades.
________________________________________
💬 Found this useful?
🔼 Boost this post to help more traders learn.
✍️ Share your thoughts/setups in comments — let’s grow together.
🔁 Share with fellow traders & learners.
👉 Follow for more clean, structured breakdowns with discipline at the core.
🚀 Stay Calm. Stay Clean. Trade With Patience.
Trade Smart | Learn Zones | Be Self-Reliant 📊
________________________________________

XAU/USD SD + OTE + Fractal Reversal TradeHey traders!
Here you can see all the trades taken by me in accordance with some major concepts of ICT.
1. OTE - Optimal Trade Entry
2. SD - Standard Deviation
3. Fractal Nature - If you can't find a pattern on the HTF, you'll surely find something on the LTF and vice versa. For example:
- The SELL entry over here, we had an FVG on the 5 min TF , there was no other valid level to short the markets.
- The other BUY Entries were taken on HTFs , and gave us very good targets as well!
Standard Deviations when combined with PD arrays , work like a charm and can be used as targets for LTF trades and reversals for HTF trades.
Hope you learned something today!
Share your analysis as well in the comments!

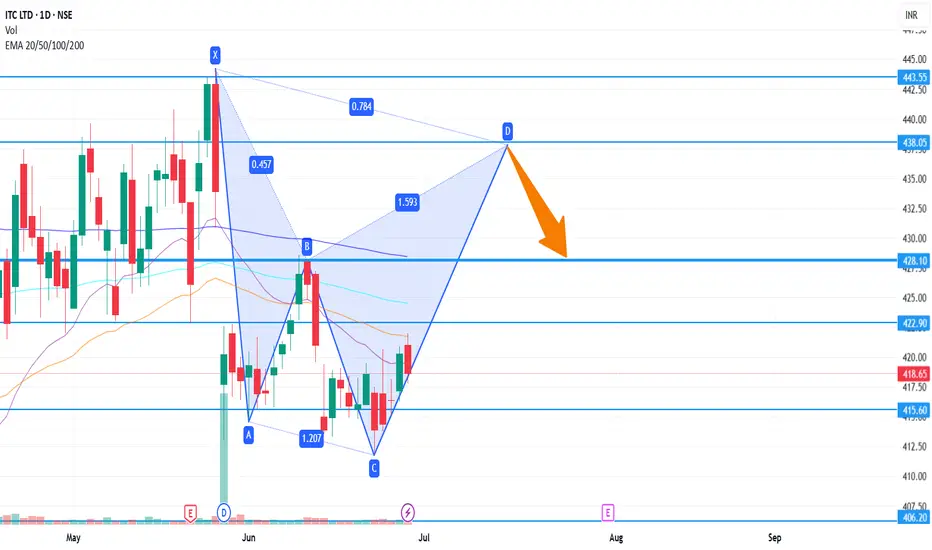
ITC Short Term 438ITC on daily chart is forming a bearish harmonic pattern.
If it follows the pattern formation then next targets at 428 and 438
Stop Loss is 413
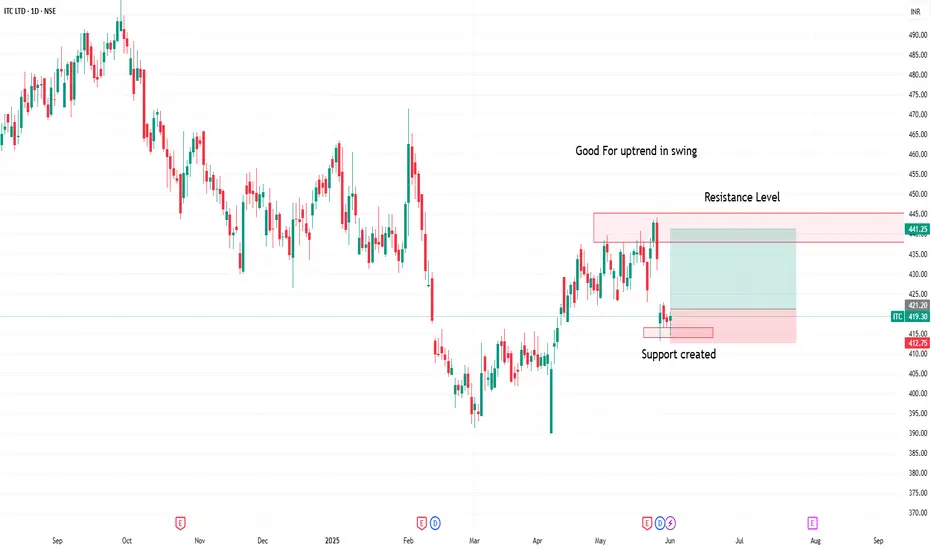
ITC creating strong support for uptrend1. Good fundamental stock
2. Good opportunity for long term and swing
3. Small Stop Loss with great R:R
Heads Up! ITC Looks Ready to FlyAfter a steady decline from its highs, ITC has made a strong comeback, bouncing perfectly off its trendline support. And now—it’s broken past its trendline resistance!
📈 This breakout could be the start of a new bullish wave, with momentum likely to carry the stock higher in the sessions ahead.
💰 Dividend Alert: ITC has announced a final dividend of ₹7.85 per share, with the ex-date on 28th May. This is the highest dividend declared by ITC in the last 5 years. That could bring some serious action in the next couple of trading days.
🎯 All eyes on ITC—this might just be the breakout we’ve been waiting for!

ITC ready for breakout with target of 500CUP formation in W
Presently at resistance 440.
Taken support at all the MA.
FMCG index is also consolidation.
Breakout above 440 for target of 500
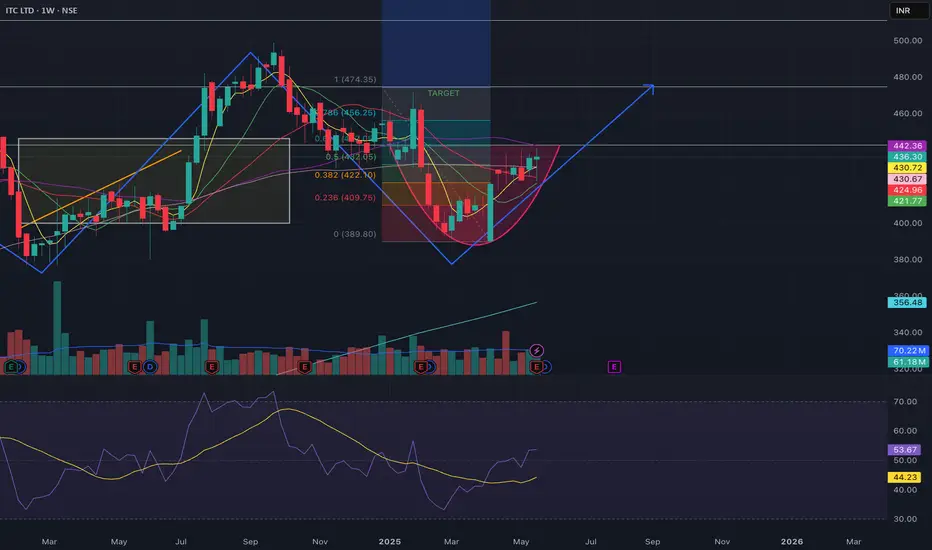
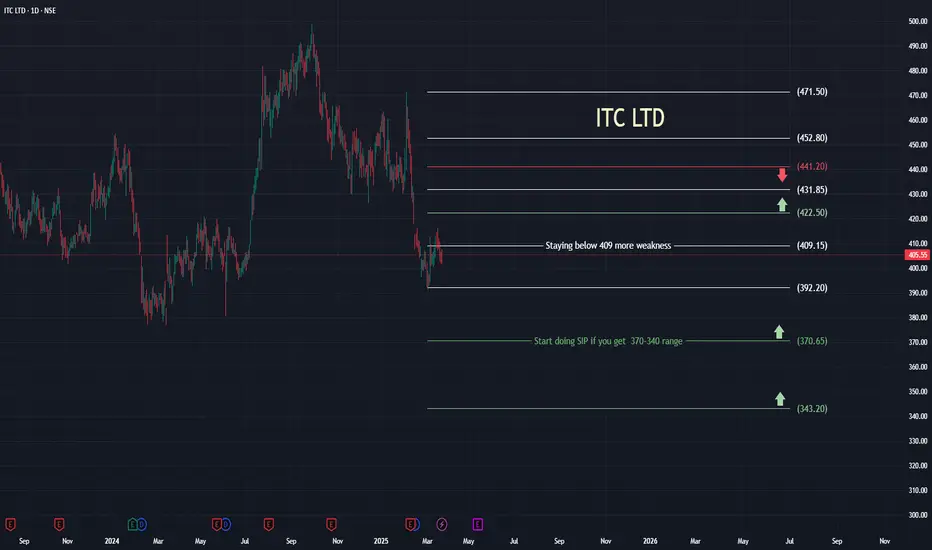
ITC LTDITC LTD
One of the most sought after stock in recent years
corrected around 20% from high of 499
trying to find ground but still has to cross and sustain above 409 on EOD basis...
those who missed out can start SIP from 340-371 levels...
Other levels marked for using as churning profits from level to level.
Like.. Share... Comment
Buying in ITC for small targetThe ITC 75-minute chart forms a Terminal Impulse.
There is a good buying opportunity near the 440 and 445 price zone.
Strict stoploss below wave 2 which is below 432 level.
The target for wave 5 will be 470.
This analysis is based on Elliott Wave theory and Fibonacci.
Please always do your research before you take any action.
For educational purposes only.

What's happening in ITC?ITC daily chart: After completion of Normal or Trending Impulse, the price falls.
We can see clearly that the first leg of this fall looks like an impulse (shown by red 1-2-3-4-5), which is wave A of Zig-zag.
Then price retraced to 38.2% forming wave B.
Currently, wave C is developing in ITC. The minimum fall for this is 61.8% extension, which is near the 459 level.
Remember that this is a minimum fall for any Zig-zag pattern.
If the price breaks 459 and starts trading below it, the target of 100%, which is near 438.85, will be achieved. (This also fulfills the Rule of Equality).
This analysis is based on Elliott Wave theory and Fibonacci.
This analysis is for educational purposes only.

The Breakout Retest Play: 5 Stocks to Consider1. Infosys NSE:INFY
● The stock has formed a Rounding Bottom pattern, and after the breakout, it rose significantly, reaching an all-time high near 1,990.
● Currently, the stock is trading slightly above the breakout level following a minor pullback.
➖ Best buy level: 1790 - 1830
2. ITC NSE:ITC
● The stock encountered resistance between the 470 and 480 levels multiple times.
● After breaking through this range, the price surged to an all-time high of 528.
● The price then faced rejection at this peak and has since retreated to the breakout level, where it is now rising again.
➖ Best buy level: 470 - 480
3. Lupin NSE:LUPIN
● The stock achieved a breakout after nearly nine years in August 2024.
● Following an initial upward movement, the stock price pulled back for a retest and is now trending upward once more.
➖ Best buy level: 2000 - 2050
4. Birlasoft NSE:BSOFT
● After breaking out of the Rounding Bottom pattern, the stock price surged to an all-time high of 856 before declining.
●The stock is currently trading at the breakout level, which appears to be a strong support.
➖ Best buy level: 550-560
5. Emami NSE:EMAMILTD
● After a prolonged consolidation, the stock developed an Inverted Head & Shoulder pattern.
● Following the breakout, the price surged to an all-time high of 860 but faced strong rejection from that level.
● The stock is now approaching a retest of the previous breakout level.
➖ Best buy level: 595 - 600

ITC - 2 PossiblitiesRight now stock is holding its strong support zone of 478
If successful stock may make a journey upto 500 without halt
If not it may fall and take the more stronger support of 468
In both cases idea voids below 465

ITC - 1D TFNSE:ITC has a uptrend in 1M TF. Looking down at the 1D TF, the chart has broken a triangle pattern and has moved down, touched a demand zone and is currently trading at a support turned resistance zone. Let us see what the market has for us..!!
Disclaimer:- This analysis is only for educational purpose. Please always do your own analysis or consult with your financial advisor before taking any kind of trades NSE:ITC

ITC long above 500 Can buy with sl @470 rr is favorable
Or can Wait for this week , if this week close above 500 then soon ATH

Itc - Sideways to Bullish in coming daysStock seems to be near the end of bearishness
Multiple strong conjunctive supports arriving
494 - 496 strongest support for the stock
View negates below 492
Possible targets 515/530

ITC - BullishITC taking support at the strongest flip zone 503-503
Bouncing back from here may possible take stock to chart new Ath territory
Any break below 500 will take it back near 575-80
Trade accordingly

Short (OI) Buildup in ITCHello Traders,
As we can see the whole Trading session ITC failed to Sustain above 510.65 levels which is the strong resistance in ITC now.
& the data says very big short positions has been created in ITC.
Be aleart It can reverse at any given point of Time.
Thank You
Prince
