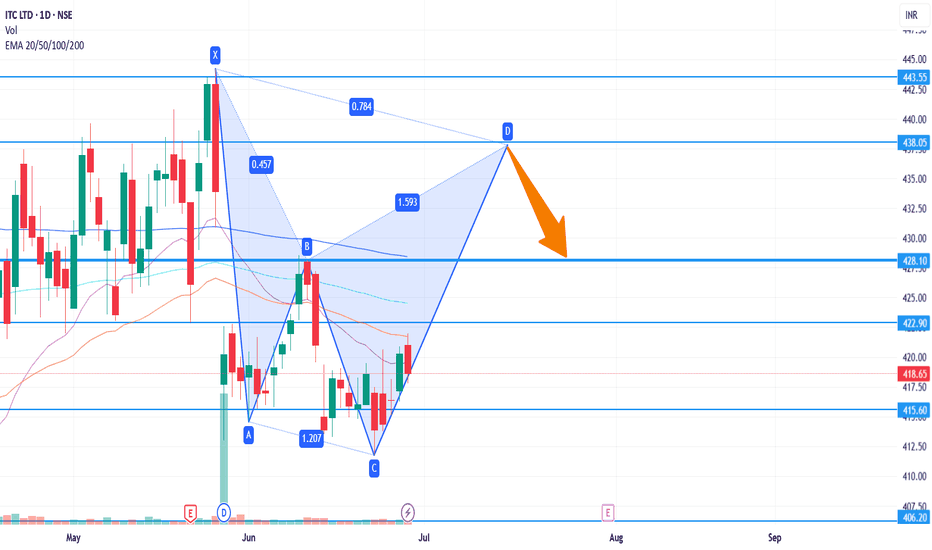
Itclongtermview
ITC Looking WeakITC was in the news since so long time, that after years of pressure, it gave a very good breakout and the stock which people use to tease finally skyrocket and touch its all time high mark...
Now it has formed a Inverted Dow in the chart as you can see and it should be slip upto mentioned level but overall it's positive and after retesting the mentioned levels it will again shot up to another high .....
Educational purpose only....
ITC : Strong momentumITC : Strong momentum
- Filtered from Strategy#1
- near demand zone
- acuumation going on since long time
- up move can be seen in upcoming days
Like, Share, Comment for regular updates.
Disclaimer
I am not sebi registered analyst
My studies are Educational purpose only
Please consult with your Financial advisor before trading or investing
ITC on Hourly Chart Major hurdle 212 ITC hourly chart
Going toward the major support of 200
volume squeezing slowly
can pulled back with volume support
Strict long term stop loss 200 on month close basis
Ang long start above 212
I am not a SEBI registered adviser. All the information provided by me are for educational/informational purposes only. Never invest more then 2 % Capital In Single trade. Trade on your own Risk and analysis


