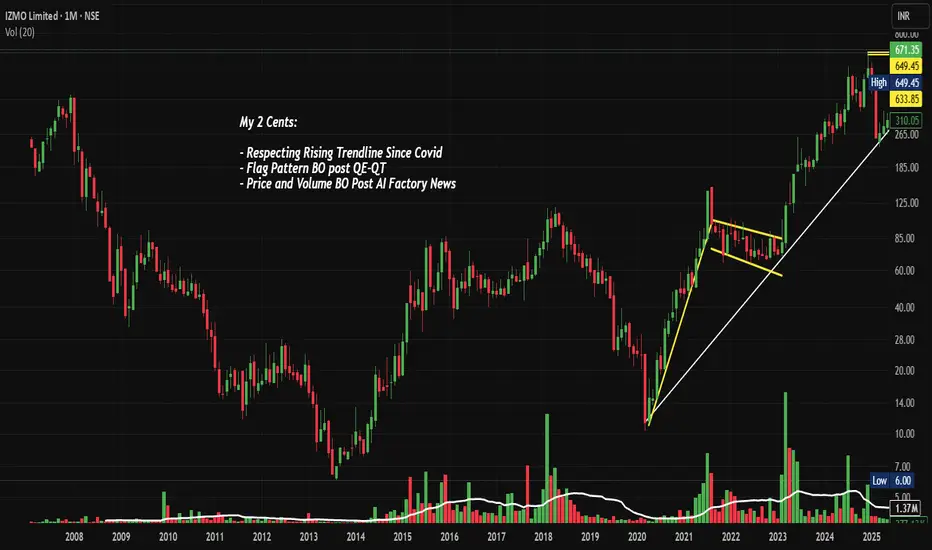
IZMO: From ₹6 to ₹671 - What's Next? Chart of the MonthNSE:IZMO Why This ₹671 Unknown Indian AI Factory Stock Could Be the Next Multibagger in 2025? Let's analyze in the "Chart of the Month"
As per the Latest SEBI Mandate, this isn't a Trading/Investment RECOMMENDATION nor for Educational Purposes; it is just for Informational purposes only. The chart data used is 3 Months old, as Showing Live Chart Data is not allowed according to the New SEBI Mandate.
Disclaimer: "I am not a SEBI REGISTERED RESEARCH ANALYST AND INVESTMENT ADVISER."
This analysis is intended solely for informational purposes and should not be interpreted as financial advice. It is advisable to consult a qualified financial advisor or conduct thorough research before making investment decisions.
Price Action:
- Current Price: ₹671.35 (as of Aug 31, 2025)
- 52-Week Range: ₹230.00 - ₹738.40
- Stock has demonstrated exceptional momentum with 11,000%+ returns since COVID lows
- Currently trading near all-time highs with strong volume confirmation
Volume Spread Analysis:
- Volume spike evident during recent breakout phases
- 13.5M volume this month, showing active institutional participation
- Volume pattern confirms genuine breakout above resistance zones
- Higher volume on up days indicates accumulation by smart money
Key Technical Levels:
Support Levels:
- Primary Support: ₹633.85 (previous resistance turned support)
- Secondary Support: ₹580-590 zone (trend line confluence)
- Critical Support: ₹520-540 (major demand zone)
Resistance Levels:
- Immediate Resistance: ₹738.40 (all-time high)
- Secondary Resistance: ₹800-850 (psychological levels)
- Extended Target: ₹950-1000 (measured move projection)
Base Formation:
- Multi-year base formation from 2020-2022 (₹20-80 range)
- Clean breakout above ₹100 marked the beginning of the current uptrend
- Stage 2 markup phase with consistently higher highs and higher lows
Technical Patterns Identified:
- Cup and Handle pattern completed on a monthly timeframe
- Ascending triangle breakout above ₹600
- Bull flag consolidation pattern near current levels
- Rising wedge formation within broader uptrend (caution signal)
Sectoral and Fundamental Backdrop:
Company Overview:
- NSE:IZMO is a global leader in automotive interactive marketing solutions, providing hi-tech automotive e-retailing solutions across North America, Europe, and Asia
- Founded by Dinanath Soni and Sanjay Vedprakash Soni in 1995, headquartered in Bangalore
Recent Catalysts:
- The company recently launched its Automotive AI Factory, a breakthrough innovation hub to accelerate AI adoption across the automotive industry
- The AI Factory can deliver enterprise-grade AI capabilities at 70-80% lower cost than Western markets
- The hub will deliver customized AI models that optimize pricing and operations while enhancing customer engagement
Financial Metrics:
- Market Cap: ₹1,000 Crores (up 64.5% in 1 year)
- Revenue: ₹234 Crores, Profit: ₹49 Crores
- Trading at 2.78 times book value and 19.6x P/E
- Promoter holding: 34.95%
Sectoral Trends:
- The automotive industry is increasingly adopting AI-driven solutions
- Digital transformation in automotive retail is accelerating post-COVID
- Growing demand for interactive marketing solutions globally
- India emerging as a cost-effective hub for AI and tech services
Key Risks:
- Recent Q1FY26 results showed a -5.52% QoQ revenue decline and -12.9% QoQ net profit decrease
- Concentration risk in the automotive sector
- Currency fluctuation risk due to international operations
Bullish Factors:
- Revolutionary AI Factory launch provides new growth avenue
- Strong technical breakout with volume confirmation
- Global leadership position in niche automotive marketing space
- Cost advantage in AI solutions delivery
- Multi-year base breakout suggesting sustainable uptrend
Risk Factors:
- Recent quarterly performance decline
- Elevated valuation levels
- Potential for profit-taking near all-time highs
- Sector-specific risks and economic sensitivity
Full Coverage on my Newsletter this Week
Keep in the Watchlist and DOYR.
NO RECO. For Buy/Sell.
📌Thank you for exploring my idea! I hope you found it valuable.
🙏FOLLOW for more
👍BOOST if you found it useful.
✍️COMMENT below with your views.
Meanwhile, check out my other stock ideas on the right side until this trade is activated. I would love your feedback.
As per the Latest SEBI Mandate, this isn't a Trading/Investment RECOMMENDATION nor for Educational Purposes, it is just for Informational purposes only. The chart data used is 3 Months old, as Showing Live Chart Data is not allowed according to the New SEBI Mandate.
Disclaimer: "I am not a SEBI REGISTERED RESEARCH ANALYST AND INVESTMENT ADVISER."
This analysis is intended solely for informational purposes and should not be interpreted as financial advice. It is advisable to consult a qualified financial advisor or conduct thorough research before making investment decisions.
IZMO
Stock Analysis: IZMO Ltd. based on the chart and fundamentalsStock Analysis: IZMO Ltd. based on the chart and fundamentals:
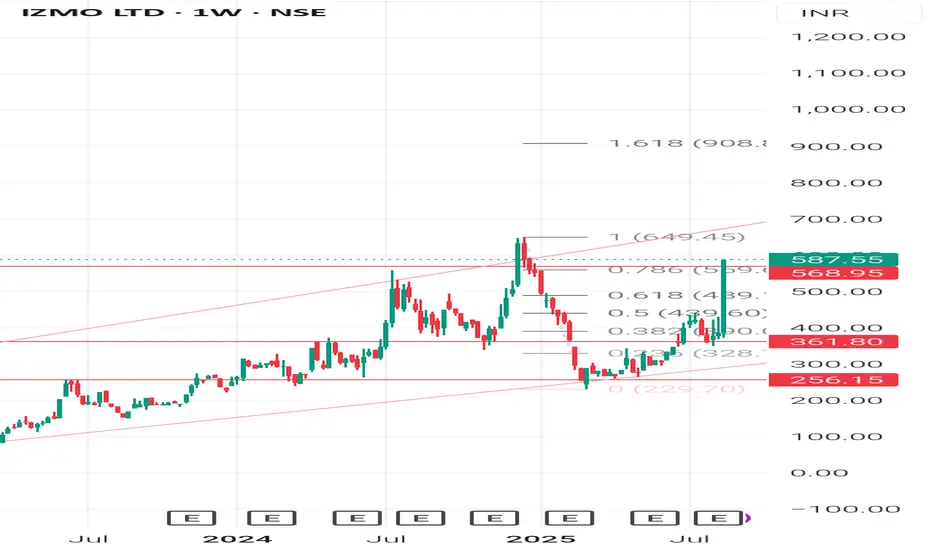
Technical & Chart Pattern Analysis (Weekly Chart)
Current Price: 587.55 (+19.99% last move - strong momentum).
Fibonacci Levels (retracement from high):
0.382 - 390 (past support, now strong base).
0.5 - 439 (intermediate support).
0.618 - 499 (recent breakout level).
0.786 - 559 (crossed successfully).
1.0 - 649 (major resistance).
1.618 - 908 (next extended target).
Support Levels: 499 - 439 - 390.
Resistance Levels: 649 - 750 - 908.
Candlestick Pattern: Recent weekly candle is a strong bullish marubozu (no wick, full green), indicating aggressive buying and potential continuation of trend.
Swing Analysis: Stock bounced strongly from 256 (swing low) and has reclaimed key retracement levels, showing a trend reversal with momentum.
Chart Pattern:
Broke out of falling consolidation with volume.
Trading inside a long-term upward channel.
Target zones: 649 (supply zone) - If broken, 900 becomes visible.
Fundamental Snapshot - IZMO vs Competitors
Ratio / Metric IZMO Ltd. KPIT Tech Tata Elxsi
P/E (TTM) -23x -45x -65x
ROE -17% -20% -28%
Debt-to-Equity Low (<0.2) Low Low
Revenue Growth (YoY) Strong double-digit Moderate Stable
Market Cap -Small-cap Mid-cap Mid-cap/Large-cap
Learning: IZMO trades at a lower P/E compared to KPIT/Tata Elxsi, indicating undervaluation relative to peers if growth sustains. However, liquidity and volatility risk is higher since IZMO is a small-cap.
🎓 Student Learnings from This Chart
1. Fibonacci Retracement works well in identifying support/resistance during upswings.
2. Volume + bullish marubozu candles = trend confirmation.
3. Small-cap IT/auto-tech companies can give sharp rallies but also sharp corrections - risk management is critical.
4. Always compare fundamentals with peers - Lower P/E can mean undervaluation OR slower growth.
5. Invest gradually (SIP style) instead of chasing a rally after 20%+ up moves.
👉Disclaimer
This analysis is for educational purposes only. It is not investment advice. Stock markets are subject to risks. Please consult your financial advisor before investing.
#StockMarketIndia #TechnicalAnalysis #FundamentalAnalysis #SwingTrading #ChartPatterns #CandlestickPatterns #StudentInvestors #LongTermWealth #SmallCapStocks #InvestingBasics
Izmo Limited - Breakout Setup, Move is ON...#IZMO trading above Resistance of 511
Next Resistance is at 915
Support is at 366
Here are previous charts:
Chart is self explanatory. Levels of breakout, possible up-moves (where stock may find resistances) and support (close below which, setup will be invalidated) are clearly defined.
Disclaimer: This is for demonstration and educational purpose only. This is not buying or selling recommendations. I am not SEBI registered. Please consult your financial advisor before taking any trade.

IZMO : Breakout CandidateSwing Setup
IZMO : Risky Trade but worth it
>> Huge TWS Visible on the Left Side
>> Price currently near Bottom of TWS, Spike Expected
>> W pattern also visible which can breakout
>> Inside Bar forming at the Bottom of W pattern
>> Highlighted supply zone : Almost 12% till there
>> If Breaks Supply zone, Another 12% on cards
>> Trendline Breakout also coinciding with W pattern Breakout
>> SL u can consider 380 levels
Risky Trade but so much Learnings, Chart filled with lot of concepts....which is actually lot of confirmations
Totally Worth Trading this setup with low Risk
Swing Traders can lock 10% profit & keep trailing
Please give a Boost or comment if u r Liking the analysis & Learning from it. Keep showing ur Love by following
Disclaimer : This is not a Trade Recommendations & Charts/ stocks Mentioned are for Learning/Educational Purpose. Do your Own Analysis before Taking positions.

Izmo Limited - Long Setup, Move is ON...#IZMO trading above Resistance of 287
Next Resistance is at 406
Support is at 187
Here are previous charts:
Chart is self explanatory. Levels of breakout, possible up-moves (where stock may find resistances) and support (close below which, setup will be invalidated) are clearly defined.
Disclaimer: This is for demonstration and educational purpose only. This is not buying or selling recommendations. I am not SEBI registered. Please consult your financial advisor before taking any trade.

Izmo Limited - Long Setup, Move is ON...#IZMO trading above Resistance of 187
Next Resistance is at 287
Support is at 119
Here is previous chart:
Chart is self explanatory. Entry, Resistances and Support are mentioned on the chart.
Disclaimer: This is for demonstration and educational purpose only. This is not buying or selling recommendations. I am not SEBI registered. Please consult your financial advisor before taking any trade.

Breakout in Izmo Limited...Chart is self explanatory. Levels of breakout, possible up-moves (where stock may find resistances) and support (close below which, setup will be invalidated) are clearly defined.
Disclaimer: This is for demonstration and educational purpose only. This is not buying or selling recommendations. I am not SEBI registered. Please consult your financial advisor before taking any trade.

IZMO - Ichimoku Bullish Breakout Stock Name - Izmo Limited
Ichimoku Cloud Setup :
1). Today's close is above the Conversion Line
2). Future Kumo is Turning Bullish
3). Chikou span is slanting upwards
All these parameters are showing bullishness at Current Market Price
and more bullishness AFTER crossing 134
#This is not Buy and Sell recommendation to any one. This is for education purpose and a helping hand to learn trading in Market.
# Cloud Trading
# Ichimoku Cloud
# Ichimoku Followers
I hope you all like my analysis.
Please do share your thoughts into comment section.
Please give a like, share & subscribe for daily analysis.

IZMO very storng BO and reday for 20% upsideIZMO CMP 121 : The first company to have procured a license to manufacture arms and ammunition in India under the Make in India initiative.
It gave a technical breakout at 104 and now heading for previous high of 149. If crosses 150 and gives weekly close abv that then one can expect another 25% upside.

IZMO longNSE:IZMO
Weekly breakout..
Can be bought at cmp or near 80..
add more near 74..
Tgts are 98.65-118.70-141.8++
SL below 68 weekly candle closing basis


Buy IZMO Long IZMO above 83.8 Target 90-95-113 SL 78 . Stock is moving out the TL & expected to move upward. Can trail SL . This is for your educational purpose only.

IZMO LTDin making of higher high & higher low, good at b/o level above 69 can retest previous high of 90-96 with a SL of 47. I am just learning. Please share your view also on this.

IZMO is consolidated in range wait for confirmation..stock is working on ascending triangle pattern..
120 lvl is important..
If it is cross it with volume.. then you may make long position.
if you are holding it already then wait till below support level as given on chart..
comment your view..
For more query comment below..
i ll happy to see your view, comment and feedback
And follow for such more analysis ....
