$ADA Retested THE Level That Triggered Its Last Parabolic RunCRYPTOCAP:ADA Just Retested THE Level That Triggered Its Last Parabolic Run: History About to Repeat?
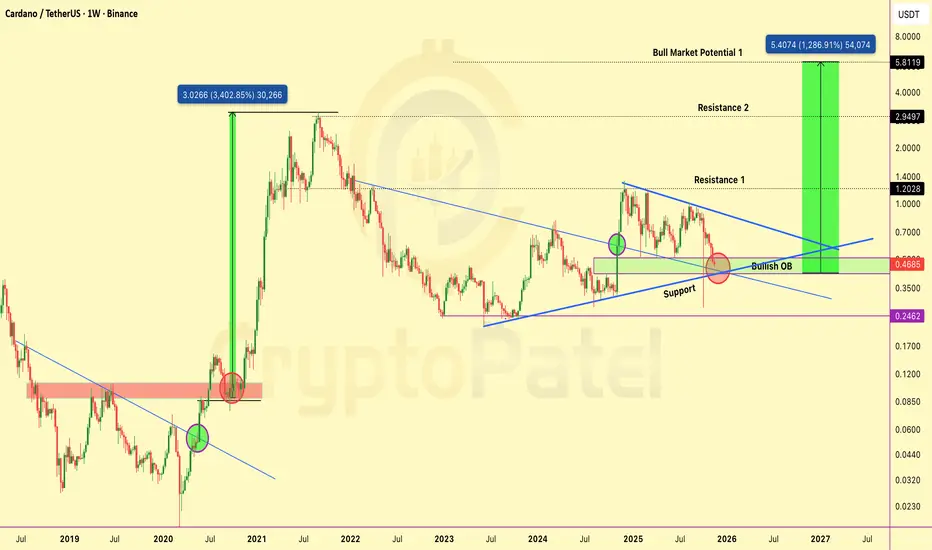
Cardano is again retesting the same multi-year $0.46–$0.35 bullish order block inside the descending wedge that triggered its last explosive cycle. The structure is almost identical, only bigger.
Market Structure:
3+ years of compression tightening toward the apex
Price holding the institutional accumulation zone
Volatility squeeze signaling a high-probability breakout window
Upside Levels: $1.20 → $2.95 → $5.80+
Last time ADA broke this pattern, it didn’t move 30%… it moved 3,000%.
Asymmetric setup. Invalidation below $0.35.
Not financial advice. DYOR.
J-ADA
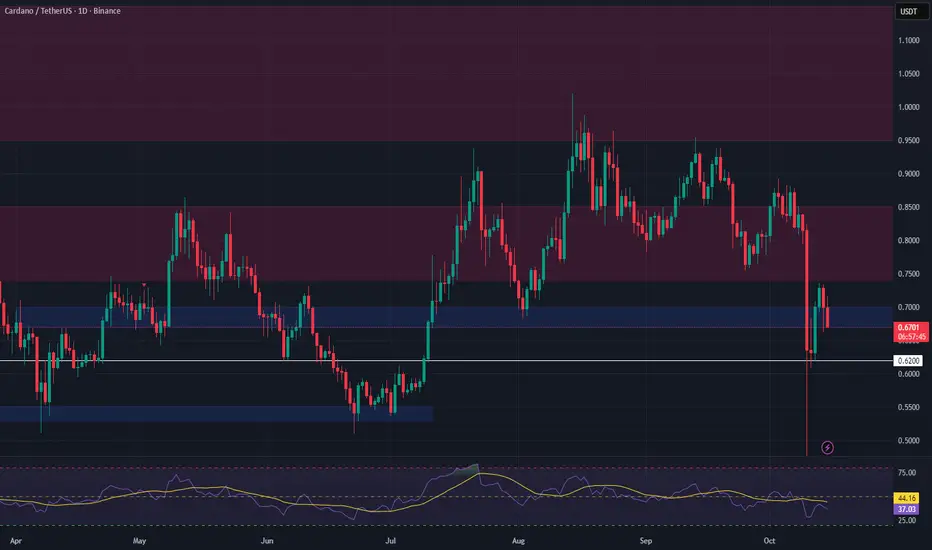
ADA Approaching Major Support – Spot Long Setup in ProgressCardano (ADA) is trending down toward a critical support zone at $0.67–$0.70, which could offer a low-risk entry for a laddered spot long position. The broader crypto market remains cautious, and near-term direction is still unclear—so position sizing and disciplined execution are essential.
🎯 Plan of Action:
Entry Zone: $0.67–$0.70 support, with staggered buys to improve cost basis.
Confirmation Required: Wait for signs of stabilization (e.g., bounce, volume support) before adding further.
Avoid chasing rallies if they lack volume follow-through.
📊 Targets & Risk Management:
Take Profits in Tiers:
First zone: $0.74–$0.85
Second zone: $0.95–$1.15
Stop Loss: Just below $0.62, invalidation of the support structure.
Keep allocation modest—ADA is still in a volatile downtrend.
💡 Reminder: This is a technical setup, not a prediction. Let the chart lead the decision, and stay adaptive to market conditions.
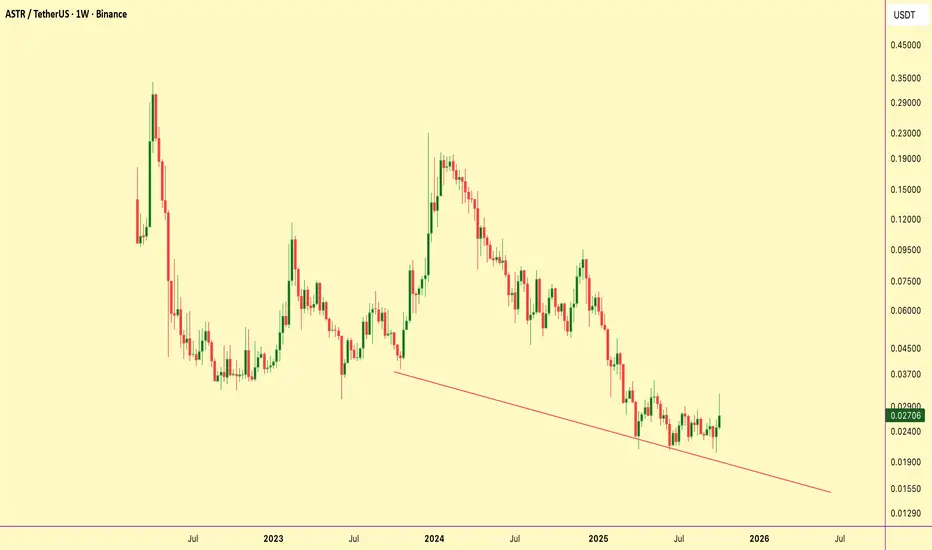
$ASTR gearing up for a breakout from key Order Block!RUS:ASTR showing strong bullish continuation signs on the 4H chart.
Entry Zone: 0.02567 (Bullish Order Block)
Stop Loss: 0.02406
Target: 0.03177 (Liquidity Pool Above)
Technical Breakdown:
🔹 Price broke out with clear bullish displacement after a period of consolidation.
🔹 Now retracing back into a key order block, offering a potential re-entry zone for continuation.
🔹 Liquidity resting above 0.03177 acts as a magnet for price — expect draw-on-liquidity play.
🔹 Market structure is still printing higher highs and higher lows, confirming bullish bias.
Bias: Bullish
Strategy: Order Block Re-entry (4H)
Plan: Wait for confirmation at OB zone before executing longs for continuation toward liquidity target.
Smart Money traders, keep this setup on radar. DYOR, NFA.
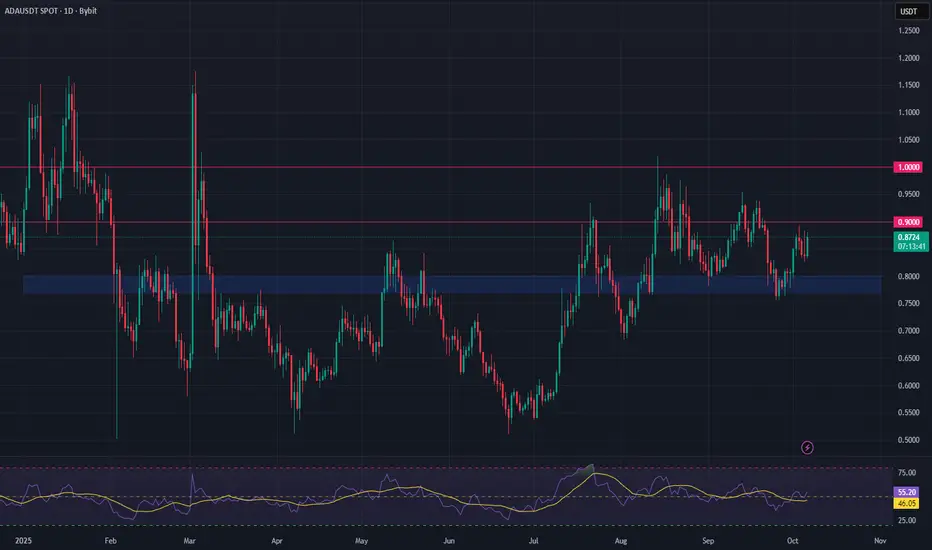
Cardano (ADA) – Bulls Regain Control, Eyes on $0.90 BreakoutCardano had a strong week, managing to hold above key support at $0.77 and closing with a bullish weekly candle. This price action signals a shift in momentum, with buyers back in control.
However, ADA now faces a critical test: the $0.90 resistance level. So far, bullish momentum hasn't been strong enough to force a breakout, but with the broader market showing strength, this level may not hold for long.
A confirmed breakout above $0.90 would be significant, opening the path for a potential move above $1 — a level not seen since mid-2022.
Looking forward, October has started with a strong bullish tone across the crypto market. If this continues, Cardano could be positioned for a fresh rally, provided bulls can take out the $0.90 resistance.
📌 Key Levels to Watch:
Support: $0.77
Resistance: $0.90
Target if breakout confirms: $1+
🟢 Bias: Bullish above $0.77
🔴 Risk: Failure at $0.90 could lead to a retest of support
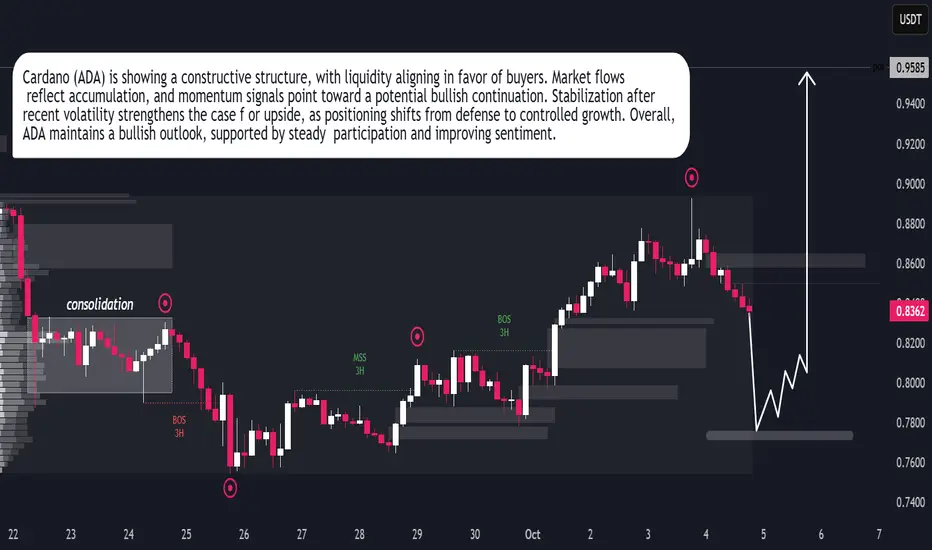
Cardano (ADA) Ready for Bullish ExpansionCardano (ADA) Ready for Bullish Expansion
Cardano (ADA) is building strength as market conditions favor accumulation over distribution. Liquidity behavior shows steady inflows, suggesting participants are positioning for upward continuation. The recent stability reflects confidence, with sentiment gradually tilting toward growth. Momentum indicators align with this view, reinforcing the prospect of a bullish expansion phase. ADA’s structure signals resilience, and the market tone supports the case for sustained upside in the near term.
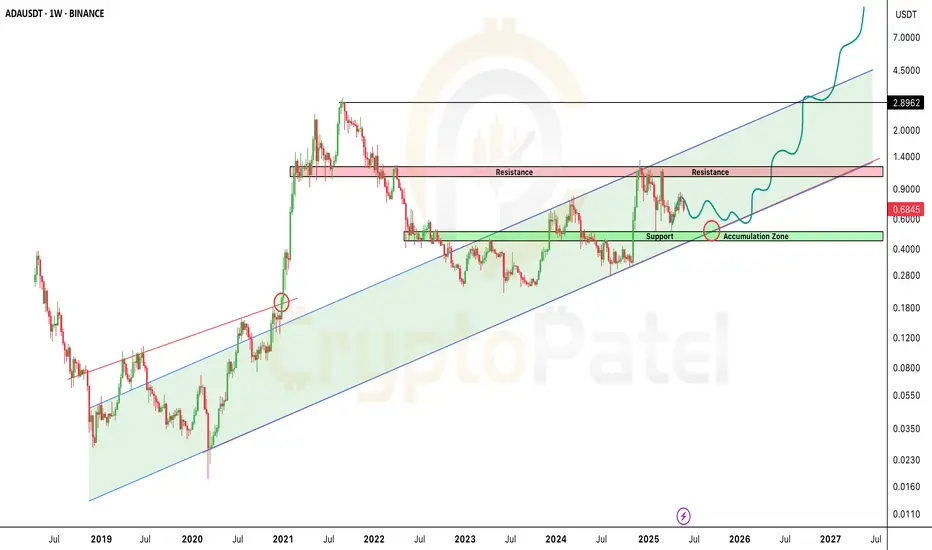
ADA Sitting on Strong Support — Next Big Move Loading?🚨 ADA Sitting on Strong Support — Next Big Move Loading?
Cardano has dropped to around $0.68, but guess what? It's sitting on a major support zone in a long-term bullish channel!
🟩 Accumulation Zone: $0.60–$0.40
This is where smart money enters… historically a STRONG buy zone!
🟥 Next Resistance: $1–$1.20
Break that — and ADA could fly toward $5–$10+ in the coming bull run!
The chart is screaming MEGA RUN ahead — if you're bullish on ADA long-term, this might be your signal.
Not financial advice, but the setup looks Strong.
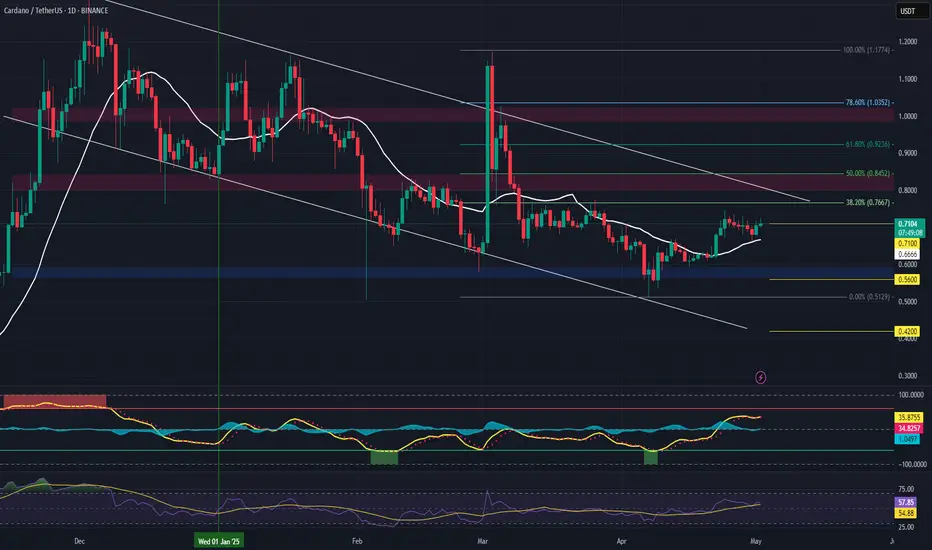
ADA (Cardano) Short Setup – Rejection from Major ResistanceADA is approaching a key resistance zone around the $0.84 level, which aligns with the 50% Fibonacci retracement and yearly open, showing signs of buyer exhaustion and weak momentum.
🔹 Entry:
$0.84 zone (watch for rejection w/ bearish confirmation candle or failed breakout)
🎯 Take Profit Targets:
🥇 $0.71
🥈 $0.56
🥉 $0.42
🛑 Stop Loss:
$0.92 (above key resistance/invalidates setup)
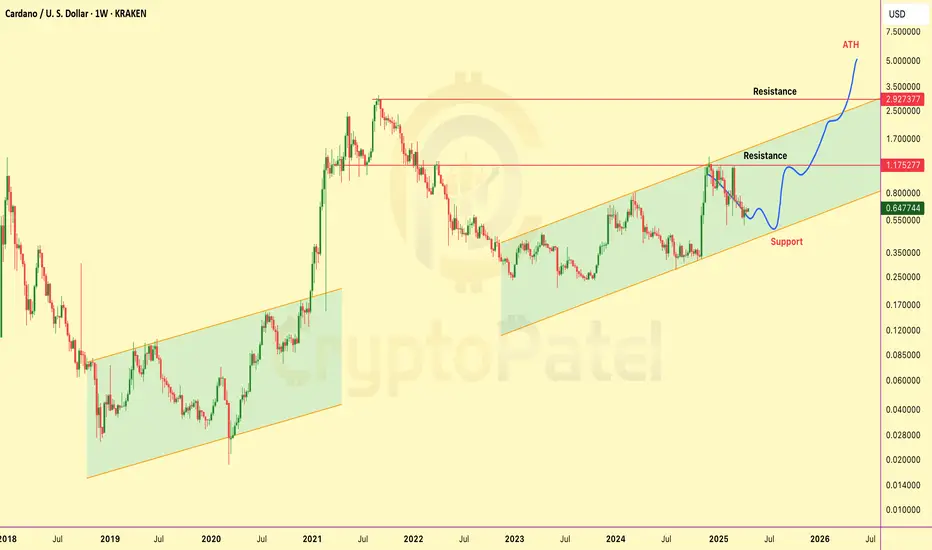
Will ADA hit $5 in bull Market ?CRYPTOCAP:ADA isn’t dead — it’s Loading For $5
The Setup is Clean:
✅ Support at $0.45
✅ Accumulation between $0.65–$0.45
🎯 Targets: $2, $4, $6
Patience here could print fortunes.
ADA-the retest has completed.As you can see from the chart, ADA bounced back right at 200MA creating W parten. I can tell that this is the bottom range ⇗±10% .Go long now with 3x leverage is a wise action.
SL: no need
TP1: $1.2
TP2: $2.5
TP3: $3.8

ChainGPT Holding Strong at $0.140: Can ChainGPT Go Up 1300%?ChainGPT Holding Strong at $0.140: Can ChainGPT Go Up 1300%?
🔹 Current Price: $0.140, sitting at a strong support zone.
🔹 Accumulation Zone: $0.140 - $0.115 (Green box).
🔹 Expectations: Big potential gains for $CGPT!
🔹 Long-Term Target: $1.40 (HTF Parallel Channel Resistance), which is ~1300% from the accumulation zone.
Targets:
1️⃣ $0.180
2️⃣ $0.270
3️⃣ $0.47
4️⃣ $0.80
5️⃣ $1
6️⃣ $1.50 🚀
Stop Loss: If the price drops below the green box, it may turn bearish.

FIL/USDT 5000% Potential ?FIL/USDT Analysis Update
LSE:FIL currently around $4.27, and it’s holding steady at strong support – could see a big move in the days ahead!
Entry Zone: $4 - $3
Targets: $10 / $25 / $48 / $70
Exciting times for #FIL
Let’s watch how this unfolds.

ADA is about to take us on a wild ride! 🎢 💎 Paradisers, #ADA has formed a 'W' pattern at the demand level, and we're currently watching for a breakout from the descending channel.
💎If #ADAUSDT shows a Break of Structure (BOS) from this juncture, We can anticipate a bullish movement. It's advisable to use smaller position sizes here and to seek strong indicators supporting a bullish trend.
💎Should there be a breakdown of this zone, Then we can expect a bounce from the strong support zone, which could offer high-probability setups—exercise caution here.
💎However, if the price doesn't display any bullish signs for confirmation and breaks down below both levels, it would be prudent to wait for more favorable price action to develop and consider the overall crypto market before making any decisions.

Looks like ADA has pulled a sneaky move on traders🕵️💎 Paradisers, it seems that #ADA has trapped traders who entered based on the breakout of the cup & handle pattern.
💎Nevertheless, should #ADAUSDT breach above the previous high, we may anticipate a bullish move, especially considering the bullish market structure signaled by CHoCH & BOS.
💎In the event of a pullback, we could foresee a bounce from the demand level.
💎However, if the price breaks down below the demand level, it may be viewed as bearish, particularly due to CHoCH towards bearish structure. In such cases, it might be advisable to execute scalp trades or abstain from trading, especially for those new to trading.

ADA/USDT 1500% Potental as per Fractal AnalysisCRYPTOCAP:ADA Super bullish 1500% Potential Analysis
1⃣ Congrats #ADA up 70% from our Initial Entry
2⃣ Long Term I am Expecting $5-$10
3⃣ Best Entry: $0.4-$0.5 (Less chances but Placed bid)
4⃣ As per Fractal #Cardano is $15 Potential
5⃣ Big Red Box = Accumulation Zone
6⃣ Strong Support = $0.40 Level
NFA & DYOR

ADA : Bullish Breakout Signals Strength and Potential Upside💎 ADA has broken out of the descending channel and has displayed signs of strength, including CHoCH (Change of Character), BOS (Break Of Structure), and the formation of a W pattern around the 200 EMA. These factors collectively increase the likelihood of a bullish movement.
💎The current zone, previously a resistance area, is now acting as support, as evidenced by historical price action on a larger timeframe.
💎A pullback to the bullish OB levels, coinciding with the Fibonacci golden 0.618 level, is anticipated. This level presents an attractive opportunity for a bounce.
💎However, in the event of ADAUSDT breaking below the demand levels, it would be wise to refrain from seeking bearish opportunities, considering the overall bullish sentiment in the market. Capturing small bearish targets may not be worthwhile in such a scenario.

ADA/USDT 1500% Potential in Next bull MArketCRYPTOCAP:ADA Super Bullish 1500% Potential Analysis:
#CARDANO Entered in Bull Zone as per Fractals.
I'm Expecting $4-$5 Potential in Next Bull Run.
Best Accumulation zone: $0.30-$0.40
Targets: $1.2/$2.95/$5.8
Please Like/Comments if you agree

ADA/USDT: Pattern Convergence Sparks Bearish Warning!💎 Hey ParadiseSquad, let's zoom into ADA/USDT on the weekly chart. We're seeing a unique blend of an inverse cup and handle pattern coupled with an M pattern. This combination is hinting at a bearish outlook.
💎 For this bearish scenario to unfold, we need a confirmed breakdown below the critical demand level of 0.2337. If that happens, we could aim for the next demand zones at 0.1783, 0.1451, and 0.1115. Remember, we're looking for a solid close and retest of this level before considering any bearish moves.
💎 On the flip side, if the price ascends past 0.3770, this pattern would be nullified, signaling a potential bullish reversal.
💎 Keep your eyes peeled and trade smart, ParadiseSquad!

Cardano RSI Bearish Divergence at Resistance ZoneADA/USDT is near resistance price is making higher high, while the RSI is making lower high which is clear sign of RSI Bearish Divergence. We can take short position once price breaks below the support with strong bearish candle. target will be the next support zone. stoploss above the swing high.
Please don't forget to like and follow me.


adausdt cardano cardano broke the resistance in 4hr timeframe we can get a move here in upwards direction


💡Don't miss the great buy opportunity in ADAUSD @CardanoTrading suggestion:
". There is a possibility of temporary retracement to the suggested support line (0.469).
. if so, traders can set orders based on Price Action and expect to reach short-term targets."
Technical analysis:
. ADAUSDT is in a range bound, and the beginning of an uptrend is expected.
. The price is above the 21-Day WEMA, which acts as a dynamic support.
. The RSI is at 56.
Take Profits:
TP1= @ 0.487
TP2= @ 0.504
TP3= @ 0.522
TP4= @ 0.545
TP5= @ 0.583
SL= Break below S2
❤️ If you find this helpful and want more FREE forecasts in TradingView
. . . . . Please show your support back,
. . . . . . . . Hit the 👍 LIKE button,
. . . . . . . . . . Drop some feedback below in the comment!
❤️ Your support is very much 🙏 appreciated!❤️
💎 Want us to help you become a better Forex / Crypto trader?
Now, It's your turn!
Be sure to leave a comment; let us know how you see this opportunity and forecast.
Trade well, ❤️
ForecastCity English Support Team ❤️

ADA Long IdeaADA formed Inverse H & S bottom pattern. and completed retest. One can take a long here with proper stop loss.
