$BNB: Key HTF Decision Zone AheadCRYPTOCAP:BNB : Key HTF Decision Zone Ahead
#BNB is still holding above the critical $700–$550 demand zone, the same area that defines the continuation or breakdown of the current macro trend. As long as price maintains this support, HTF structure stays bullish and the next expansion wave targets $1500 → $2000 → $2500 → $3000.
A weekly close below $550 would flip structure bearish and open a deeper correction toward $250–$170.
Key Levels
Accumulation Zone: $700–$550
Upside Targets: $1500 / $2000 / $2500 / $3000
Invalidation: Weekly close < $550
BNB is at a major decision point: Hold the zone and bullish momentum accelerates; lose it and trend resets.
NFA & DYOR
J-BNB

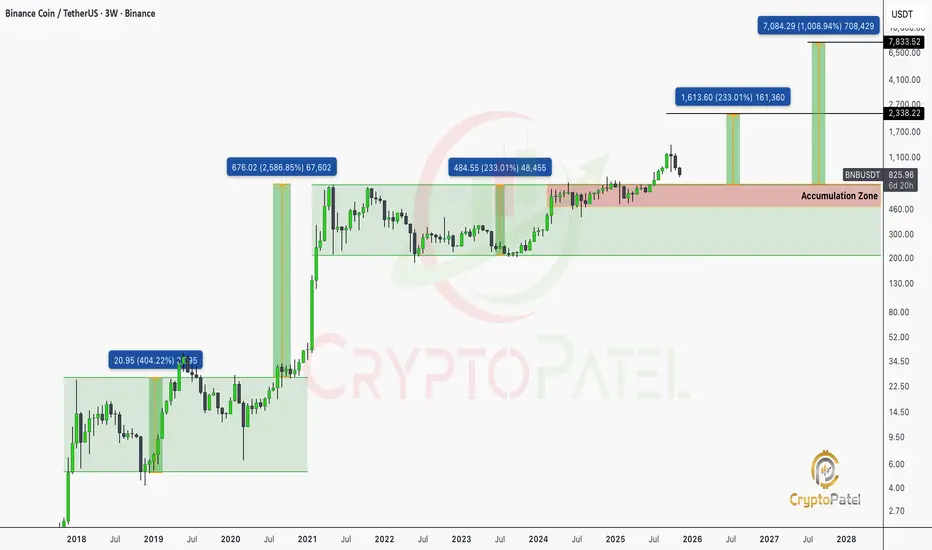
BNB/USDT 3-Week Chart Analysis: Is a Massive Breakout Coming?BNB/USDT 3-Week Chart Analysis: Is a Massive Breakout Coming?
Current Price: $827.05 (down 10.74%)
BNB is currently consolidating in a key Accumulation Zone between $700-$800, signaling institutional accumulation and balance.
Key Levels to Watch
Support Zones:
🔹 $484.55 – Critical demand from 2023 lows
🔹 $676.02 – Former ATH turned support
🔹 $700-$750 – Bottom of current accumulation
Resistance Targets:
🔹 $1,613 – First major upside
🔹 $2,338 – Next intermediate target
🔹 $7,084 – Long-term “moonshot” scenario
Volume & Structure Insights
🔹 2019 Breakout: Started the long-term uptrend
🔹 2021 Bull Run: Peak at $676, classic blow-off top
🔹 2024-2025 Accumulation: Renewed institutional interest
Bearish Risk
🔹 Failure to hold $700 → Retest $484 (-41%)
🔹 Breakdown below $484 → Bullish thesis invalid
NFA & DYOR
BITCOIN JUST DID EXACTLY WHAT WE DISCUSSED: CURRENT UPDATEBITCOIN JUST DID EXACTLY WHAT WE DISCUSSED: CURRENT UPDATE
CRYPTOCAP:BTC bounced perfectly from the 0.786 Fib ($83,308), The FINAL bullish support.
Now trading above $86,500, already +5–6% up from the exact level I alerted.
As long as BTC holds $83,308, upside relief rally remains active:
$88,000 (FVG)
$93,000 (Bearish OB)
$98,000 (FVG inefficiency)
But… if BTC loses $83,000, say hello to the $66,000 demand zone, The next real bullish orderflow.
For now: Structure is bullish above 0.786, cautious below it.
(NFA / DYOR)

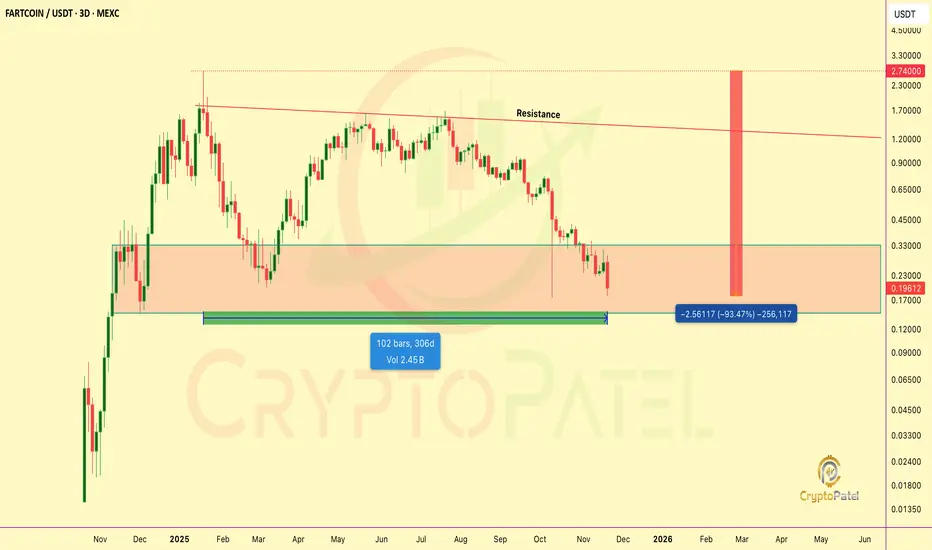
FARTCOIN COLLAPSES BELOW $200M: END OF AN ERA?FARTCOIN COLLAPSES BELOW $200M: END OF AN ERA?
Fartcoin has officially plunged 94% from its January ATH, now trading around $0.18.
On-chain data (Arkham) shows Wintermute slashing its holdings from nearly 3% of supply → just 0.24%, triggering fears of a major market-maker exit.
Rumors point to an expiring dev loan driving aggressive sell-offs and mixed sentiment:
🔻 Bears: calling for $0.10
🔼 Bulls: eyeing an unlikely but possible $1-$2 rebound
Despite the wreckage, perp volumes remain high and funding flipped deeply negative, often a setup for short-term relief bounces in memecoins.
Volatile conditions ahead. Stay sharp.
NFA & DYOR
BITCOIN WEEKLY RSI SIGNAL JUST REPEATED – BIG MOVE LOADING? BITCOIN WEEKLY RSI SIGNAL JUST REPEATED – BIG MOVE LOADING?
This chart shows something MAJOR:
Across the last 5 market cycles, Bitcoin only touched this RSI demand zone at the bottom right before massive reversals:
1️⃣ 2015 bottom
2️⃣ 2018 capitulation
3️⃣ 2020 COVID crash
4️⃣ 2022 bear-market low
5️⃣ NOW: 2025 RSI touch again
Each time BTC hit this level → it triggered one of the strongest trend reversals of the cycle.
And now we’ve hit it again while price is consolidating inside the green accumulation zone.
Historically, this has been the highest-probability long-term opportunity zone in every cycle.
If history rhymes, the next big move might be closer than people think.
Stay sharp. NFA.

$BTC STANDING ON ITS LAST SUPPORT: READ THIS BEFORE YOUR TRADEBITCOIN TECH UPDATE — FRESH LEVELS, FRESH PAIN
CRYPTOCAP:BTC just dumped to $80,641, making a new low since 12 April 2025.
That’s almost -30% from my Short + Exit levels.
Those who Rode the Short, Enjoy the profits.
Those who avoided chasing above $120k, capital saved again.
Where We Stand Now
Bitcoin is sitting exactly on the 0.786 Fib ($83,300), the strongest bullish support left on the chart.
This level = Bulls’ last hope.
If daily candle doesn’t close below $83,300, then expect a relief rally into upside inefficiencies:
Upside Targets (If 0.786 Holds)
$88,600 → major unfilled FVG
$93,000 → bearish Order Block (high probability fill)
$98,000 → another upside FVG waiting to be delivered
Watch how price behaves at these levels — next macro move will be decided there.
If 0.786 Fib Breaks…
Be ready.
Next liquidity pools: $73,000 / $66,000
Both zones have massive bullish orderflow waiting.
If 0.786 support holds → BTC still has high probability to push for a new ATH.
Summary:
Trend still bearish, but BTC is now at a critical support.
Hold → relief rallies + possibly new ATH.
Break → $73k–$66k incoming.
Stay sharp. Watch the levels. Trade with intention.
NFA &" DYOR

BNB/USDT – Bullish Reversal Idea | Demand Zone Reaction📌 Overview
BNB is currently trading at a major higher-timeframe demand zone, showing early signs of accumulation after a sharp sell-off. Price has tapped the demand area multiple times and is holding without breaking structure to the downside.
This setup is based on a potential short-term reversal or a relief bounce.
📍 Analysis
🔹 Demand Zone
Price is reacting from a clean demand zone created by previous strong bullish displacement.
Multiple wicks show buyers defending this level.
🔹 Market Structure
Prior strong downtrend
Price now consolidating at support
Lower timeframe shows slowing bearish momentum
🔹 Entry Logic
A long entry is placed at the reaction zone, anticipating a bounce toward the nearest inefficiency / supply zone above.
🎯 Trade Setup
🟩 Long Position Idea
Entry: At demand zone
Stop-Loss: Below the liquidity wick / zone low
Take-Profit: Previous structure high or the first major supply zone above
This gives a clean R:R setup (as shown in chart).
⚠️ Risk Management
Only risk what you can afford to lose
If the zone breaks cleanly, setup is invalid
Wait for candle confirmation if you want safer entry
📌 Final Thoughts
BNB is at a critical make-or-break level. If buyers hold this zone, a strong bounce is likely. If not, expect continuation lower.
Publishing this to track market reaction and trade execution.

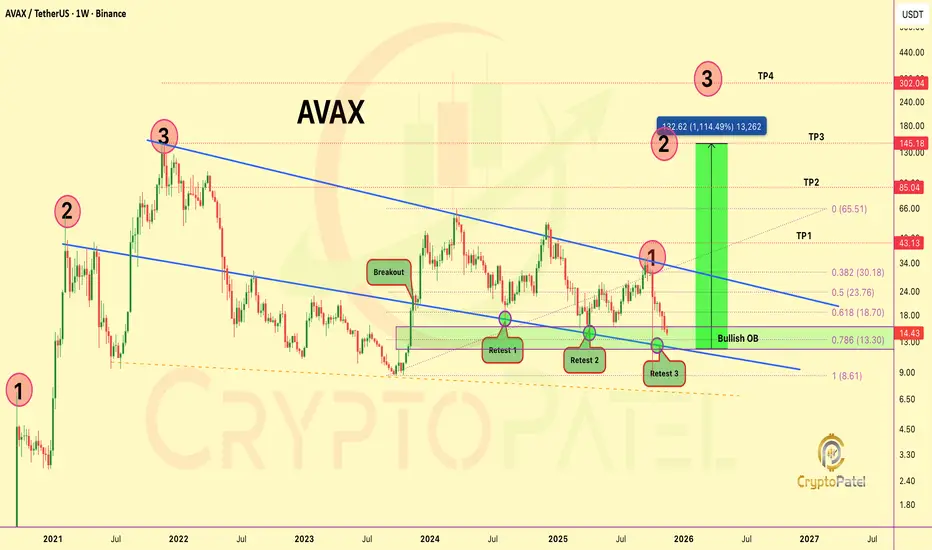
$AVAX IS SITTING ON A MACRO LEVEL YOU CAN’T IGNOREAVAX IS SITTING ON A MACRO LEVEL YOU CAN’T IGNORE
AVAX just Tapped a 4-year Demand Cluster:
Bullish OB + 0.786 Fib + long-term wedge support, the same region that triggered every major reversal since 2021.
This is Retest #3, where high-timeframe structures typically shift from capitulation → accumulation.
Liquidity below the range is cleared. Sellers are exhausted. Volatility is compressed to extremes.
If this Base Holds, the Upside Map is already Defined:
$43 → $85 → $145 → $302 (Full wedge expansion potential: ~1,100%)
This is the kind of level where institutions position quietly while retail exits loudly.
IMO, the Best Long-run Accumulation Range remains $15–$11.
Note: NFa & DYOR
CRYPTO MARKET JUST LOST $1.25 TRILLION🚨 CRYPTO MARKET JUST LOST $1.25 TRILLION: THIS IS NOT NORMAL 🚨
In just 42 days since the Oct 6 top, the market has wiped out a massive -$1.25T, A -28% collapse from the $4.27T peak → $3T zone.
This $3T level is the final line before a full liquidity vacuum.
If it breaks, volatility turns violent. Stay sharp.
NFA & DYOR

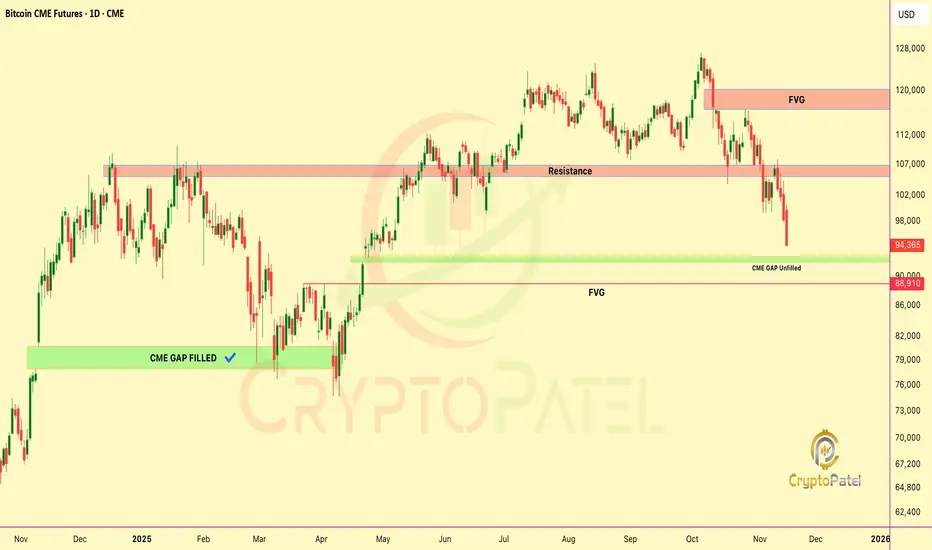
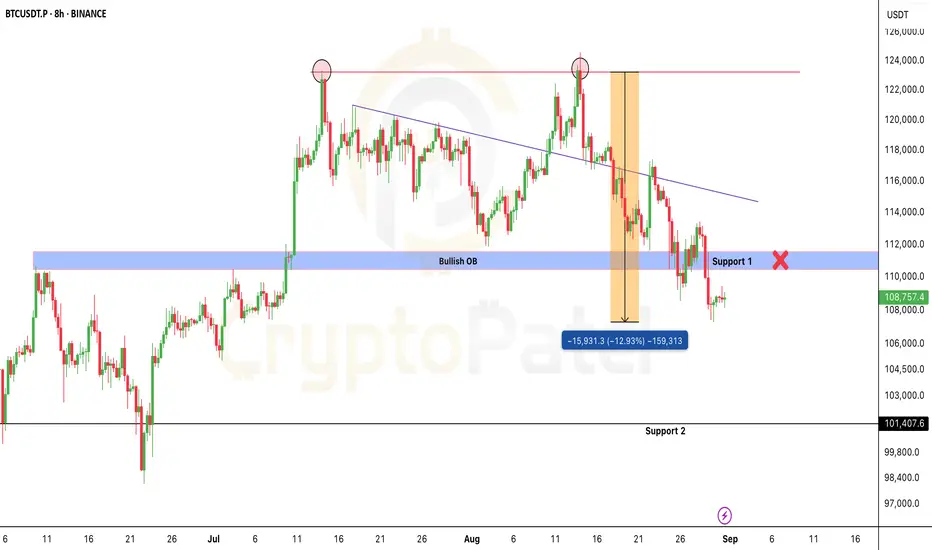
Bitcoin Next move $70k or $120k?CRYPTOCAP:BTC Is About to Bounce From the Level Everyone Is Ignoring
CME Gap 👉 $91,170
FVG below 👉 $89,020
Both zones = liquidity magnets.
No upside CME gaps left… only 1 upside FVG at $120,370
My view:
Fill → Sweep → Strong bounce expected from $89K–$91K range.
Next major draw = $120K FVG.
NFa & DYOR
BITCOIN TECH UPDATE: BEARISH DOMINATES MUST READ🚨 BTC TECH UPDATE: BEARISH DOMINATES MUST READ 🚨
CRYPTOCAP:BTC is down 14% from my bearish short at $115,000 retest.
✅ Those who shorted, well played.
✅ Those who avoided longing at the top, capital saved.
Price Action:
#BITCOIN hit 1st support and broke below, trend remains bearish.
Next target: $94,000.
Short-Term Relief:
Expect a bounce toward $105,000–$108,000 (retest + FVG zone) before the next leg down.
Longer-Term:
$94,000 key decision zone → potential drop to $76,000 if bearish momentum continues.
Will update with precision once $94k is reached.
Sentiment: Bearish as forecasted from $115k.
Bullish Trigger:
If BTC breaks $111,500 with HTF candle close, bullish scenario activates → potential ATH toward $150,000.
Trade smart. Watch levels. Manage risk.
Your move: Ride the bearish wave or wait for the relief rally?
NFA & DYOR

BTC First Weekly BB Break Since March: This Changes EverythingFirst Weekly BB Break Since March: This Changes Everything!
Bitcoin is currently testing a key support zone around $104K, forming what appears to be the 5th major support retest in this ongoing bullish cycle.
Historical Pattern Insight:
Each of the previous four support retests (1–4) led to substantial rallies ranging from +70% to +200%, as shown in the green zones.
If the pattern repeats, the next potential upside move (Wave 5) could project CRYPTOCAP:BTC toward the $200K region, marking a ~100% upside from current levels.
New Technical Development:
This week marks Bitcoin’s first breach of the lower Bollinger Band (BB) on the weekly timeframe since March, signaling heightened volatility and potential exhaustion of the current corrective phase.
Bearish Scenario:
A confirmed breakdown below this critical support could trigger a deeper correction toward the $50K area (–55%), similar to previous cycle corrections highlighted in red.
Key Levels to Watch:
🔹 Support: $103K–$100K
🔹 Resistance: $110K, then $135K
🔹 Upside Target: $200K
🔹 Downside Risk: $50K
Indicators:
Bollinger Bands remain squeezed, indicating volatility expansion is near. The weekly mid-band continues to act as dynamic support, but a sustained close below it could shift the bias short-term.
🟩 Bullish Bias remains valid above $100K, invalidated only on a weekly close below support.
🟩 Pattern repetition or deviation here will define Bitcoin’s next macro leg.
NFA & DYOR

While others panic, $VIRTUAL is Breaking out. Next leg incoming!While others panic, SPARKS:VIRTUAL is Breaking out. Next leg incoming!
While the whole market is bleeding, SPARKS:VIRTUAL is quietly showing strength and breaking its long-term bear trendline, this is not just noise, it’s a confirmed shift in market structure.
Technical Outlook:
🔹 Price has flipped into bullish mode on HTF structure.
🔹 Holding above $1.35 keeps momentum alive, this is the key level for continuation.
🔹 Next resistance targets: $5 → $7 → $10 zone.
🔹 A dip below $1.35 could retest the $1.00 demand area, a golden entry for strong hands.
🔹 Only a confirmed close below $0.70 would invalidate the long-term bullish setup.
Sentiment Check:
While others panic, smart money is accumulating. The trend reversal is already in play, early positioning matters most.
SPARKS:VIRTUAL has officially flipped the script.
If price holds structure, expect a massive momentum rally once the market stabilizes.
Remember: Fear creates opportunities. Charts don’t lie, price action speaks louder than noise.
Not financial advice. Do your own research.

This Coin Could 10x in the Next Bull Run: Don’t Miss ItThis Coin Could 10x in the Next Bull Run: Don’t Miss It
GETTEX:TAO is showing strong bull-market potential, already up 80% from our entry zone.
Key Updates:
Broke strong resistance at $460 → now support
If it holds, next targets: $1000–$1200, ultimate $2000
Book profits along the way, no one predicts markets 100%
Smart traders watch levels, not FOMO.
NFa & DYOR

$LINEA WARNING: Bearish Pressure + Accumulation Opportunity Ahea$LINEA WARNING: Bearish Pressure + Accumulation Opportunity Ahead!
Chart Analysis Recap:
Previous exit signal: $0.025 → #Linea is now ~50% down ✅ confirms chart-based strategy.
Current trend: Super bearish; expecting further downside 20%-40% before the next upward leg.
Long-Term Potential:
@Linea.eth could give 10x returns, targeting $0.1–$0.2, but success depends on smart entry points.
Key Strategy:
Ideal accumulation zone: below $0.01 for long-term holders.
Trade smart, enter on hard dips and manage risk.
Takeaway: Patience + technical discipline = positioning for potential massive upside.
NFa & DYOR

Bitcoin Is Flashing a Major Warning Signal Right NowBitcoin Is Flashing a Major Warning Signal Right Now ⚠️
KEY LEVELS:
Resistance: $123K (triple top) & $115.9K barrier
Support: $106K - CRITICAL level
BEARISH PATH (if $106K breaks):
→ Target 1: $91K (-18%)
→ Target 2: $79K (-28%)
BULLISH SCENARIO:
Reclaim $115.9K & break $123K to invalidate bearish structure
STRUCTURE ANALYSIS:
▶️ Lower highs forming = Reversal signal
▶️ Weakening momentum post- New ATH
▶️ Distribution pattern visible at resistance
STRATEGY:
✅ SHORT: Below $106K | Targets: $91K-$79K
✅ LONG: Above $115.9K | Stop: $106K
The chart doesn't lie. $106K is the line in the sand.
Risk management > predictions.
Trade smart. Adapt fast. Survive longer.
CRYPTOCAP:BTC #Bitcoin
NFa & DYOR

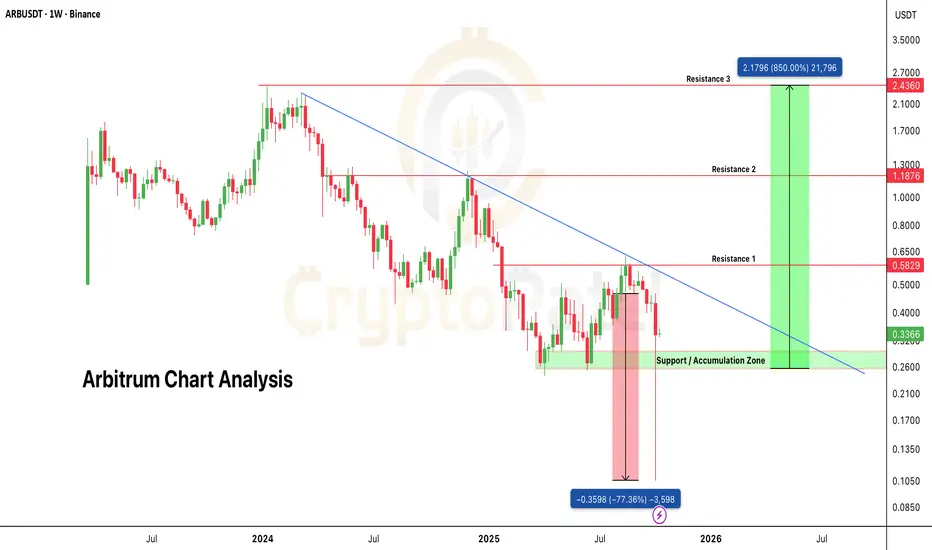
Whales loading $ARB – next 10x play in the makingWhales loading AMEX:ARB – next 10x play in the making
ARB/USDT faced a heavy sell-off during the recent crash, dropping over 77% within hours. But here’s the twist, it bounced back 238% from that low, showing strong market confidence.
What’s even more impressive: price never closed below the key support at $0.25, confirming this zone as a strong accumulation area for the long term.
Technical Overview:
Structure: Higher highs and higher lows forming after reclaiming demand zone
Support Held: $0.25 zone defended multiple times
Momentum: Bullish recovery with strong volume inflow
Bias: Long-term accumulation
Spot Accumulation Zone: $0.30 – $0.25
Targets: $0.58 / $1.18 / $2.43
Long-Term Potential: If the upcoming Altcoin Season kicks in, AMEX:ARB has the strength to deliver up to 10x returns from the current range.
NFA & DYOR
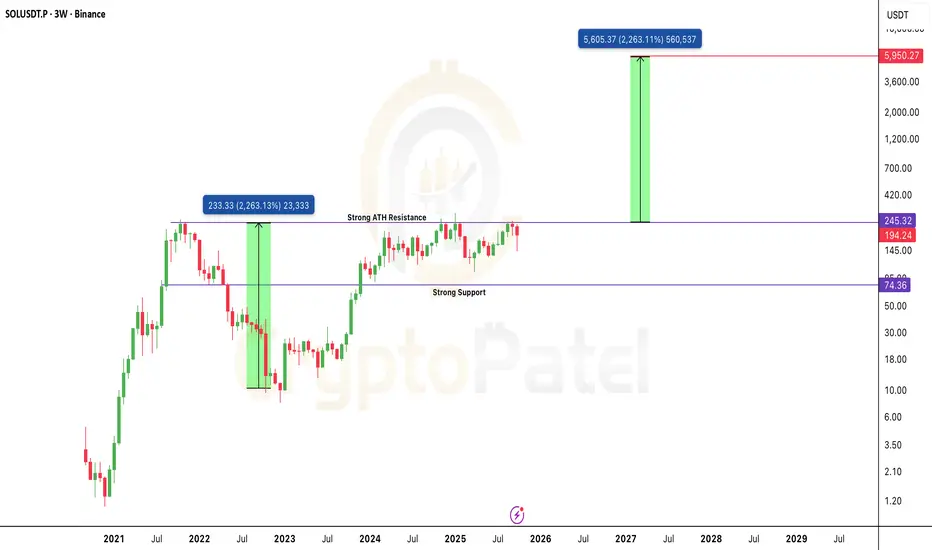
The Chart That Could Send $SOL to $6,000: Cup & Handle on 3W TFThe Chart That Could Send CRYPTOCAP:SOL to $6,000: Cup & Handle on 3W Timeframe
Solana is shaping one of the cleanest Cup & Handle patterns on the 3-Week chart, a formation that often signals the start of a massive long-term rally.
Technical Structure
🔹 Cup formed: $260 → $8 → back to $245 — a perfect rounded recovery base.
🔹 Handle forming: Price consolidating between $140–$245, building pressure before breakout.
🔹 Breakout trigger: Clean close above $245 (ATH zone) will confirm the move.
🔹 Targets:
– First target: $480–$500
– Extended target: $2,000–$6,000 if momentum mirrors the last 2200% run.
🔹 Major Support: $74–$90 zone.
What this really means: Solana is quietly preparing for its next macro expansion phase.
A confirmed breakout above ATH could kickstart one of the strongest alt rallies of this cycle.
Bias: Bullish on breakout confirmation
Timeframe: 3W / Long-Term Swing Setup
Plan: Watch $245 zone closely, breakout with volume = game on.
Note: NFA & DYOR
Will $SEI hit $2 in current bull market?NYSE:SEI up 140% from my initial entry, but I'm targeting an 800% gain from current levels 🚀
Looking at $2 as a key target in this bull run — strong support, bullish structure, and key levels lined up.
Let’s see if NYSE:SEI can make this move 💎
NFa & DYOR

BNB 400% up from our Entry People laughed when I said CRYPTOCAP:BNB will hit $2000–$3000.
but people still doubt my $2000–$3000 targets? 🤔
From 1st Entry of this bull run: +400% ( TP1 ✅ )
From $500 re-entry: +120%
You can doubt targets, but not momentum.
Just don’t forget — book profits.
Because trading without a safe zone = casino mode.
Not Financial Advice

Bitcoin Chart Analysis And Bearish overview #BTC Bearish Outlook
Bitcoin stays bearish below $113,400.
No H4 close above = downtrend intact, targeting the $100K psychological level.
Break $100K support, and liquidity near $90K becomes the next magnet.
Key levels:
$113,400 → HTF resistance
$100,000 → Psychological support
$90,000 → Demand zone
Already 13% down from our short entry, hope you caught the move. 🫡
NFA & DYOR
BNB/USDT – Bullish Breakout Trade Idea✅ Entry: 871.564
🎯 Target: 890.455
⛔ Stop Loss: 862.304
🔎 Trade Rationale:
Ascending Triangle Breakout – Price has respected the rising trendline and finally broken above the neckline resistance, signaling bullish continuation.
Volume Confirmation – A notable increase in buying volume supports the breakout strength.
Resistance Flip – The previous supply zone around 870 has turned into support, adding confluence.
📊 With a strong bullish structure and favorable RRR, this setup aims to capture the next push towards 890 zone.
⚠️ Disclaimer: This is not financial advice. Always do your own research and manage risk before trading.

#ETHEREUM – Macro Breakout Setup#ETHEREUM – Macro Breakout Setup 🚀
▶️ 6th time in history testing $4K macro resistance.
▶️ A clean weekly close above could ignite HTF expansion to $8K → $10K → $15K.
6 rejections in 4 years… one breakout can change it all.
NFA & DYOR
