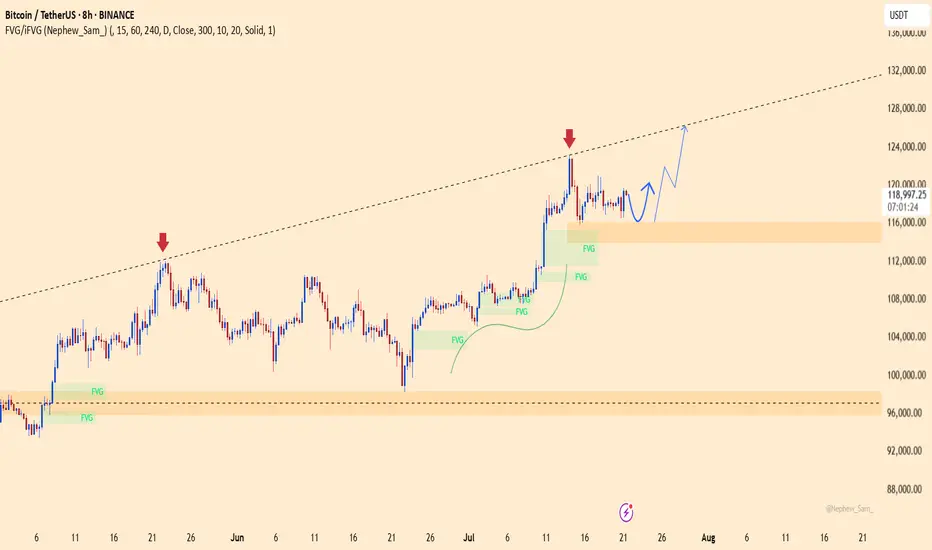
BTCUSDT – pressure building before the breakoutMarket context:
US trade policy eases restrictions for certain major tech companies → risk appetite improves.
Expectations of a more dovish Fed → capital flows return to the crypto market.
Sentiment & flows:
Short-term Bitcoin holdings increase by around 20 billion USD → trading activity is heating up, but profit-taking pressure is also building.
Investors are closely watching the 116,000 USDT level before adding aggressive long positions.
8H technicals:
Support: 112,600 USDT – a zone that has repeatedly triggered rebounds, maintaining the bullish structure.
Resistance: 116,000 USDT – the “gate” that could open the way to 123,000 USDT.
Bullish scenario remains favored if price closes above 116,000 USDT with confirming volume.
Key takeaway:
The market feels like it’s “winding the spring” – tight consolidation before a potential breakout.
A break below 112,600 USDT would invalidate the short-term bullish view and increase the risk of a deeper pullback.
J-USD

Bitcoin targets $133,000 with institutional capital inflowsBitcoin is currently trading in an upward channel, forming higher highs and higher lows, indicating a strong bullish trend.
Capital inflows from major financial institutions like JPMorgan and Citigroup are increasing into BTC, combined with expectations that the Fed will cut interest rates in September, providing positive momentum for the price. The Trump administration's cryptocurrency policies and Syz Capital reopening its BTC Alpha fund with 2,000 BTC have driven strong participation from institutional investors.
Technically, BTC has bounced off the support at $112,816 and could continue toward the resistance at $119,249. A break above this level could set the next target at $133,000 by the end of 2025. Investors should carefully monitor signals and manage risk accordingly.

BTCUSDT – Institutional Money Returns, Signs of a Strong ReboundBitcoin is showing positive recovery signals as major capital flows are re-entering the market. Notably, Syz Capital has successfully raised $200 million to invest in BTC – a strong indicator of growing long-term confidence from institutional investors.
On the H8 chart, BTC remains in a downtrend channel but is forming an accumulation pattern around the 111,000 USDT support area. Previous FVG zones have been filled, suggesting buying pressure is absorbing supply well. Volume is also slightly increasing at the lows – indicating selling pressure is weakening.
If BTC holds above 111,000, a move toward 117,500 is likely, with potential to reach 120,000 if it breaks above the descending channel. This would confirm a clearer medium-term uptrend.

BTCUSDT – Bullish trend remains intactBitcoin is still trading within a long-term ascending channel. After a mild pullback to the FVG zone around 112,100 USDT, the price rebounded and is now consolidating above the ascending trendline support. If this level holds, BTC is likely to continue toward the upper channel target at 122,500 USDT.
Recent news supporting the uptrend:
Fidelity and BlackRock have continued accumulating Bitcoin-related ETF shares.
Weak US jobs data has fueled expectations of a Fed rate cut, drawing capital back into crypto.
Ethereum's upcoming hard fork upgrade is boosting overall market sentiment.
With both technical structure and fundamentals aligned, BTC remains bullish as long as it stays above 112,100.

BTCUSDT – Bitcoin consolidates amid silent institutional buying Bitcoin is fluctuating between 114K and 116K USDT within a long-term ascending channel, supported by a wave of positive news. Weaker-than-expected U.S. labor data has fueled hopes that the Fed may pause its rate hikes — boosting sentiment for risk assets like BTC.
At the same time, major regulatory developments such as the SEC’s “Project Crypto” and the GENIUS Act by the CFTC are laying the groundwork for legalizing the crypto market. Notably, over 30,000 BTC were accumulated by MicroStrategy and institutional funds within just 48 hours — signaling strong capital inflows.
On the daily chart, BTC is forming an inverse cup-and-handle pattern, with 107,280 acting as key support. If the price holds and breaks above 120,872 USDT, a rally toward 130K may follow. However, if inflows weaken, a short-term pullback toward 112K could occur before the next upward move.

BTCUSDT – short-term pullback before heading higherBTCUSDT remains within a clear ascending channel. On the H8 timeframe, price is facing resistance and may pull back toward lower support before continuing its upward move. Several Fair Value Gaps below act as strong backing zones for buyers.
On the news side, market sentiment is improving as investors anticipate the upcoming PCE report and renewed interest in Bitcoin ETFs. Although the Fed holds its hawkish tone, rising recession risks are fueling expectations of a rate cut later this year.
Strategy: Consider BUY setups if price pulls back into support and shows strong reaction. Trend remains bullish unless the ascending structure is broken.

BTCUSDT – Ready to Break the Resistance Wall?Bitcoin just made a perfect rebound from the $115,000 support zone and is now gathering momentum toward the $119,097 resistance. While price remains inside the descending channel, price behavior suggests a potential bullish breakout.
Latest news:
Grayscale confirmed an additional $1.2 billion investment into its Bitcoin fund.
The Fed is signaling a possible pause in rate hikes at the upcoming meeting → weakening USD → direct boost for BTC.
Technical outlook:
FVG zones have been filled → selling pressure is fading.
A “bounce – retest – breakout” formation is emerging.
The descending channel is under pressure, and buyers seem to be gaining control.

BTCUSDT – Charging Ahead in an Ascending Channel, Eyes on 120K!Bitcoin is gliding steadily within a rising channel, consistently printing higher highs and higher lows. After tagging the 120K psychological zone, price made a healthy pullback to key support and bounced back swiftly — reaffirming buyer dominance.
Price action reveals sustained bullish momentum, especially with key U.S. economic data on the horizon. If risk-on sentiment holds, BTC is well-positioned to break past psychological resistance and unlock the next leg higher.
This pullback? It’s not weakness — it’s a setup. And the market is gearing up for another breakout move.

BTCUSDT – Rebounding from Fair Value Zone! Is the Bull Run Back?Bitcoin is building a strong base around the FVG support zone after rejecting the resistance trendline twice in a row. The current price structure is a textbook bullish setup: pullback – retest of liquidity zone – accumulation – and now prepping for a strong breakout.
Fair Value Gaps have been consistently filled and are acting as dynamic support, signaling that buyers are still in full control. RSI remains steady and not overheated – creating perfect conditions for a breakout.
Target: The 125,910 USDT area is the next clear price objective if BTC holds above the 116,082 USDT support zone.
Fundamental Catalyst: The crypto market is regaining strength after BlackRock officially confirmed its plan to expand its crypto ETF products – investor sentiment is back on the bullish side.
BTCUSDT – Breakout confirmed, bullish momentum continuesBTCUSDT has officially broken above a long-standing resistance channel, confirming a breakout and establishing a base around the nearest Fair Value Gap. The price action maintains a clear uptrend structure with consecutive higher lows and higher highs, supported by consistent buying pressure after minor pullbacks.
In terms of news, the U.S. decision to temporarily delay stricter regulations on spot Bitcoin ETFs, along with stable interest rate signals from the Fed, has boosted market sentiment. Capital continues to flow into crypto, especially as altcoins show limited recovery, making BTC the preferred asset.
As long as BTCUSDT holds above the nearest support zone, the pair is likely to advance toward the next psychological resistance. Any pullbacks could offer a buy-on-dip opportunity in line with the current trend.

BTCUSDT: Strong Uptrend, Targeting New HighsBTCUSDT is in a very strong uptrend, consistently setting new highs driven by overwhelming buying pressure and green Fair Value Gaps (FVGs).
Currently at $125,144, Bitcoin could reach $134,128 around July 21, 2025. This rally is fueled by ETF approvals, the Halving effect, a favorable macroeconomic environment (safe-haven, inflation hedge), and the expanding crypto ecosystem.
The preferred strategy is to buy on dips or breakout of resistance, always managing risk tightly.

BTCUSDT – Uptrend intactBitcoin continues to trade within a clear upward trend channel, with multiple Fair Value Gaps acting as strong support zones. After rebounding from the 104,960 area, price successfully retested the ascending trendline and returned to the previous accumulation zone.
Currently, BTC is consolidating near short-term resistance, but bullish momentum remains dominant. As long as price holds above 104,960, a breakout toward the extended resistance zone at 116,971 remains a likely scenario.
Trend: Bullish
Support: 104,960
Resistance: 116,971
Strategy: Favor buying on dips as long as price holds above the trendline and FVG. Nearest target around 116,971.

Trade Recommendation – BUY WTI Crude Oil (USOIL) – Entry #2✅ Trade Recommendation – BUY WTI Crude Oil (USOIL) – Entry #2
📅 Date: July 3–4, 2025
🕒 Timeframe: 1H
🎯 Trade Setup:
Entry Zone: 66.30 – 66.40 USD/barrel (short-term support and EMA20 zone)
Stop Loss (SL): 65.60 USD (below MA200 and previous bullish candle base)
Take Profit (TP):
• Target: 68.40 – 68.50 USD
📊 Technical Analysis:
Healthy pullback after a strong bullish breakout — price is currently consolidating around EMA20, potentially forming a new upward leg.
Volume surged during the July 2–3 breakout, indicating strong institutional buying interest.
Price structure: Clear uptrend with higher highs and higher lows.
Bollinger Bands: Price touched the upper band and is now retracing to the mid-band — a common continuation pattern.
EMA20 is acting as dynamic support.
🧭 Strategy Notes:
Wait for price to retrace into the 66.30 – 66.40 zone with a confirmation signal (e.g. bullish pin bar or engulfing candle).
Consider scaling in and holding the position toward the resistance area of 68.40 – 68.50.
Cut loss if price breaks below 65.60 and invalidates the current bullish structure.
fl me & ytb, winrate 90%! Thank

Bitcoin: Ready to Break Psychological Resistance?BTC is maintaining its bullish structure with strong rebounds from the trendline since April. The price is now approaching the psychological resistance zone at 119,000 – a level that has been rejected three times before.
If support at 104,700 holds and the resistance is broken, BTC could target the 125,000 area. On the other hand, losing this support could interrupt the bullish momentum.
Trade Setup:
Buy around 104,700–106,000
TP: 119,000
SL: below 103,000
Note:
The upcoming NFP report on July 5 may trigger sharp moves if strong data boosts the USD.
Do you expect a breakout or another rejection?

BTCUSDT – Targeting 125,000 if Resistance BreaksBTCUSDT is holding a strong uptrend, with price respecting the ascending trendline and consistently filling fair value gaps. The pair is approaching key resistance around 110,000 and may form a breakout–retest pattern, potentially unlocking a move toward 125,000.
On the news front, institutional inflows are returning, spot ETFs continue to attract capital, and the Fed is keeping rates steady — all supporting bullish momentum. As long as price holds above 101,200, the upside scenario remains in play.

BTCUSDT – Buying Resumes, Bullish Momentum Targets 120,000Bitcoin is flashing strong bullish signals as it continues to hold within a well-defined long-term ascending channel. After a technical bounce from the nearby support zone around 99,614, BTC has regained momentum and is now approaching a key resistance FVG cluster — a potential launchpad for a breakout.
The price structure shows a series of higher lows combined with healthy pullbacks, indicating accumulation and capital rotation back into BTC. A “break–pullback–continuation” pattern is forming, pointing to a likely move toward the psychological resistance level at 120,000 — a target highlighted by many professional traders since the start of the quarter.
Fundamental factors supporting the uptrend:
Large capital inflows are returning to U.S. Bitcoin ETFs, signaling renewed institutional confidence in the bull cycle.
Expectations that the Fed will hold rates steady are weighing on the USD, creating a favorable environment for risk assets like BTC.
Altcoin volatility is fading — often a sign that capital is rotating back into BTC as the market’s leading asset.

Bitcoin is Coiling – Ready to Break Out Toward 112K?On the H8 timeframe, BTCUSDT is forming a clear bullish setup. After a strong rebound from the support zone around 104,489 — which aligns with a previous demand area and Fair Value Gap — price has broken above the descending trendline and is now retesting the resistance near 107,500. This structure is shaping into a broadening triangle pattern, signaling a potential breakout.
If BTC holds the 105,000–106,000 area during the upcoming pullback, there is a high probability of a bullish breakout toward the 112,000 level — a key previous high.
On the news front, market sentiment is improving as U.S.-based Bitcoin ETFs attract fresh inflows, coupled with growing expectations that the Fed will hold interest rates steady amid signs of economic slowdown. These factors are providing strong support for BTC’s medium-term bullish outlook.

BTCUSDT – Long-term uptrend intact, target 111,666 USDTBitcoin is maintaining a strong bullish structure on the daily chart, having successfully retested the long-term ascending trendline. The support zone around 93,932 USDT — which aligns with a Fair Value Gap (FVG) and trendline — continues to act as a key rebound level, as seen in late April.
The current chart suggests a “pullback–breakout–consolidation” pattern, with the potential for a higher low if price revisits the trendline and FVG once more. The base case: price consolidates around the 98k–100k zone before targeting the major resistance at 111,666 USDT.
On the news front, investor sentiment is stabilizing after the Fed signaled rate hold. Additionally, BlackRock’s ETF has seen three consecutive days of net inflows — a strong tailwind for the bulls.

BTC goes wild. But there’s worse. With PipGuard.“BTC goes wild. But there’s worse. With PipGuard.”
Hola, hi my friends! How are you doing? Hope you're doing amaziiiing!
Today we’re having a little chat about Bitcoin, shall we?
I admit it: this time I messed up and took the USDT spot chart instead of USD… but heeey, I’m lazy and it doesn’t really matter. What counts is the trend, RIIIGHT?
But first… boost me and drop a comment <3
📈 The trend is your friend... until it messes with you
🔼 If it goes up, it goes up
BTC is still in a strong bullish trend long term.
Nothing new? Maybe, but if it keeps going… it’s aiming for new highs. Simple.
And if not today, then tomorrow. Your loss if you miss it.
🧠 Always keep one eye on assumptions and the other on objectivity. The market will thank you.
🔽 If it drops... better be ready
And if it decides to go down?
Here come the targets: 102k , 100k , and that delicious 94k I’d love to see.
Why? Because even crypto needs a break.
And each level is potentially a reversal point , you know that already, right?
🧱 Supports, resistances... and your debts
• Resistance: 109k (rounded like those 100€ you still owe me haha)
• Serious support: 78k
• Cuddly support: 88k
• The rest is noise.
• Trend still strong, yes. But if you’re not watching… someone else will watch your wallet.
🔥 The market today? On fire, as always
• BTC did its usual trick: touched 106k , then dropped below 103k
• Liquidations? BOOM 💣: over 450 million dollars in longs
• The market shook like a noob on their first short
🌍 War, hacks, and chaos: BTC loves it
• Israelis flying around Iran bombing targets
• Iranians firing back missiles
• Israeli hackers broke into Nobitex and BURNED 90M in crypto
• The White House is silent, but the US has a “Bitcoin Reserve”
• Result? BTC pumps, dumps, pumps again… you tell me
🐍 Juicy GOSSIP
• In New York, two crypto bros kidnapped an Italian guy from Rivoli and tortured him for 17 days to get his wallet password
• Electroshock. Power saw. “Wild” sessions with madams & friends
• All this between parties, bondage, and wheelchairs
• The guy, alive by miracle, is now the new symbol of “ never give your key to anyone ”
📊 Technical Recap
🧱 Resistance: 109k
🪨 Supports: 88k / 78k
💣 Liquidations: +450M long
📉 Price Range: 106k ➝ below 103k
🌍 Geopolitics: Real bombs & BTC
😈 Gossip: Crypto-bros under pressure 😱
😂 The curtain drops…
My fingers hurt. And not just from typing… oops, I said it? I did.
If you had fun, boost and comment .
If not… next time I’ll give you support at 69k, that’ll teach you.
A hug from your loyal lunatic, PipGuard 🤣🧨
Compression Before Expansion: Market Awaits Its Next MoveBTCUSD – Compression Before Expansion: Market Awaits Its Next Move
Bitcoin is trading within a compressed structure after rejecting key resistance and retesting support. While the overall sentiment remains cautious, the technical setup is beginning to show signs of strength — if buyers can reclaim control.
🧭 Macro Check-In: Calm Before the Crypto Storm?
No rate cut from the Fed yet, but markets are starting to price in the possibility of a pause in Q3 or Q4.
ETF inflows slowing, but institutional positions are not closing — suggesting long-term conviction remains.
Political momentum in the US is shifting towards crypto adoption, with Bitcoin emerging as a talking point in election debates.
Dollar index (DXY) continues to chop, giving crypto room to breathe if inflation data remains mild.
In short: liquidity is building, but the trigger hasn’t fired — yet.
📊 Chart Structure (H1–H4): Levels That Matter
BTC is holding just above 103,100, a key level where previous demand stepped in.
The mid-range resistance lies at 104,184 — this needs to break for bulls to gain short-term control.
Above that, eyes are on 106,047, then 107,586 (top of the descending channel).
EMA alignment is still bearish → wait for structure shift, not FOMO.
📌 Trade Map
🔵 Buy Setup
Zone: 103,100 – 103,300
Condition: Bullish reaction + rejection wick / engulfing
SL: 102,600
TP: 104,184 → 106,047 → 107,586
🔴 Sell Setup (Only if trap triggers)
Zone: 107,500 – 107,800
Condition: Rejection + volume fade
SL: 108,200
TP: 106,000 → 104,500
🧠 Trader Insight
“When the chart compresses, smart money positions early.”
Bitcoin is not trending — it's accumulating or distributing. Retail is waiting for breakout. Smart traders are preparing for both scenarios.
Watch the reaction, not the prediction.
Stay objective. Let levels lead the logic.

BTCUSDT – Holding Support, Bullish Signs EmergingBitcoin remains within a descending channel but continues to defend the strong support area around 101,296 USDT — a level that previously triggered a sharp rebound. On the H4 timeframe, price is consolidating sideways, forming an accumulation range. If this support holds, a bounce toward the 105,356 USDT zone is likely.
As of June 19, Binance holds 41% of global BTC trading market share, providing deep liquidity and tight spreads. This market condition favors a potential short-term recovery in BTC.
A breakout above the key resistance zone at 105,000–106,000 USDT could open the door for a broader upside continuation.

BTCUSDT – Selling Pressure is IncreasingThe price is retesting a strong resistance zone around 110,464 USDT, where heavy selling pressure previously emerged.
The likely scenario is that the price forms a Lower High pattern and then breaks the uptrend line → confirming a bearish trend.
Potential support area: 101,236 USDT, where price previously reacted.
Strategy:
Priority is to wait for sell opportunities around the 110,000–110,500 zone if a clear reversal signal appears.
Target at 101,200 USDT. Stop-loss placed above the resistance zone at 111,700 USDT.
News Supporting the Bearish Outlook:
The SEC has delayed approval of the spot Ethereum ETF, triggering negative sentiment in the crypto market.
Capital is flowing out of the market due to expectations that the Fed will maintain high interest rates for a longer period.

BTC Near $100K – Breakdown or Bounce?BTC Near $100K – Breakdown or Bounce?
BTCUSD – Will Bitcoin Hold ₹100K Support Equivalent? Signs of Weakness Amid Global Caution
🧭 Global Market Context
Bitcoin is facing some serious resistance after failing to hold above the $108K zone. And just as Indian markets react to global cues, BTC is showing signs of stress too.
🔺 US bond yields are climbing again – bad news for crypto risk appetite
🧊 Spot Bitcoin ETFs continue to attract inflows, but not strong enough to push new highs
💵 The US Dollar (DXY) is gaining strength again as investors flee risk — and that puts pressure on Bitcoin
Add to that the recent institutional sell-off, and it’s clear: BTC may need to “cool off” before another rally.
📉 Technical Picture (1H)
Bitcoin is showing a classic lower-high, lower-low pattern. A clear downtrend is in motion:
Price is below all key EMAs (34/89/200), with every rally being sold off
Important resistance sits at 106,000 – 107,000
Major support levels are now at 102,821, then 101,539, and if pressure continues — 100,419 (₹83+ lakh level for reference)
Momentum indicators like RSI are flat. No strength yet. And without a solid bullish candle from support, buyers may stay away.
🔎 Strategy Plan for Indian Traders
🔻 Short-term SELL Setup
Entry: 106,000 – 107,000
SL: 107,500
Targets: 102,821 → 101,539 → 100,419
🧠 Ideal for short-term traders looking to follow the trend
🔹 Medium-term BUY Setup (only if price reacts from 100K zone)
Entry: 100,500 – 100,800
SL: 99,800
Targets: 102,800 → 104,400 → 106,000
⚠️ Wait for bullish confirmation — avoid bottom fishing blindly
📌 Final Thought
Bitcoin is in a danger zone right now. If it loses grip on $100K support, we may see panic selling from leveraged traders. But this zone also holds opportunity — a strong bounce could spark a fresh rally.
🧘 Trade with patience. Don't chase. Let the market come to you.
