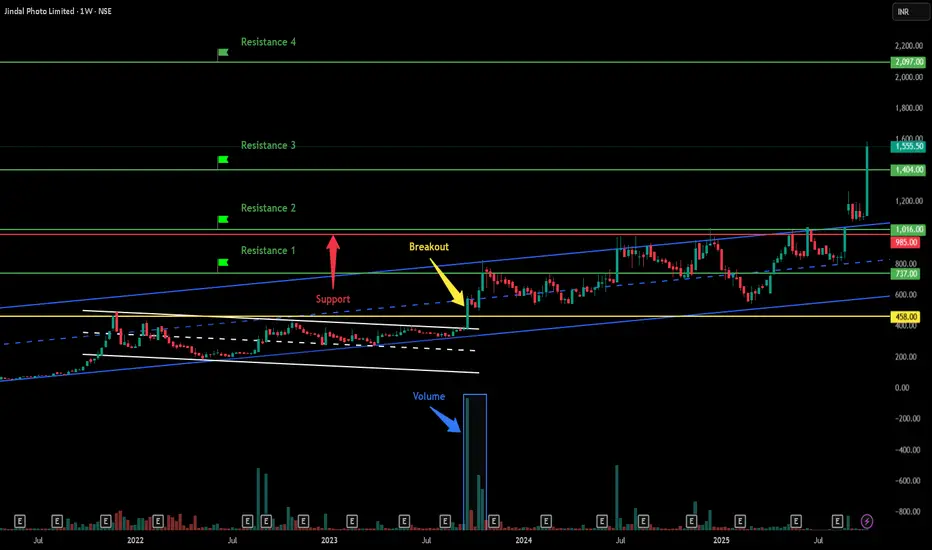
Jindal Photo Limited - Breakout Setup, Move is ON...#JINDALPHOT trading above Resistance of 1404
Next Resistance is at 2097
Support is at 985
Here are previous charts:
Chart is self explanatory. Levels of breakout, possible up-moves (where stock may find resistances) and support (close below which, setup will be invalidated) are clearly defined.
Disclaimer: This is for demonstration and educational purpose only. This is not buying or selling recommendations. I am not SEBI registered. Please consult your financial advisor before taking any trade.
JINDALPHOT
JINDALPHOTO - Weekly Chart AnalysisA new ATH and breakout from the resistance/supply zone 416-485 levels with insane volumes.
A consolidation of almost 10 months. between the supply & demand zone.
Now it shall sustain above these levels. It is trading above all its key moving averages.
As per the trend based fib 650 - 780 - 945 are the levels that can be tested if sustained.
The previous supply zone/resistance shall now act as support/demand zone. (416-485) and weekly close below these levels shall invalidate our view.
Disclaimer: This is just an analysis and not a buy/sell recommendation. If you intend to trade this counter then do your own due diligence and trade at your own risk.

Cup & Handle set up to trade1. Cup & Handle Pattern
2. Trend is bullish
3. Stock is ATH
4. 1.5 years consolidation

JindalPhoto Flag BO possible#JindalPhoto CMP 381 a tight flag BO possible.
Can be added for 415/460/500 SL 335

#JSWENERGY #Jindal #BankNifty #Nifty #Breakout #Resources $GLD #JSWENERGY
NSE: JSWENERGY
CMP: 126
Target: 136+
Target 2: 146++
SL: 126
Factors:
Rising Volume with rising Prices.
Flag pattern breakout.
Pennant Pattern Breakout with Bullish Candle.
Retest Successful.
Higher Highs & Higher Lows.
Broken above RESISTANCE levels
Trading at SUPPORT levels
Fundamental are strong.
Risk Return Ratio is healthy.
And
Rising from Double Bottom Pattern to Flag Pattern forming
The stock has potential to go beyond 146 in longer time.
If you like my work KINDLY LIKE SHARE & FOLLOW this page for free Stock Recommendations.
With 💚 from Rachit Sethia
