Jindal Stainless (D): Strongly Bullish - Sector-Backed BreakoutTimeframe: Daily | Scale: Linear
The stock has confirmed a major "Blue Sky" breakout, clearing a confluence of resistance levels (Angular + Horizontal) to hit a new All-Time High. This move is powered by a sector-wide rally and strong institutional volume.
🚀 1. The Fundamental Catalyst (The "Why")
The breakout is fueled by a convergence of positive factors:
> Sector Rally: The Nifty Metal index is surging, lifting all ferrous metal stocks. When a stock breaks out with its sector, the probability of success increases significantly.
> Strong Earnings Support: The company’s Q2 FY26 results provided the fundamental floor, and the market is now pricing in future growth from its capacity expansion plans (targeting 4.2 MTPA).
📈 2. The Chart Structure (The "Coil" bursts)
> The Squeeze: The tight sideways trend below the angular resistance. This "Coiling" action (low volatility + drying volume) indicated that sellers were exhausted.
> The Breakout: Today's surge of 5.14% smashed through the ₹825–₹830 supply zone.
- Significance: By closing at a new ATH ( ₹848.05 ), the stock has no overhead supply (resistance) left. It is now in "Price Discovery" mode.
> Volume: The 2.77 Million volume is an "Ignition Bar." It confirms that "Smart Money" has initiated a new markup phase.
📊 3. Technical Indicators
> EMAs: The Positive Crossover (PCO) on Short-term EMAs confirms the immediate trend is vertical.
> RSI: Rising RSI across all timeframes (Monthly/Weekly/Daily) signals synchronized momentum. An RSI above 60 in a breakout is a sign of strength, not an overbought signal.
🎯 4. Future Scenarios & Key Levels
The stock is primed for a "Blue Sky" run.
> 🐂 Bullish Target (Blue Sky):
- Target 1: ₹960 .
- Strategy: Since the stock is at an ATH, use a Trailing Stop Loss (e.g., 20-day EMA) to ride the trend as far as it goes.
> 🛡️ Support (The "Must Hold"):
- Immediate Support: ₹790 – ₹800 . The previous resistance zone should now act as a rock-solid floor (Polarity Principle).
- Stop Loss: A close below ₹776 would act as a structural failure, invalidating the breakout.
Conclusion
This is a Grade A Setup .
> Refinement: The "Low Volume" during the sideways phase followed by "High Volume" on the breakout is the perfect recipe for a sustainable move.
> Action: The breakout is confirmed. The dip to ₹820-830 (if it happens) is a buying opportunity.
Jindalstainless

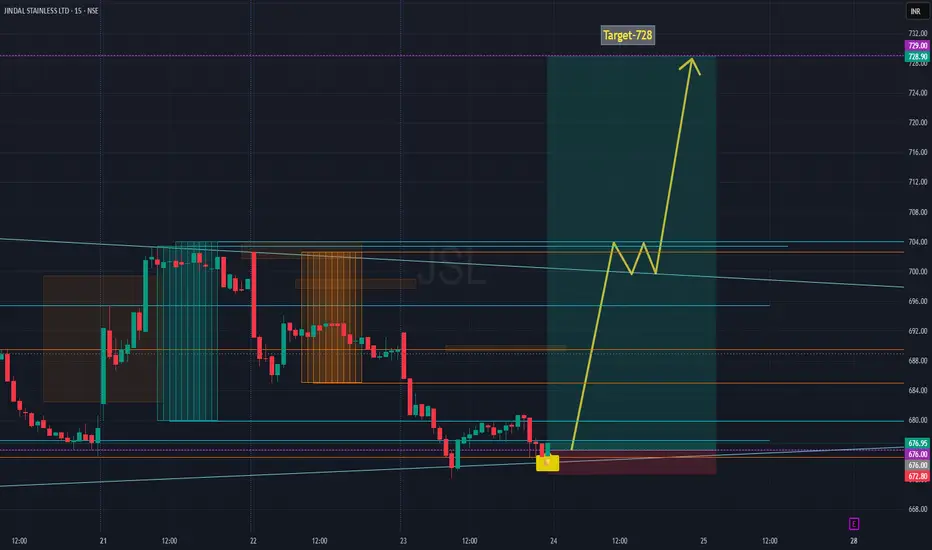
JSL Reversal Zone Identified -Path to 728 [Post Q1 Result]Structure-Based Intraday Outlook | Jindal Stainless (JSL)
Price reacted near a confluence support zone, overlapping key trendlines and historical liquidity area.
The yellow caution label appeared, marking a potential high-probability trend shift based on Leola Lens SignalPro.
Rejection from this zone suggests early signs of accumulation.
If price sustains above this base, the pathway builds towards ₹728.
Watch for intermediate resistance zones around ₹702–₹706, which may offer short-term reactions before continuation.
⚠️ Educational Outlook Only — No Buy/Sell advice.
JINDAL STAINLESS - Swing Trade Analysis - 25th May #stocksJINDAL STAINLESS (1D TF) - Swing Trade Analysis given on 24th May, 2024
Pattern: RECTANGLE BOX
- Volume Buildup at Resistance- Done ✓
- Resistance Breakout - In Progress
- Demand Zone Retest & Consolidation - In Progress
* Disclaimer

Unlocking the Power of Demand Zones: Jindal Steel Analysis
Hello fellow traders! Today, we're diving into analysis of Jindal Steel, exploring some of the core concepts that every budding trader should know. 🌟
Understanding the Basics 📘
LTF: Lower Time Frame - This is a shorter time frame for analysing stocks.
ITF: Intermediate Time Frame - This provides a comprehensive view of stock trends.
HTF: Higher Time Frame - This offers broader view of longer time.
EMA: Exponential Moving Average - It represents the stock's average closing price over a specific number of days. A 50 EMA means it's taking into account the last 50 days.
Decoding Jindal Steel 🔍
Jindal Steel is presently trading within the demand zones across three timeframes: LTF, ITF, and HTF.
The HTF view shows the stock is at a firm support zone labelled as RBR.
Although the daily (ITF) trend appears sideways, the stock's position in the weekly HTF demand zone adds a bullish tilt. The proximity of the price to the 50 EMA in the ITF confirms an upward trend over the last 50 days.
In the LTF, we notice a distinct pattern named DBR with five base candles. The leg-out candle is robust, and the follow-through seems promising.
Trading Strategy and Insights 💡
Considering the comprehensive scoring, a score of 12 emerges, indicating a positive outlook.
631-632 price is potential buying levels.
The stop-loss (SL) can be set slightly below the 125-minute demand zone, around the 623 mark.
On the upside, a target price can be positioned just under the 125-minute supply zone, approximately at 662. This offers a risk to reward ratio of 1:4.
Your Action Points 🌟
Analyse the data, ensure you understand the underlying concepts, and make informed decisions.
Always remember: "In trading, patience is not just a virtue, it's the key." 🔑
Your feedback means the world! Please like, comment, and follow for more insights. Every interaction counts!
Don't forget to follow me for more analyses: in.tradingview.com
Disclaimer: The above analysis is purely for educational purposes. I am not a SEBI registered analyst. Always conduct your research before making any investment decisions.
Thank you for your continuous support🌟

Long on JINDAL STAINLESS: Elliot Impulsive Wave -5Jindal Stainless is satisfying all the terms & conditions of Elliot Wave Theory.
Be guided by the Chart.
Recommended Target: 355 to 377
Stop Loss: 5 %

NSE:JSL BONSE:JSL
#JSL BO the long waited trend line with good volumes.
Good above 198.
Happy Trading !!
If you like the Analysis, be sure to like and follow us for daily updates !!

Jindal Stainless #JSL - Making a good base before the next runJindal Stainless Limited (#JSL) - Making a good base.
High profitability, increasing margins, reduced debt, merger news, easy earnings comparison for the upcoming quarter, all make a good recipe for a good trade. Details on the chart.
For easy reference, see this picture

JINDAL STAINLESS LTD. BREAKING 12 YRS HIGH WITH HUGE VOLUME1. BIG BREAKOUT ON THE CHARTS FOR JSL 12 YRS HIGH BREAKS. LOOKS GOOD ON UPPER LEVELS.
2. NEXT TARGET 200 IN RECENT TIME.
3. HUGE VOLUME FORMATION ON CHARTS.
@TradingView @Kunal_EquityRush @Piyush-Gupta

jindal stainless bullishJindal Stainless Ltd. is a holding company, which engages in the provision of stainless steel flat products. it is on a bullish move and can continue its movement.
tgt-sl-entry marked on the chart

Breakout in Jindal Stainless Ltd...Chart is self explanatory. Entry, Targets and Stop Loss are mentioned on the chart.
Disclaimer: This is for demonstration and educational purpose only. This is not buying or selling recommendations. I am not SEBI registered. Please consult your financial advisor before taking any trade.

Jindal StainlessJindal Stainless - Cmp 99.30
The stock is giving breakout after consolidation. Looks good for long if sustains above 99.50 for targets of 110/120.

#JSL Jindal Stainless, pennant pattern#JSL has given breakout from the upper trend line of the symmetrical triangle on Daily chart.
Good Volume.
Consolidation formed a pennant pattern and now BO.
Has already formed rounding bottom on Long Charts weekly/monthly
Near Term Target 110+
Potential Target 130+
SL- prev day low.
Note: not SEBI Registered. Nor any Recommendation. do your due diligence before taking trade.
