JkTyre Inverted Head & Shoulder PatternHi All…
Greetings!
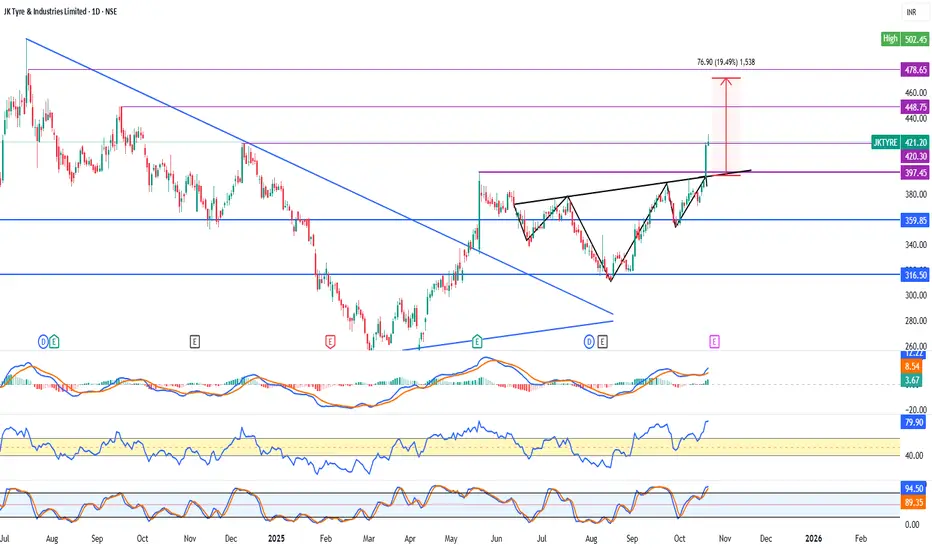
Today I’m sharing with you JkTyre Daily Chart. Yesterday there has been a good break out in the stock. The stock has made a Inverted Head & Shoulder Pattern and has crossed its Neckline. I think it would a good time to invest in the stock. Hoping for the stock to reach the TGT’s of 420 448 478.
In the coming time I think it should give good returns.
Thanking You
Important Things
1. This is only for educational purposes only.
2. Never over trade.
3. Always keep Stop Loss.
4. Trade in limited quantity.
5. Taking a small loss is better than wiping up your whole capital.
I hope you found this idea helpful.
Please like and comment.
Share with Your Friends.
Keep Learning,
Happy & Safe Trading
Disclaimer – These ideas shared by me to all are my personal analysis / views. I'm not a SEBI registered technical analyst.
Jktyrelong
J K Tyre : Breakout Candidate#jktyre #breakoutstock #momentumpick #trendingstock
J K Tyre : Swing Trade
>> Trending Setup
>> Stock in Uptrend
>> Momentum Pick
>> Good Strength & Volume Buildup
>> Low PE Stock
Swing Traders can lock Profit at 10% and keep Trailing
If u Like the analysis, Boost the post, and Follow us.
Disclaimer : Charts Shared for Learning Purpose, not a Trade Recommendation

JK Tyre to take long entryLong JK tyre stock. All important levels are marked on the charts. Safe traders can buy half the quantity after the BO of marked TL & balance quantity to buy after the BO of the resistance area. Good risk to reward trade. On all higher time frames, RSI is above 60 a sign of strength. This is for your educational purpose only.

JK TYRE | Neowave ForecastNSE:JKTYRE
Hi
This is an long term view. If you are unable to understand the chart, than leave a comment.
Thank You

JK TYRES - Swing Trade AnalysisTraders and Investor can go long as per the technical analysis of JKTYRE.
It could be the possibility that it will re test.
So safe one should always trade/invest with proper target and stoploss.
*We are not SEBI registered
This is only for educational purpose.
Please consult your advisor before making any trade or investment

JK tire in simple consolidation See the graph, but formed last red candle so only enter in trade after 150.50 or 151 crossing , or else oppose of it, it may go to deep oversell zone , good to buy for short-medium term , just an idea i have...follow me for more genuine ideas on standard stocks only...


Reverse H&D on JK TyresLong term reverse H&D in JK tyres. Good volume breakout of the neckline (23.10.2020). Significant breakout from the long term down trendline also. Setting up a new trendline. Look for buying opportunities on the retracements.
