JP Power - Are bad times over for this penny stock?Stock can fly if it gives a monthly closure above 25
Sharing only for educational purposes. Keep in watchlist to see who it unfolds.
Penny stocks should be strictly avoided for investment purposes.
Highly risky.
JPPOWER

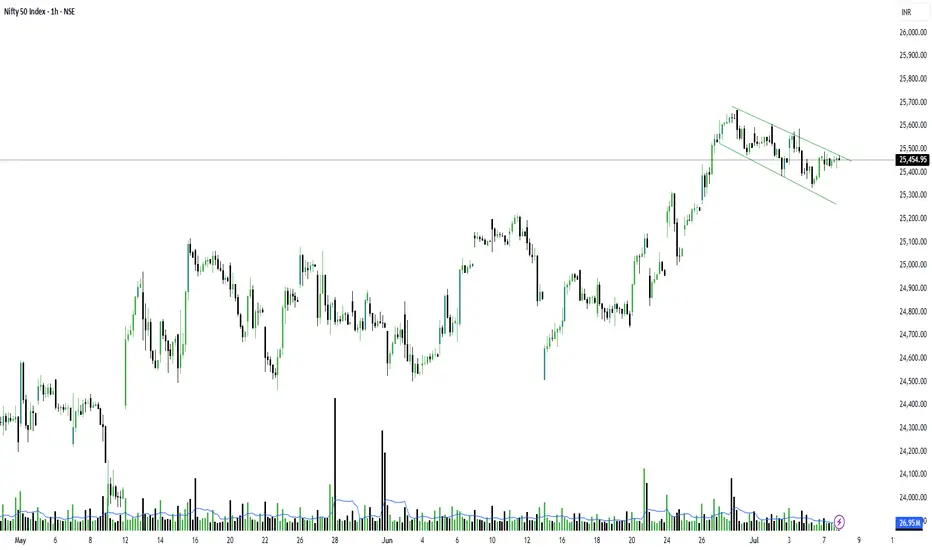
Do not think that nothing has happened in the market today!Do not think that nothing has happened in the market today and it was a pure sideways day.
No, it wasn't.
The intraday trend in NSE:NIFTY has tilted upward, but the daily trend got whipsawed today with sellers outnumbering buyers by 6.6 million volume. However, there was also buying push from the downside, and until that is held, we are good. When that breaks, we may see a downside in a few days.
All this is happening because of #Banknifty. I have been saying that BNF is getting weaker.
However, if the index closes above 25600, then all the negativity will be absorbed.
Until then, the support stays at 25365 as written in yesterday's commentary.
Individual stocks will do good, especially VCPs. Like today's NSE:KRN , NSE:RTNPOWER and NSE:JPPOWER
If you are looking for a good short-term pick, #RTNPOWER must be on your list.
NSE:BANKNIFTY is clearly messing with the trend—whether because of the Jane Street scandal or something else. But everything was clearly visible on the chart, so if you blame Jane Street or the Govt, don't call yourself a trader. No one will save you from such scams. They will continue because the market needs them. Only knowledge to read the chart can help you stay in the market in the long run.
56623 will be the support for BNF, and 57193 is the intraday resistance.
Avoid taking positions with MTF. Avoid intraday as well unless we get a good closing in both of the indexes—mainly BNF.
July is historically a bullish month for markets, but this time I am sitting on cash and not opening any new short-term positions. Waiting for the right opportunity. Let's see.
That will be all for the day. Take care. Have a profitable tomorrow.
JP Power: Breaking Out After 6-Month ConsolidationNSE:JPPOWER : Breaking Out After 6-Month Consolidation
Price Action Analysis:
• Long-term Trend: Stock has been in a prolonged downtrend from highs of ₹23.77, finding support around ₹12.36
• Recent Pattern: Clear consolidation phase from December 2024 to May 2025 within a rectangular range
• Current Movement: Sharp breakout from consolidation with strong volume confirmation
• Momentum: Bullish momentum building with gap-up opening and sustained buying
Volume Analysis:
• Volume Pattern: Significant volume spike during current breakout session
• Volume Confirmation: Current volume of 195.09M vs average of 41.29M indicates strong institutional participation
• Historical Volume: Notable volume spikes during previous breakout attempts in October 2024
• Volume Quality: Expansion on up-moves and contraction during consolidation phases
Key Technical Levels:
Support Levels:
• Immediate Support: ₹16.35 (previous resistance turned support)
• Strong Support: ₹15.50-16.00 (consolidation base)
• Critical Support: ₹12.36 (52-week low and major support zone)
• Long-term Support: ₹12.00-12.50 (multiple bounce zone)
Resistance Levels:
• Immediate Resistance: ₹18.50-19.00 (previous swing high zone)
• Major Resistance: ₹20.00-20.50 (psychological level and previous rejection zone)
• Target Resistance: ₹22.00-23.00 (measured move target)
• Ultimate Resistance: ₹23.77 (52-week high)
Base Formation:
• Base Type: Rectangular consolidation base
• Base Duration: Approximately 6 months (December 2024 to May 2025)
• Base Range: ₹12.36 to ₹16.35
• Base Depth: Approximately 25% from highs
• Base Quality: Well-defined with multiple tests of support and resistance
Technical Patterns Identified:
Primary Pattern:
• Pattern: Rectangle/Box Consolidation with Breakout
• Formation Period: December 2024 to May 2025
• Breakout Confirmation: Volume-backed breakout above ₹16.35
• Pattern Reliability: High, given the extended consolidation period
Trade Setup:
Entry Strategy:
• Primary Entry: ₹17.50-17.80 (current levels with momentum)
• Pullback Entry: ₹16.50-17.00 (if stock retraces to test breakout level)
• Aggressive Entry: ₹18.00+ (breakout continuation trade)
• Conservative Entry: Wait for weekly close above ₹17.50 for confirmation
Exit Levels:
• Target 1: ₹19.50-20.00 (10-12% upside, resistance zone)
• Target 2: ₹22.00-22.50 (25-27% upside, measured move)
• Target 3: ₹24.00+ (35%+ upside, extension target)
• Trail Stop: Use a 15-20% trailing stop once the first target is achieved.
Stop Loss Strategy:
• Initial Stop Loss: ₹15.50 (below consolidation base)
• Risk: 12-15% from current levels
• Tight Stop: ₹16.00 (for aggressive traders)
• Weekly Close Stop: Below ₹15.80 on weekly closing basis
Position Sizing & Risk Management:
Position Sizing Guidelines:
• Conservative Approach: 2-3% of portfolio (given sector risks)
• Moderate Approach: 3-5% of portfolio
• Aggressive Approach: 5-7% of portfolio (only for risk-tolerant investors)
• Maximum Allocation: Not more than 10% due to sector concentration risk
Risk Management Framework:
• Risk per Trade: Limit to 1-2% of total capital
• Reward-to-Risk Ratio: Minimum 1:2, targeting 1:3
• Portfolio Heat: Consider correlation with other power/infrastructure stocks
• Sector Exposure: Monitor total exposure to the power sector
Sectoral Backdrop:
Power Sector Overview:
• Sector Trend: Power sector showing signs of revival with government's focus on renewable energy
• Policy Support: Government initiatives for power infrastructure development
• Demand Scenario: Growing power demand with industrial recovery
• Investment Climate: Increased capex allocation for power infrastructure
Industry Dynamics:
• Renewable Push: Shift towards renewable energy, creating opportunities
• Transmission Focus: Grid strengthening and transmission line expansion
• Financial Health: Gradual improvement in power sector financials
• Regulatory Environment: Supportive policies for power sector growth
Fundamental Backdrop:
Company Profile:
• Business: Power generation, transmission, and infrastructure development
• Promoter Group: Jaiprakash Associates Group
• Market Cap: Mid-cap power sector player
• Operational Status: Multiple power projects across different states
Key Fundamental Factors:
• Debt Levels: High debt burden remains a key concern
• Asset Quality: Mix of operational and under-construction assets
• Revenue Visibility: Power purchase agreements providing revenue stability
• Execution Risk: Project completion and commissioning risks
• Financial Stress: Historical financial challenges and restructuring efforts
Recent Developments:
• Debt Resolution: Ongoing efforts for debt restructuring and resolution
• Project Status: Updates on project commissioning and operations
• Regulatory Approvals: Progress on pending regulatory clearances
• Strategic Initiatives: Focus on operational efficiency and cost optimization
Risk Factors:
Technical Risks:
• False Breakout: Risk of failure at higher resistance levels
• Volume Sustainability: Need for sustained volume support
• Market Sentiment: Dependency on overall market conditions
• Sector Rotation: Risk of sector-specific selling pressure
Fundamental Risks:
• High Leverage: Elevated debt levels impacting financial flexibility
• Execution Risk: Project execution and commissioning challenges
• Regulatory Risk: Changes in power sector policies
• Liquidity Risk: Working capital and cash flow management issues
My Take:
My Technical Outlook:
• Short-term: Bullish momentum with breakout confirmation
• Medium-term: Potential for 25-30% upside if breakout sustains
• Long-term: Dependent on fundamental improvements and sector revival
My Investment Recommendation:
• Recommendation: Cautious Buy for technical traders
• Time Horizon: 3-6 months for technical targets
• Suitability: Risk-tolerant investors with sector understanding
• Monitoring: Close watch on volume patterns and sector developments
This analysis is based on technical patterns and should be combined with thorough fundamental research and professional advice before making investment decisions.
Keep in the Watchlist.
NO RECO. For Buy/Sell.
📌Thank you for exploring my idea! I hope you found it valuable.
🙏FOLLOW for more
👍BOOST if you found it useful.
✍️COMMENT below with your views.
Meanwhile, check out my other stock ideas on the right side until this trade is activated. I would love your feedback.
Disclaimer: "I am not a SEBI REGISTERED RESEARCH ANALYST AND INVESTMENT ADVISER."
This analysis is intended solely for informational and educational purposes and should not be interpreted as financial advice. It is advisable to consult a qualified financial advisor or conduct thorough research before making investment decisions.

JP Power Showing StrengthNSE:JPPOWER Showing Strength With Good Volumes, Respecting 200 DEMA and Support Zone With MACD Showing BUY SIGNAL.
📌Thank you for exploring my idea! I hope you found it valuable.
🙏FLLOW for more
👍BOOST if useful
✍️COMMENT Below your views.
Meanwhile, check out my other stock ideas below until this trade is activated. I would love your feedback.
Disclaimer: This analysis is intended solely for informational and educational purposes and should not be interpreted as financial advice. It is advisable to consult a qualified financial advisor or conduct thorough research before making investment decisions.

#TORNTPOWER 1668 TGT 15% 1940+ NSE:TORNTPOWER
Target 1940 15% upside
NSE:TORNTPOWER CPM 1668
TGT 1940+ (15%)
SL 1550
TF < 6M
If you like my work KINDLY LIKE SHARE & FOLLOW this page for free Stock Recommendations. With 💚 from Rachit Sethia

Brewing Up JP PowerNSE:JPPOWER is brewing up to give a good upmove after accumulating nearly 15 to 17 Zones. A Close above 20 Will Confirms it.
Check out my other stock ideas below until this trade gets activated, I would love your feedback.
Disclaimer: This analysis is intended solely for informational and educational purposes and should not be interpreted as financial advice. It is advisable to consult a qualified financial advisor or conduct thorough research before making investment decisions.

JPPOWER - Risky - Triangle BO -Wkly- Near Multiyear BOJPPOWER -Risky bet -
The Jaiprakash Power Ventures Ltd. (JP Power) weekly chart shows significant bullish momentum after a prolonged period of accumulation. Here’s an analysis based on the chart you provided:
### 1. **Cup and Handle Formation**
- **Cup Formation (2017-2023)**: The chart clearly shows a large **cup pattern**, which is a bullish continuation pattern. It started forming around 2017 and completed in 2023. The depth of this cup indicates a long consolidation phase, with strong accumulation at lower levels.
- **Breakout**: JP Power broke out of the cup’s resistance around the ₹10.71 level, leading to a sharp upward move.
### 2. **Handle and Continuation**
- The handle formation was brief and followed by another breakout, confirming the strength of the pattern. The breakout from the handle shows increasing volumes, a strong bullish sign.
### 3. **Current Consolidation in Triangle**
- After the breakout, the stock is currently consolidating in a symmetrical **triangle pattern** between ₹16.63 and ₹23.78.
- **Support**: The lower bound of this triangle is around ₹16.63, which also coincides with a previous resistance level.
- **Resistance**: The upper bound of the triangle is near ₹23.78, which could act as the next resistance zone.
- A breakout above ₹23.78 could lead to a continuation of the bullish trend, possibly taking the stock higher.
### 4. **RSI and Momentum**
- The **RSI** (Relative Strength Index) at the bottom of the chart is hovering in the bullish range (above 50), but not yet in overbought territory. This indicates the stock still has room for upward movement.
- The recent bounce in RSI suggests that buyers are stepping in to support the stock at current levels.
### 5. **Volume Analysis**
- There is a noticeable increase in **volume** during the breakout phases, which indicates strong buying interest. The volume spikes during the key breakout confirm the strength of the move.
### 6. **Targets and Projections**
- The measured move from the **cup and handle** pattern, calculated from the depth of the cup (approximately ₹10.71), projects a potential upside target around ₹31.80 in the longer term, which aligns with a previous high seen in 2015.
- Near-term resistance levels could be ₹23.78 and ₹31.80 if the triangle breaks to the upside.
- Support levels: If the triangle breaks down, the stock might find support around ₹16.63 or even as low as ₹11.00.
### Conclusion:
- **Bullish Outlook**: The chart shows a long-term bullish trend, especially after the breakout from the cup and handle pattern. However, the stock is currently in a consolidation phase and traders should watch for a breakout above ₹23.78 for further bullish confirmation.
- **Risk Management**: Key support levels to monitor are ₹16.63 and ₹11.00 in case of any pullbacks.

JP POWER: Sipping JP 🚀💚JP POWER is in ascending traingle and looks good near 17-17.5 for an upside with the max target of 40, which may take some time. 50-60% looks good to me.

JP Power Price action.JP Power Price form Inverse H&S pattern and break out level at 10.50. It may test next target 22 soon.

JPPOWERWeekly Candle timeframe
looks very good bullish now
Head and should pattern has broken in mothly time frame.
and now making price action and going up.
i am very bulish on this.
DISCLAIMER: I AM NOT SEBI REGISTERED ANALYST. ALL POSTS ARE EDUCATIONAL PURPOSE. NON ADVISORY, DISCRETIONAL NO CLAIMS, RIGHTS RESERVED. I AM NOT RESPONSIBLE FOR YOUR PROFIT OR LOSS.

#JPPOWER long trade idea setup 17/11/23Greetings Folks,
today I have prepared a setup of JPPOWER on NSE
the analysis is as follows-
-The price is speculating near the all time high
- price broke a previous minor high with good volume , now retraced successfully
- price already has tapped in my support zone now ready to break past the BSL
- trendline support is also in our confirmation bias
don't play with fire, always use a predefined stoploss

Jaiprakash Power(JPPOWER) Stock Targets 10.90 and 11.95The current price stands at 9.90. After conducting a three-week analysis, I've identified a promising trade opportunity for Jaiprakash Power Ventures Ltd (JPPOWER) stock. My evaluation indicates two potential profit targets: the first set at 10.90 and the second at 11.95. It's crucial to establish a clear stop-loss level to effectively manage risks.
Trade Idea: Consider taking a long position on JPPOWER stock for a three-week period, with the first profit target set at 10.90 and the second at 11.95. Implement a well-defined stop-loss strategy to manage risks effectively.
1st Target --> 10.90
2nd Target --> 11.95
Best regards,
Kambi

JP POWER target hitJP POWER
Target hit of -13
What do you think will it boost
Nifty 50 is also going up now, so if nifty 50 gives us good points jp power may grow and it will hit more target.
Targets:- 13, 19.5, 21, 25++
Disclaimer :- I'm not recommending any buy or sell, do your research before investing

Will JP POWER be a multibagger stock in future?JP POWER
Gave a breakout
Made a head & shoulder pattern and broke it to
CMP :- 11.45
Targets :- 13, 19.5, 20, 25++
1. JP Power is an undervalued stock in the power sector. Trading at P/BV of 0.75x.
2. Reducing its debt.
3. Volume spurt in the chart.
Disclaimer :- Do your own research before investing, I'm not recommending any buy or sell.

JP PowerStock is trading near BO zone with strong volume rising making round bottom pattern, follow chart for proper support and resistance levels.

JP Power in UptrendJPPower came to medium term long uptrend.
The best price in historical buyer are found near 1 rupee and the medium term buyers are available near 4 rupee.
Need to perform price action analysis when stock comes to this area.

JPPOWER 1MONTHSPerfect time hai long karne ka 10 ka 80 90 100 🥶 short time me darna hai to daro long me kya darna ✨✌🏻

JPPOWERJPPOWER :- Stock Has Given 9 Year Consolidation, wait for Breakout. good volume
Hello traders,
As always, simple and neat charts so everyone can understand and not make it too complicated.
rest details mentioned in the chart.
will be posting more such ideas like this. Until that, like share and follow :)
check my other ideas to get to know about all the successful trades based on price action.
Thanks,
Ajay.
keep learning and keep earning.

JPPOWER: 8 year Inverted Head and ShoulderJPPOWER is getting ready to break the 8 year inverted head and shoulder pattern above 10-11

JP POWER TARGET 21 ?JP power is forming head and shoulder with good divergence on monthly chart on long term we can see a trend change in this share from a long time share is forming lower high pattern now, we can see trend change in this particular script. We can see a high of 21 then see a higher low pattern and we can see this script in uptrend. Power is future .. Cheers..!

JPPOWER : 1:3TARGET STOCK Eventhough the stock is not following the rules of my trading (please check my previous swing ideas) can give a great return in short time with small stop loss.
ACCUMULATION PHASE IS GOING ON.

Power of a simple TrendlineAnother Simple Technical Analysis which shows that market is easy and money can be made by doing simple things also.
This Time there is a very simple TRENDLINE drawn in weekly time frame which had worked multiple times and again which has given another opportunity and made a Pin Bar candle at the support of the Trendline.
It seems true that more than 80% is the Psychology (Money management , Position Sizing , Execution and other things) and only around 20% is the SETUP. Because Setup is easy but following it religiously is what a makes a person, TRADER
ENTRY - can be made if it crosses this Pin Bar Candle or can be purchased at the current market price of 6.95 for aggressive trading.
RISK - The Stoploss would be at the low of the same candle on closing basis or whenever it gives a closing before the trendline after crossing this pin bar's High.
Reward - there is major resistance( at price - 10) which has been retested 3 time and there is a high probability that it will go again to retest that resistance.
** Stop loss and Reward has no significance if the Psychology is not strong. Do not hope and just exit at the Stop Loss level and do not greed , just exit at the reward level.
**There are always a lot of opportunities in the market.
#KeepLearning.

JP POWER: 7.5JP POWER: 7.5
IF 5.34, 0.34 holds support, and a break of 11.34, we can see 16-19, 22-25, 33-35, 44-46. 50+.
