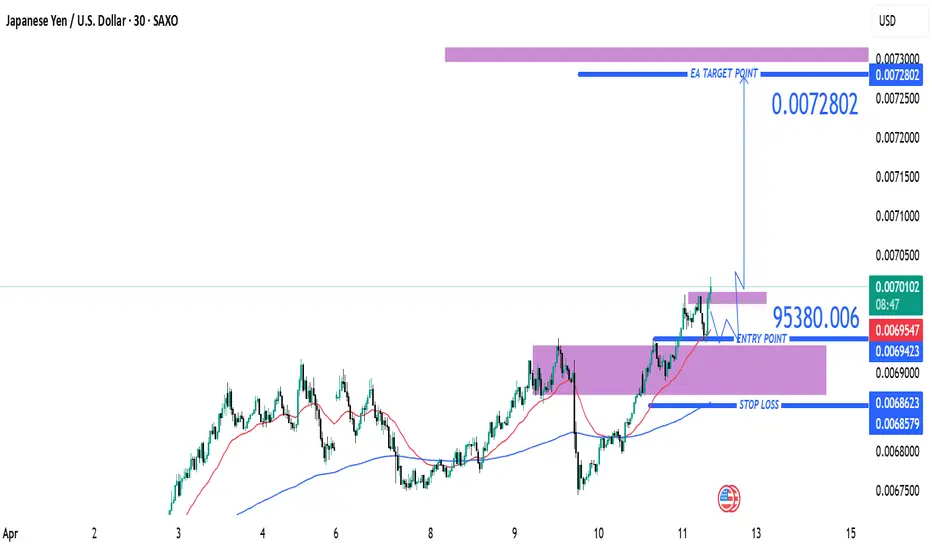
JPY/USD Bullish Breakout – Targeting 0.0072802 After Retest (AprEntry Point: ~0.0069539
Take Profit (TP): 0.0072802
Stop Loss (SL): 0.0068579
Risk/Reward Ratio:
Risk: ~0.000096
Reward: ~0.000326
Approx. R/R = 1:3.4 → Excellent reward-to-risk
🧠 Strategy Insight
Trade Type: Long (Buy)
This is a bullish continuation setup aiming for higher highs after a breakout from a consolidation range.
Price Action:
Strong bullish trend visible since early April.
Price consolidated in a purple zone (likely a demand/support zone), then broke out and is now retesting that zone — classic breakout and retest pattern.
Indicators:
Two moving averages (likely 50 EMA in red and 200 EMA in blue) are in bullish alignment:
Price is above both EMAs.
50 EMA is above the 200 EMA, confirming bullish momentum.
Support & Resistance Zones:
Entry near previous resistance turned support — solid structure for long positioning.
TP zone near prior highs, possibly based on historical resistance (purple shaded zone above).
SL placed below the most recent demand zone and 200 EMA — a conservative and safe stop.
🔁 Trade Scenarios
✅ Bullish Outcome (Preferred):
Price respects the retest zone and pushes toward 0.0072802.
Strong momentum or fundamental catalysts could support the breakout continuation.
❌ Bearish Risk:
Price dips below the entry and breaks the demand zone and EMAs.
SL at ~0.0068579 helps manage this risk effectively.
🧩 Summary
This is a well-structured trend continuation long setup with textbook breakout-retest logic. The high R/R makes it an attractive opportunity assuming bullish conditions persist.
📌 Suggested Title
"JPY/USD Long Trade Setup – Breakout Retest Toward 0.0072802 (April 11, 2025)"
Jpyusdanalysis
JPY/USD 30-Min Chart – Bearish Setup from Resistance Zone with 2200 EMA (blue): 0.0067930
30 EMA (red): 0.0068478
Current Price: 0.0068313
Price Position: Currently between the EMAs, showing consolidation and potential indecision.
🟪 Key Zones Identified
Entry Zone (Sell Area): Around 0.0068740
Stop Loss Zone: Above the resistance area at 0.0069118
First Target Zone (EA Resistance Point Target): Around 0.0067636
Final Target Zone (EA Target Point): Around 0.0066745
📉 Short Trade Plan
Entry Point: Price re-tests the resistance zone at 0.0068740
Stop Loss: Above key resistance at 0.0069118
Target 1 (TP1): 0.0067636
Target 2 (TP2): 0.0066745
Risk-to-Reward: Approx. 2.89x, with a -2.89% drop expected from entry to final target.
📊 Price Structure & Trend Insight
The chart shows bearish intent, with repeated rejections from the resistance zone.
A break below the 200 EMA and the support near 0.0067930 would signal stronger downside momentum.
The downward arrow and projection reflect a swing short setup based on market structure and key zones.
✅ Strategy Confirmation
Watch for:
Price rejection from the 0.0068740 level.
Bearish candlestick patterns in that zone (like bearish engulfing or shooting star).
Volume confirmation or momentum slowdown at resistance.
