USD/JPY Bullish Reversal AnalysisUSD/JPY Bullish Reversal Analysis 📈💹
🔍 Technical Overview:
The chart illustrates a strong bullish reversal pattern forming on USD/JPY after price reacted from a key support zone at 144.600. This level has held firm multiple times, marked by green arrows, signaling strong buying interest.
📐 Chart Patterns & Structure:
✅ A bullish harmonic pattern (possibly a bullish Bat or Gartley) is completing near the 144.600 zone.
🔄 Multiple rejection wicks and bullish engulfing patterns indicate a potential upside reversal.
🔵 Descending trendlines have been broken, confirming momentum shift.
🔁 Previous resistance turned support (near 145.000) is acting as a possible launchpad for the next move.
🎯 Upside Target:
The projected move targets the resistance zone at 147.698, aligning with previous highs and a significant supply area.
If price breaks above 145.900 convincingly, continuation toward this resistance is expected.
🔻 Downside Risk:
A break below 144.600 would invalidate the bullish setup and expose price to the lower support range near 142.000–143.000.
📊 Conclusion:
USD/JPY is showing signs of bullish reversal from a strong demand zone. If price sustains above 145.000 and breaks the minor consolidation, the pair could rally toward 147.698 🎯.
Bias: Bullish ✅
Support: 144.600
Resistance: 147.698
Jpyusdsignal

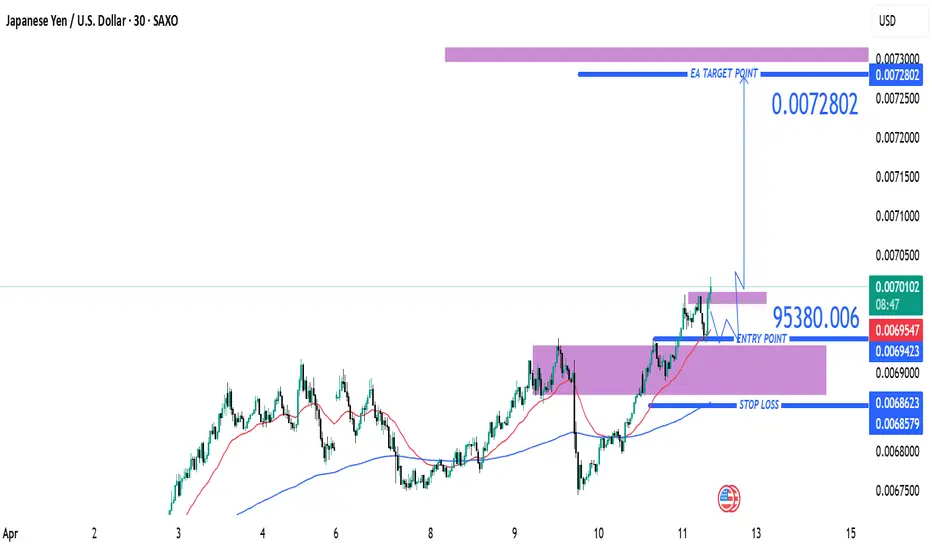
JPY/USD Bullish Breakout – Targeting 0.0072802 After Retest (AprEntry Point: ~0.0069539
Take Profit (TP): 0.0072802
Stop Loss (SL): 0.0068579
Risk/Reward Ratio:
Risk: ~0.000096
Reward: ~0.000326
Approx. R/R = 1:3.4 → Excellent reward-to-risk
🧠 Strategy Insight
Trade Type: Long (Buy)
This is a bullish continuation setup aiming for higher highs after a breakout from a consolidation range.
Price Action:
Strong bullish trend visible since early April.
Price consolidated in a purple zone (likely a demand/support zone), then broke out and is now retesting that zone — classic breakout and retest pattern.
Indicators:
Two moving averages (likely 50 EMA in red and 200 EMA in blue) are in bullish alignment:
Price is above both EMAs.
50 EMA is above the 200 EMA, confirming bullish momentum.
Support & Resistance Zones:
Entry near previous resistance turned support — solid structure for long positioning.
TP zone near prior highs, possibly based on historical resistance (purple shaded zone above).
SL placed below the most recent demand zone and 200 EMA — a conservative and safe stop.
🔁 Trade Scenarios
✅ Bullish Outcome (Preferred):
Price respects the retest zone and pushes toward 0.0072802.
Strong momentum or fundamental catalysts could support the breakout continuation.
❌ Bearish Risk:
Price dips below the entry and breaks the demand zone and EMAs.
SL at ~0.0068579 helps manage this risk effectively.
🧩 Summary
This is a well-structured trend continuation long setup with textbook breakout-retest logic. The high R/R makes it an attractive opportunity assuming bullish conditions persist.
📌 Suggested Title
"JPY/USD Long Trade Setup – Breakout Retest Toward 0.0072802 (April 11, 2025)"
USDJPY TRADING POINT UPDATE > READ THE CAPTAIN Buddy'S dear friend 👋
USD JPY SMC Trading Signals 🗺️🗾 Update USD JPY ready for down 👇 trend 📉 technical analysis update USD Already done with.109:600 back down 👇 JPY closed below 157.067
Next support level 156.00
Analysis target we'll see 156.00
MR SMC trading point
Support 💫 My hard analysis Setup like And Following 🤝 me that star ✨ game 🎮

JPYUSD ShortTime Frame: 4H
Symbol: JPYUSD
Entry: 0.006972
TP: 0.006840
SL: 0.007062
Bias: Short
We are going to sell the pair considering the consistent selling pressure visible from the price structure of this pair.

JPYUSD ShortTime Frame: 4H
Symbol: JPYUSD
Entry: 0.007124
TP: 0.006986
SL: 0.007215
Bias: Short
The price pattern of this instrument is displaying selling opportunity.

JPYUSD NeutralTime Frame: 4H
Symbol: JPYUSD
Bias: Neutral
We do not see any explicit trend for this instrument ,so we stay neutral.
