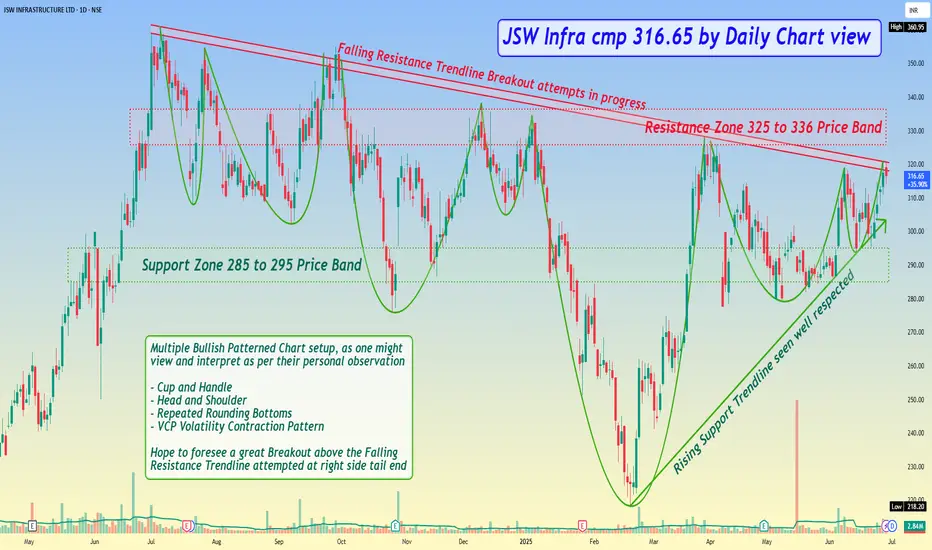
JSW Infra cmp 316.65 by Daily Chart view*JSW Infra cmp 316.65 by Daily Chart view*
- Support Zone 285 to 295 Price Band
- Resistance Zone 325 to 336 Price Band
- Rising Support Trendline seen well respected
- Falling Resistance Trendline Breakout attempts in progress
- [ b]Multiple Bullish Patterned Chart setup, as one might view and interpret as per their personal observation
- Cup and Handle
- Head and Shoulder
- Repeated Rounding Bottoms
- VCP Volatility Contraction Pattern
- [ b]Hope to foresee a great Breakout above the Falling Resistance Trendline attempted at right side tail end
Jswinfrapriceactionanalysis
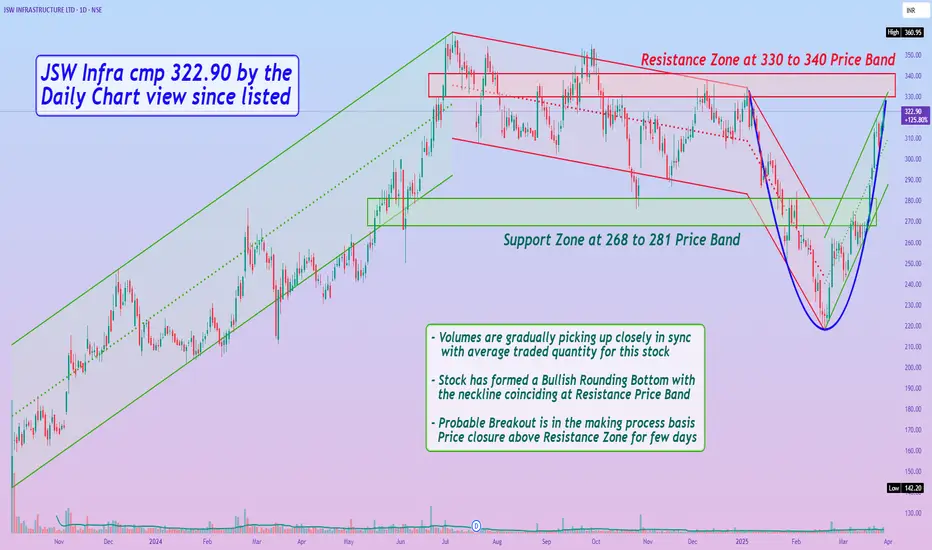
JSW Infra cmp 322.90 by the Daily Chart view since listedJSW Infra cmp 322.90 by the Daily Chart view since listed
- Support Zone at 268 to 281 Price Band
- Resistance Zone at 330 to 340 Price Band
- Volumes are gradually picking up closely in sync with average traded quantity for this stock
- Stock has formed a Bullish Rounding Bottom with the neckline coinciding at Resistance Price Band
- Probable Breakout is in the making process basis Price closure above Resistance Zone for few days