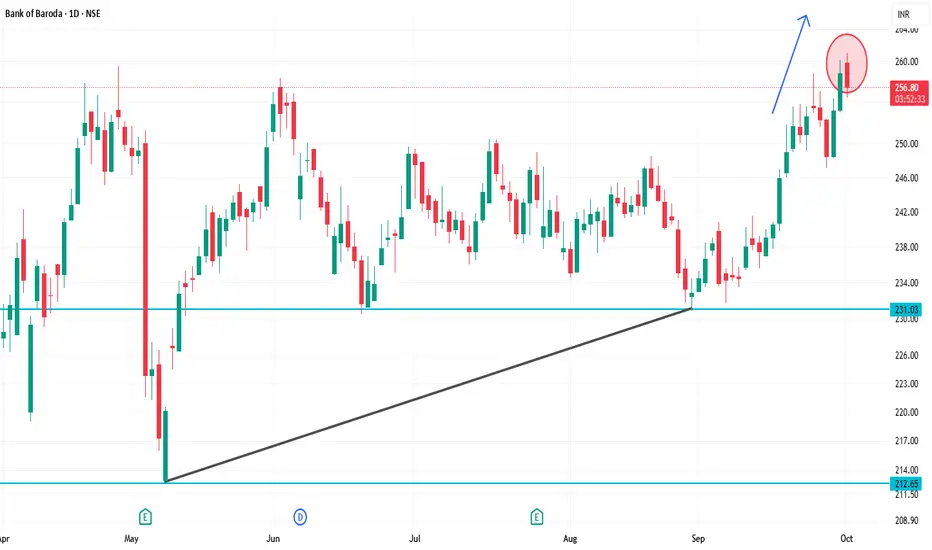
BANKBARODA 1D Time frameClosing Price: ₹257.60
Day Range: ₹253.70 – ₹260.00
Previous Close: ₹258.54
📉 Trend Analysis
Short-Term Trend: Bearish — The stock is trading below key moving averages, confirming the bearish trend.
Medium-Term Trend: Neutral — The stock is in a consolidation phase, characterized by lower highs and lower lows.
Long-Term Trend: Neutral — No significant trend identified; the stock is trading within a range.
🔮 Conclusion
Bank of Baroda is in a bearish trend with weak momentum.
Break below ₹250.00 could lead to further decline toward ₹245.00.
Break above ₹265.00 would indicate a potential trend reversal.
JWS
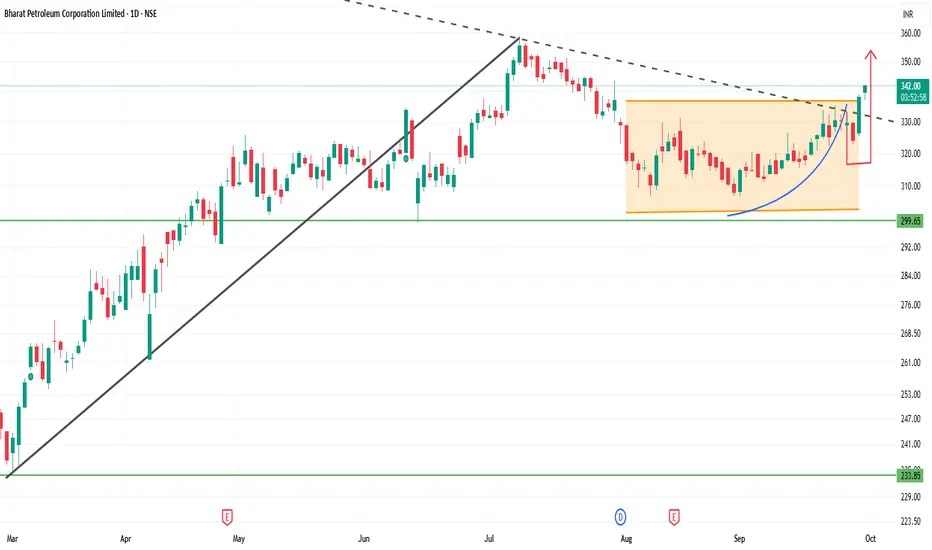
BPCL 1D Time frameCurrent Price Snapshot
Last Traded Price: ₹340.20
Day’s Range: ₹337.15 – ₹340.85
52-Week Range: ₹234.01 – ₹373.35
Technical Indicators
RSI (14-day): 53.27 — indicates a neutral momentum.
MACD: 2.49 — suggests a bullish trend.
Moving Averages:
5-day: ₹327.97 — indicates a Sell signal.
50-day: ₹322.14 — indicates a Buy signal.
200-day: ₹296.14 — indicates a Buy signal.
Pivot Points:
Support: ₹327.13
Resistance: ₹337.93
Summary
Above ₹340.85: Potential rise toward ₹345 – ₹350.
Below ₹337.15: Potential fall toward ₹330 – ₹325.
Between ₹330 – ₹340: Likely range-bound movement.
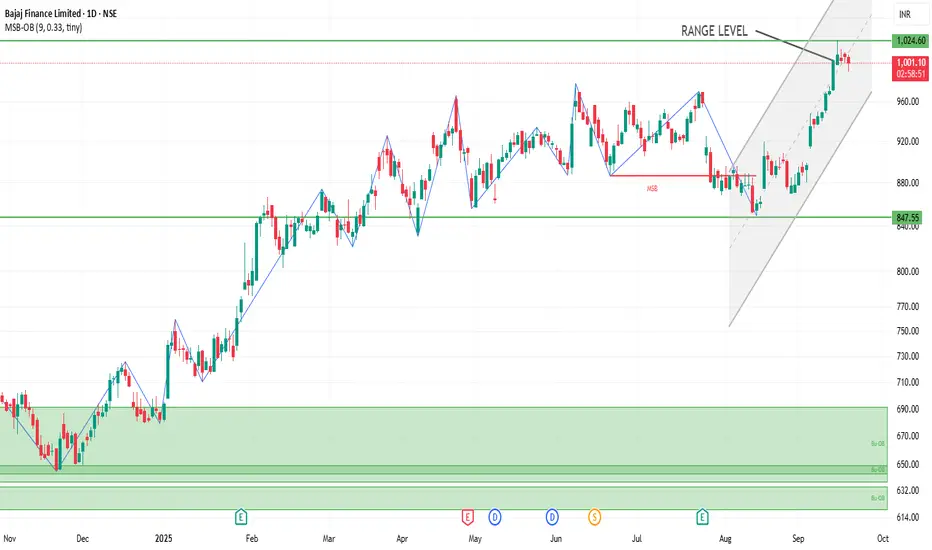
BAJFINANCE 1D Time frameCurrent Price Snapshot
Current Price: ₹999.00
Day’s Range: ₹989.45 – ₹1,002.30
52-Week Range: ₹645.10 – ₹1,036.00
Technical Indicators
RSI (14-day): 59.37 — indicates a neutral to slightly bullish momentum.
MACD: -4.010 — suggests bearish momentum.
Moving Averages: Mixed signals — short-term averages are bearish, while long-term averages are bullish.
Technical Summary: Predominantly Buy signals across various indicators.
Summary
Above ₹1,002.30: Potential rise toward ₹1,020 – ₹1,030.
Below ₹989.45: Potential fall toward ₹980 – ₹970.
Between ₹980 – ₹1,010: Likely range-bound movement.
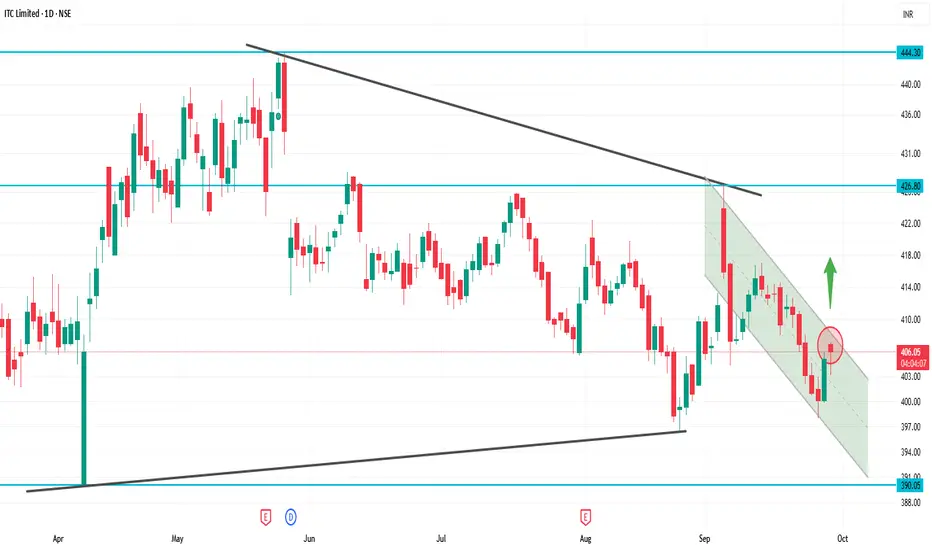
ITCITC Daily Snapshot
Current Price: ~₹405
Day’s Range: ~₹401 – ₹406
🔍 Key Levels
Support: Around ₹399 – ₹401 (near-term buying zone)
Resistance: Around ₹409 – ₹412 (supply zone)
📈 Technical Picture
Trend: Slightly bearish to sideways, but stabilizing above ₹405 gives some strength
RSI (Daily): Neutral zone, neither overbought nor oversold
Moving Averages: Price is close to short-term averages, so a decisive breakout above ₹409 is needed for bullish confirmation
VWAP: Trading near VWAP, showing balance between buyers and sellers
✅ Summary
At ₹405, ITC is near the middle of its range.
If it holds above ₹405 and breaks ₹409–₹412, bullish momentum can pick up.
If it falls below ₹401, it may retest support near ₹398.
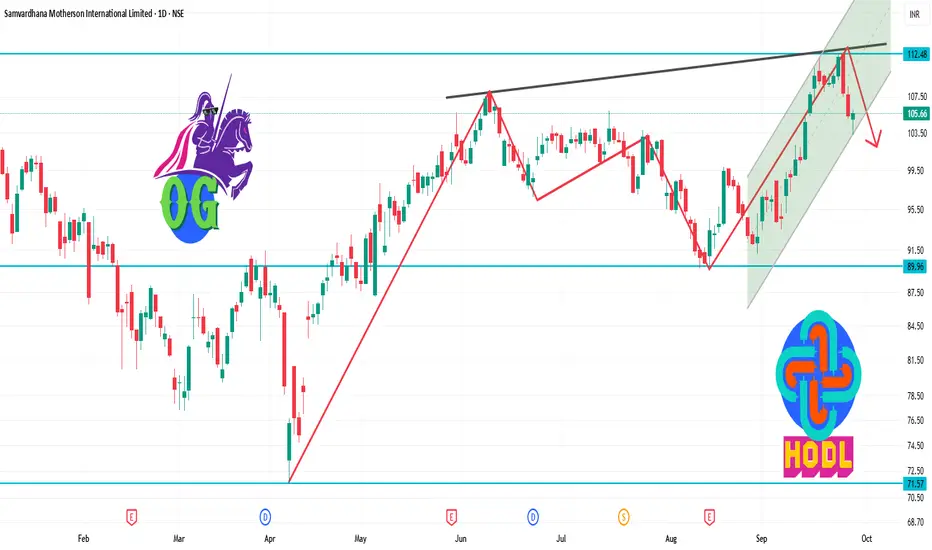
MOTHERSON 1D Time frameStock Snapshot
Closing Price: ₹105.66
Day's Range: ₹103.26 – ₹106.01
52-Week Range: ₹71.50 – ₹144.66
Market Cap: ₹1,11,518 crore
P/E Ratio (TTM): 33.54
P/B Ratio: 3.20
Dividend Yield: 0.80%
Book Value: ₹33.05
Beta: 1.64
Volume: 24,534,407 shares traded
VWAP: ₹104.93
Face Value: ₹1.00
📈 Performance Overview
1-Week Return: -3.14%
1-Month Return: +13.27%
YTD Return: +22.73%
1-Year Return: -11.16%
3-Year Return: +28.45%
5-Year Return: 0.00%
🧾 Financial Highlights
TTM EPS: ₹3.15
Net Sales (Latest Four Quarters): ₹9,271.58 crore
Net Profit (Latest Four Quarters): ₹605.86 crore
Shareholder's Funds: ₹1,676.80 crore
Total Assets: ₹3,089.00 crore
🔍 Technical Insights
Trend: Currently in a downtrend; price below VWAP indicates bearish momentum.
Support Levels: ₹103.26, ₹100.00
Resistance Levels: ₹106.01, ₹110.00
📌 Key Takeaways
Dividend: 50% (₹0.50 per share)
Bonus Issue: 1:2 ratio
Market Position: Strong over 3 years despite short-term volatility
Analyst Sentiment: Positive overall, short-term corrections possible
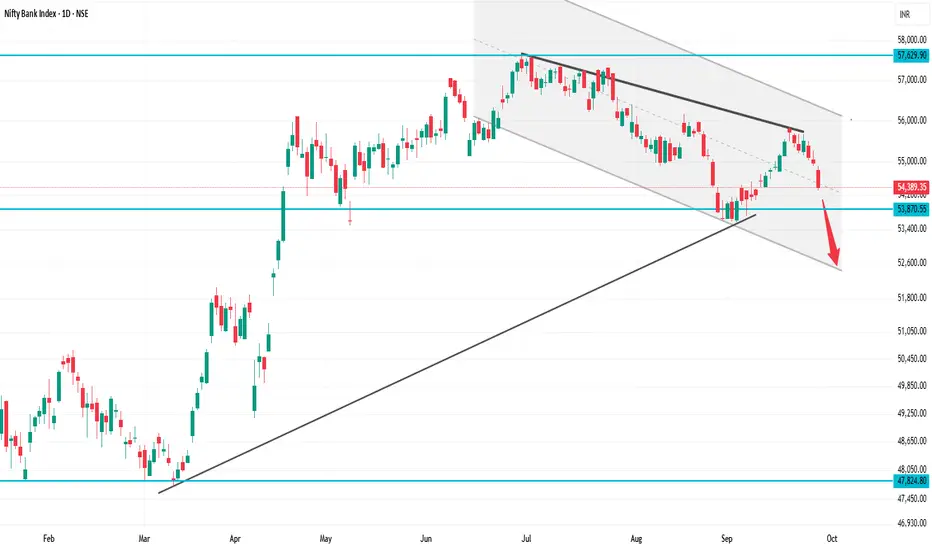
BANKNIFTY 1D Time frame
Previous Close: 55,121
Today Open: 55,061
Day’s High: 55,276
Day’s Low / Last: 54,389
⚡ Strategy
For Intraday / Short-Term Traders:
If BankNIFTY holds above 54,400 – 54,500, a small bounce toward 54,800 – 55,000 is possible.
If it fails to hold 54,400, expect more downside toward 54,000 – 53,800.
Bullish View (Only if recovery): Buy above 54,800 for targets 55,100 – 55,250, SL below 54,500.
Bearish View (Preferred): Sell on rise near 54,700 – 54,900 with SL above 55,000, targets 54,300 → 54,000.
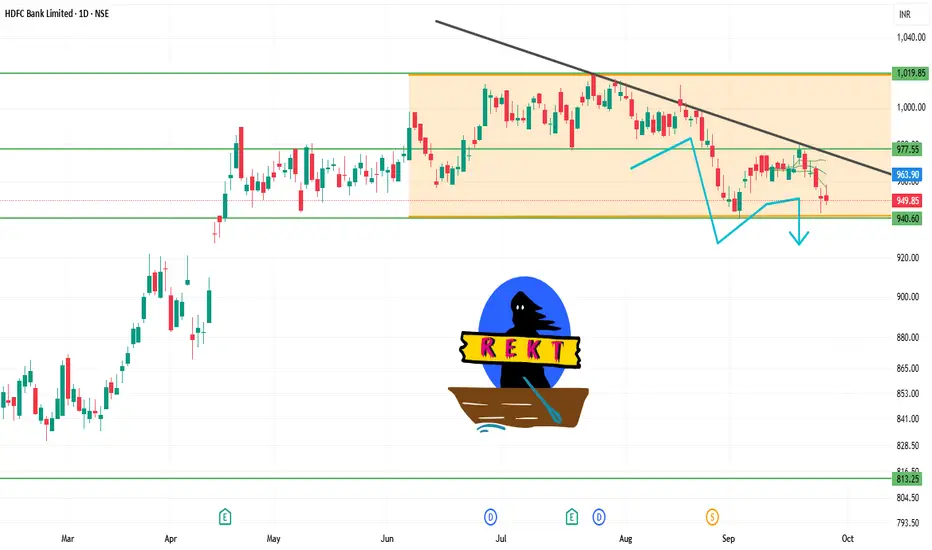
HDFCBANK 1D Time frame📊 Daily Snapshot
Closing Price: ₹949.20
Day’s Range: ₹947.40 – ₹958.00
Previous Close: ₹957.20
Change: Down –0.52%
52-Week Range: ₹806.50 – ₹1,018.85
Market Cap: ₹14.6 lakh crore
P/E Ratio: 20.66
Dividend Yield: 2.32%
EPS (TTM): ₹45.97
Beta: 0.92 (indicating lower volatility)
🔑 Key Technical Levels
Support Zone: ₹947.40 – ₹950.00
Resistance Zone: ₹957.20 – ₹960.00
All-Time High: ₹1,018.85
📈 Strategy (1D Timeframe)
1. Bullish Scenario
Entry: Above ₹957.20
Stop-Loss: ₹947.40
Target: ₹965.00 → ₹970.00
2. Bearish Scenario
Entry: Below ₹947.40
Stop-Loss: ₹957.20
Target: ₹940.00 → ₹935.00
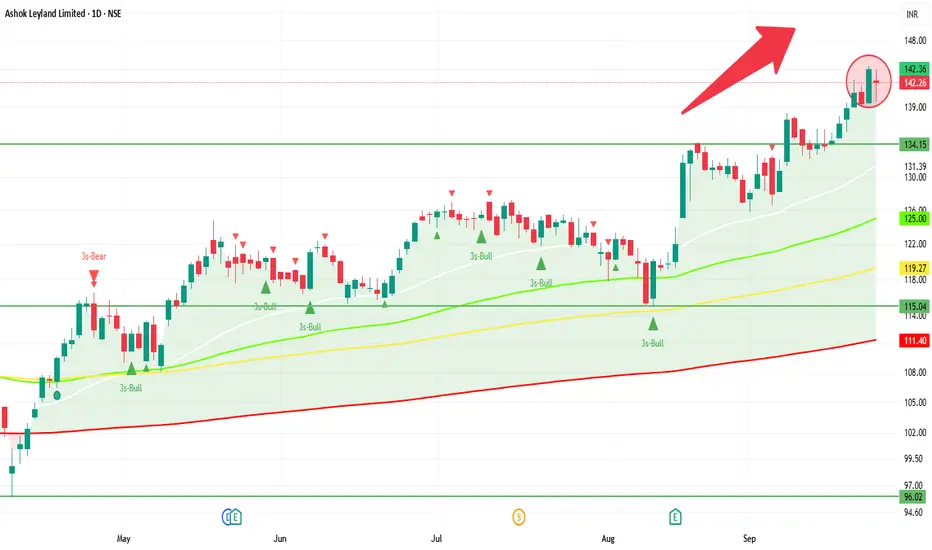
ASHOKLEY 1D Time frame📊 Today's Performance
Closing Price: ₹142.26
Day’s Range: ₹139.60 – ₹143.99
Previous Close: ₹144.04
Change: Down ~ –1.24%
52-Week Range: ₹95.93 – ₹144.50
Volume: ~36.96 million shares
Market Cap: ₹83,556 crore
P/E Ratio: 26.05
Dividend Yield: 4.39%
EPS (TTM): ₹5.46
🔍 Key Technical Levels
Support Zone: ₹139.60 – ₹140.00
Resistance Zone: ₹143.50 – ₹144.50
All-Time High: ₹144.50
📈 Strategy (1D Timeframe)
1. Bullish Scenario
Entry: Above ₹143.50
Stop-Loss: ₹141.50
Target: ₹146.00 – ₹148.00
2. Bearish Scenario
Entry: Below ₹139.60
Stop-Loss: ₹141.50
Target: ₹136.00 – ₹134.00
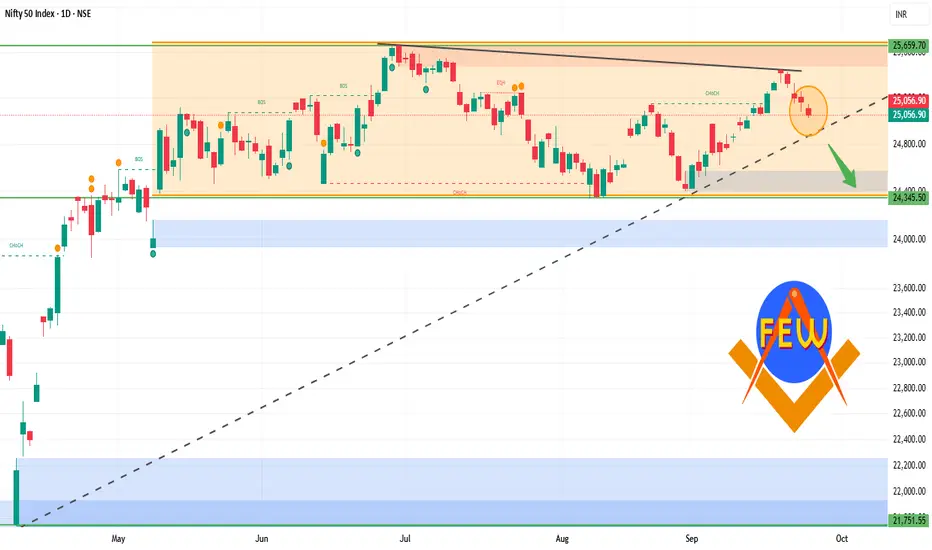
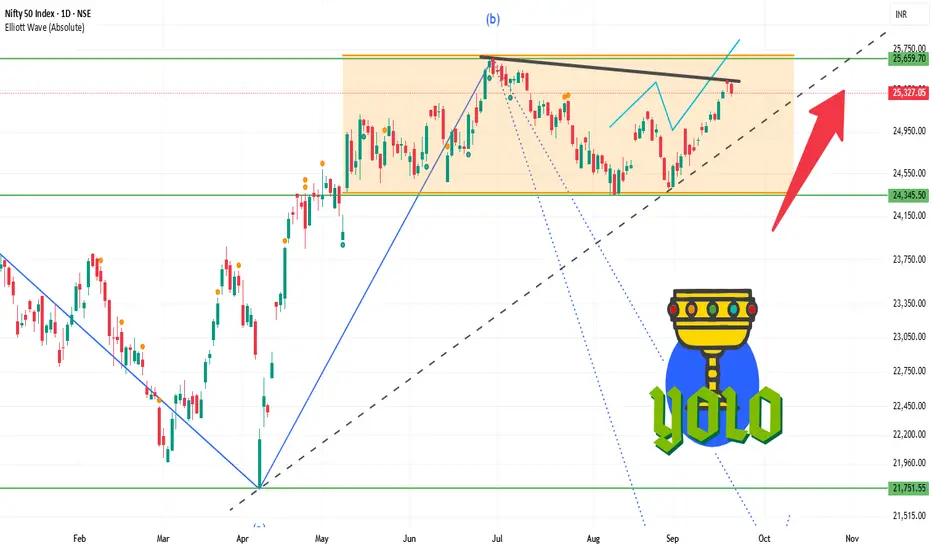
NIFTY 1D Time frame📊 Today’s Nifty Performance
Opening: Around 25,109
Closing: Around 25,057
Result: Market slipped about –52 points (–0.45%)
Range: High near 25,150, Low near 25,027
👉 If you were long (buy side) from the open and held till close → small loss (~52 points).
👉 If you were short (sell side) from the open and held till close → small profit (~52 points).
🎯 Key Levels
Support Zone: 25,000 – 25,020
Resistance Zone: 25,130 – 25,150
📝 Strategy
For Intraday Traders
Sell near resistance (25,130–25,150) with stop-loss just above 25,160.
Buy near support (25,000–25,020) with stop-loss just below 24,980.
For Swing Traders (2–3 days)
If Nifty sustains above 25,150, expect bounce toward 25,250+.
If Nifty breaks below 25,000, expect fall toward 24,900.
Risk Management
Use stop-loss always.
Don’t risk more than 1% of your capital on one trade.
Trail stop-loss if trade goes in your favor.
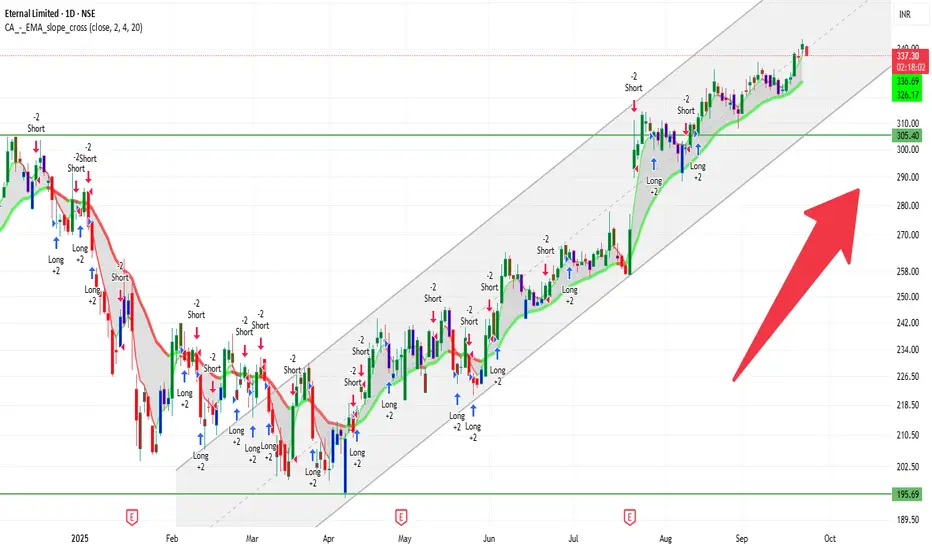
ETERNAL 1D Time frame📍 Today’s Expected Range (Intraday Approximation)
Expected High: ₹341–₹343
Expected Low: ₹336–₹335
These are approximate intraday levels. Actual prices may fluctuate slightly due to volatility.
🔍 Key Points
Current price: ₹337–₹338, trading near the middle of the day’s range.
If price breaks above ₹343 with strong volume → bullish momentum likely.
If price falls below ₹335 → short-term correction or pullback possible.
📊 Suggested Trading Strategy
Bullish Scenario
If Eternal breaks ₹341–₹343, you can buy, targeting ₹348–₹350.
Stop-loss: ₹335
Bearish Scenario
If Eternal drops below ₹335, you can sell/short, targeting ₹330–₹325.
Stop-loss: ₹338
Range-Bound / Sideways
If price trades between ₹335–₹343, it’s better to wait and avoid trading until a clear breakout occurs.
💡 Summary
Resistance Zone: ₹341–₹343
Support Zone: ₹335–₹336
Strategy: Trade in the direction of the breakout, and always use stop-loss to manage risk.
HDFCBANK 1D Time frame📍 Current Price & Range
Current price: ₹964.20
Day’s High / Low: ₹968.20 / ₹955.50
52-week High / Low: ₹1,018.85 / ₹806.50
🔍 Key Levels (with current context)
Immediate support: ₹955-₹958
Stronger support: ₹945-₹950
Immediate resistance: ₹970-₹975
Next resistance: ₹980-₹985
Major psychological resistance: ₹1,000+
📊 Indicators & Momentum
Price is near resistance zone (₹964-₹967), showing hesitation.
Holding above ₹955 is important for stability.
Price is below the 50-day moving average → short-term weakness.
Still above the 200-day moving average → long-term structure remains intact.
RSI around 40-45 → momentum is neutral to slightly weak.
🔮 Possible Scenarios
Bullish breakout: Above ₹975-₹980 with volume → upside toward ₹1,000–₹1,018.
Sideways: Between ₹955–₹975 until a decisive breakout.
Bearish pullback: Below ₹955 → could slide toward ₹945-₹950 or even ₹940.
👉 Outlook: At the current level (₹964), the stock is sitting close to resistance. It needs strength above ₹975 to turn bullish; otherwise, it risks drifting back toward ₹955 support.

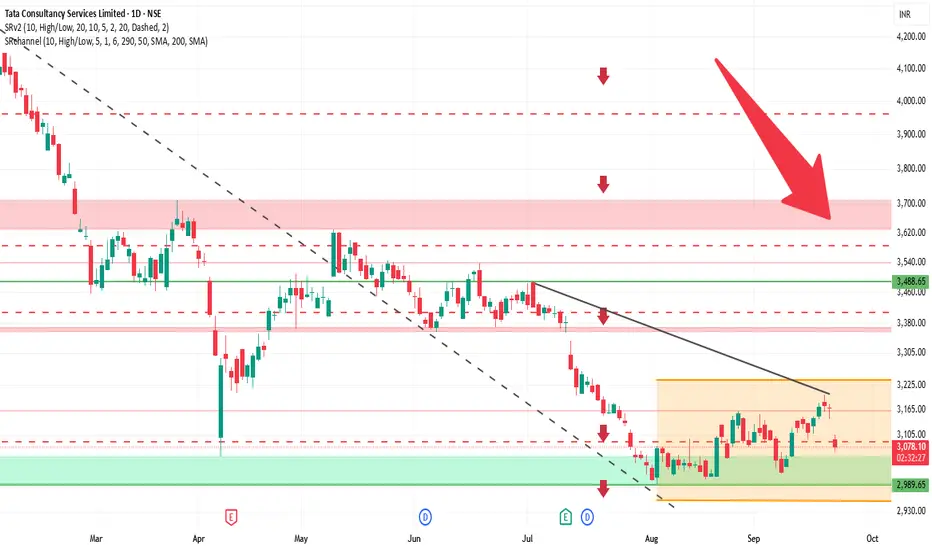
TCS 1D Time frame🔍 Current Price & Context
Trading around ₹3,089
Day’s range: ₹3,065 – ₹3,107
Previous close: ₹3,171
Market sentiment: Bearish, influenced by external factors affecting IT stocks.
📊 Technical Indicators
Moving Averages: Short-term averages are slightly above current price, acting as resistance.
RSI (14): ~30, indicating oversold conditions.
MACD: Negative, showing bearish momentum.
Stochastic Oscillator: Oversold, may suggest a short-term reversal.
CCI (20): Below zero, confirming bearish trend.
ROC (20): Negative, indicating declining momentum.
🧮 Strategy / Trade Ideas
Long Setup:
Entry near support (~3,050) if bullish reversal appears
Stop Loss: Below 3,000
Targets: 3,100 first, then 3,150
Short / Pullback Setup:
Entry if price fails near resistance (~3,100)
Stop Loss: Above 3,150
Targets: 3,050 first, then 3,000
✅ Summary
TCS on daily chart is bearish but oversold. Watch immediate support (~3,050) for potential reversal, and resistance (~3,100 – 3,120) for pullback risk. A breakout above resistance could target 3,150+, while failure of support may lead toward 3,000.
SENSEX 1D Time frame🔍 Current Market Snapshot
Current Level: 82,439.48
Day’s Range: 82,151.07 – 82,583.16
Previous Close: 82,626.23
Market Sentiment: Neutral to mildly bearish
📊 Technical Indicators
Moving Averages: The Sensex is trading slightly below its short-term moving averages, indicating potential resistance.
RSI (14): Approximately 50, suggesting a neutral stance with no clear overbought or oversold conditions.
MACD: Neutral, with the MACD line and signal line close together, indicating indecision in market momentum.
🧮 Strategy / Trade Ideas
Long Setup:
Entry: Consider entering near support levels (~82,200) if bullish reversal signals appear.
Stop Loss: Place below 82,000 to manage risk.
Target: First resistance around 82,600, then 82,900.
Short Setup:
Entry: If price fails to break above resistance (~82,600) and shows signs of reversal.
Stop Loss: Above 82,900.
Target: Downside toward 82,200, then 81,800

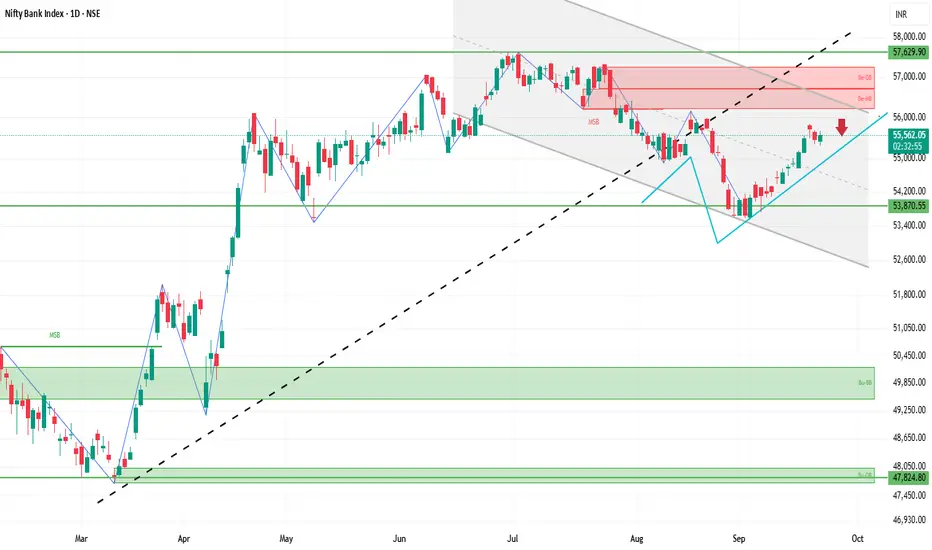
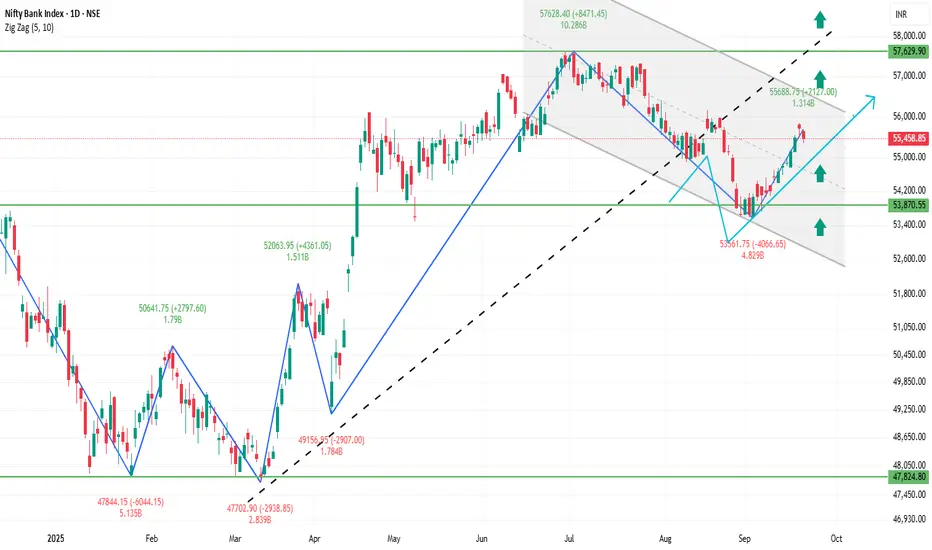
BANKNIFTY 1D Time frame🔍 Current Market Snapshot
Current Level: ₹55,541.30
Day’s Range: ₹55,315.55 – ₹55,666.35
52-Week Range: ₹47,702.90 – ₹57,628.40
Previous Close: ₹55,458.85
Market Sentiment: Neutral to mildly bearish
📊 Technical Indicators
Moving Averages: The BANKNIFTY index is trading slightly below its short-term moving averages, indicating potential resistance.
RSI (14): Approximately 50, suggesting a neutral stance with no clear overbought or oversold conditions.
MACD: Neutral, with the MACD line and signal line close together, indicating indecision in market momentum.
Stochastic Oscillator: Neutral, fluctuating around the midline, reflecting a lack of strong directional movement.
🧮 Strategy / Trade Ideas
Long Setup:
Entry: Consider entering near support levels (~₹55,300) if bullish reversal signals appear.
Stop Loss: Place below ₹54,800 to manage risk.
Target: First resistance around ₹55,800, then ₹56,200.
Short Setup:
Entry: If price fails to break above resistance (~₹55,800) and shows signs of reversal.
Stop Loss: Above ₹56,300.
Target: Downside toward ₹55,300, then ₹54,800.
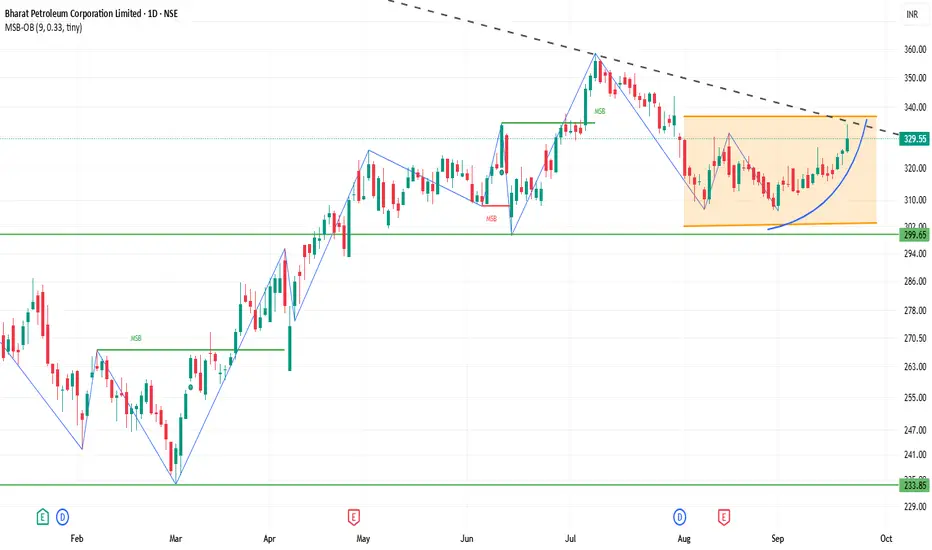
BPCL 1D Time frame📊 Current Snapshot
Closing Price: ₹329.55
Day's Range: ₹324.80 – ₹334.00
52-Week Range: ₹234.01 – ₹376.00
Market Capitalization: ₹1,42,975 Crores
Volume: Approximately 10 million shares traded
P/E Ratio: 8.14
Dividend Yield: 2.99%
⚙️ Technical Indicators
Relative Strength Index (RSI): 60.31 – Neutral to slightly bullish
Moving Average Convergence Divergence (MACD): 0.29 – Neutral
Moving Averages: Short-term averages (5, 10, 20, 50, 100, 200-day) are above the current price, indicating potential resistance.
Pivot Points: Central pivot around ₹322.30, suggesting a balanced market sentiment.
🎯 Possible Scenarios
Bullish Scenario: A breakout above ₹328.25 with strong volume could target ₹331.80 and higher levels.
Bearish Scenario: Failure to hold above ₹325.85 may lead to a decline toward ₹322.30.
⚠️ Key Considerations
Market Sentiment: BPCL has shown strong performance recently, but broader market conditions can impact its movement.
Volume Analysis: Watch for volume spikes to confirm breakout or breakdown signals.
Technical Indicators: While the RSI indicates a neutral to slightly bullish stance, the MACD and moving averages suggest caution.
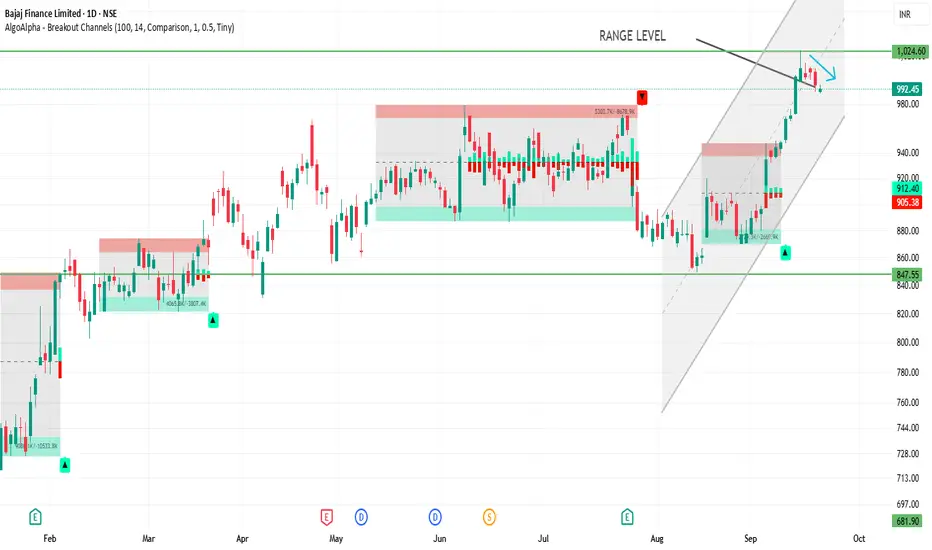
BAJFINANCE 1D Time frame📊 Current Snapshot
Current Price: Around ₹993
52‑Week High: ~ ₹1,025
52‑Week Low: ~ ₹640
Recent Trend: Positive short-term momentum with weekly gain ~2% and monthly gain ~10%
🔍 Support & Resistance
Immediate Support: ₹960 – ₹954
Next Support: ₹946
Immediate Resistance: ₹975 – ₹983
Higher Resistance: ₹989 – ₹990
⚙️ Technical Indicators
RSI (14): ~45–46, neutral stance
MACD: Slightly negative, indicating weak bearish momentum
Moving Averages: Mixed; short-term MAs below price (support), long-term MAs above price (resistance)
🎯 Possible Scenarios
Bullish: Break above ₹983 with volume could push toward ₹990+
Bearish: Fall below ₹960 may lead toward ₹946
⚠️ Key Points
Price is near support/resistance zones; breakout requires strong volume
Trend is positive in the short term, but caution needed near resistance levels
Combine with market sentiment and risk management before trading
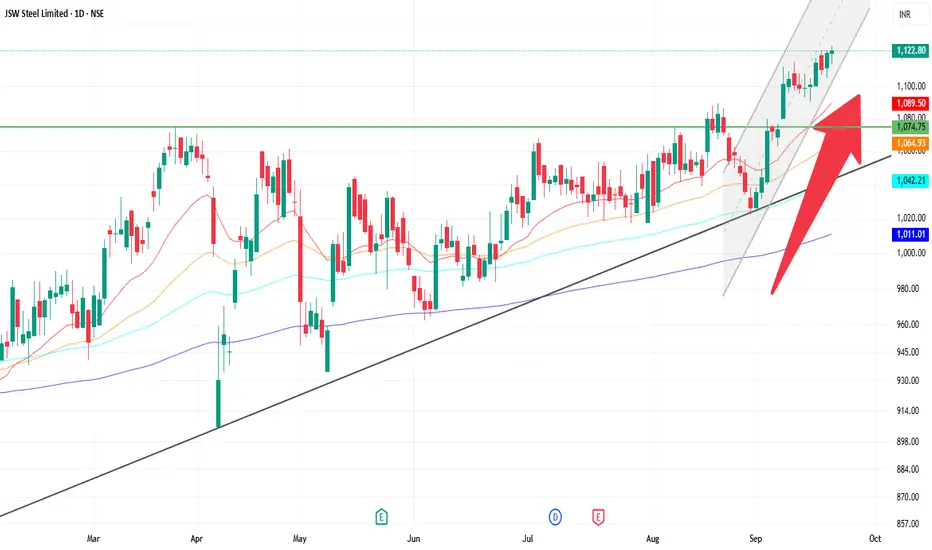
JSWSTEEL 1D Time frame📊 Current Overview
Current Price: Around ₹1,122 – ₹1,123
Recently touched 52-week high levels.
Trend is overall bullish with strong momentum.
🔍 Support & Resistance
Immediate Support: ₹1,110 – ₹1,100
Next Support: ₹1,085
Immediate Resistance: ₹1,125 – ₹1,130
Next Resistance: ₹1,140+
📈 Indicators
Moving Averages (5, 10, 20, 50, 100, 200): All pointing bullish, price is trading above them.
RSI (14): Around 67, showing strong momentum but close to overbought zone.
MACD & ADX: Both suggest continuation of uptrend.
🎯 Possible Scenarios
Bullish Side: A breakout above ₹1,130 can push towards ₹1,140 – ₹1,150.
Bearish Side: If price rejects at resistance, it may pull back to ₹1,110, and deeper towards ₹1,085.
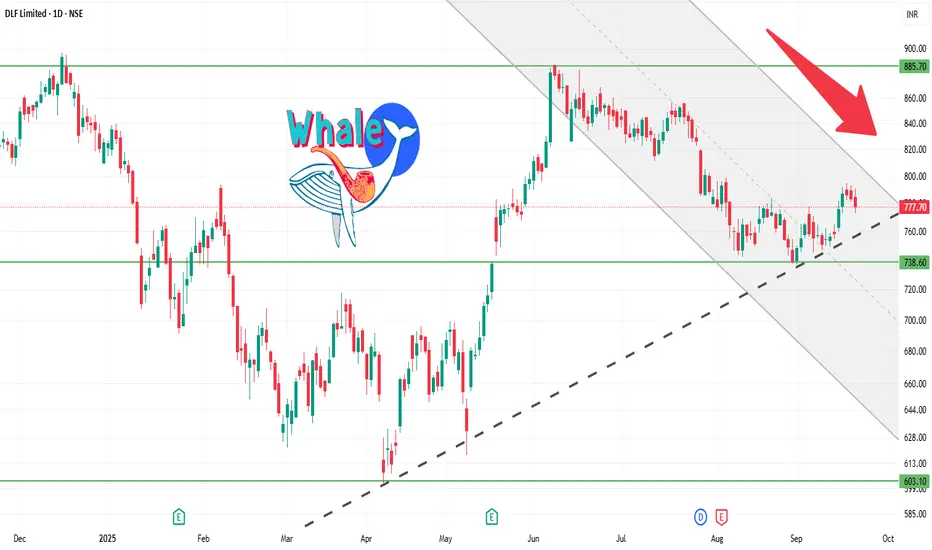
DLF 1D Time frameCurrent Price: Around 780 – 790.
Current Trend: Stock is in a strong uptrend, consolidating after recent highs.
Support Zone: Strong support at 770 – 775. Buyers are likely to defend this level.
Resistance Zone: Key resistance at 800 – 810. A breakout above this can lead to fresh upside.
Indicators: Daily candles show higher lows forming, indicating strength; volumes are healthy.
Outlook:
Above 810 → bullish momentum may continue toward 830+.
Below 770 → weakness may drag it toward 750.
👉 In short:
Tone: Bullish with consolidation.
Range: 770 – 810.
Shall I also prepare a re
BANKNIFTY 1D Time frameCurrent Trend: BANKNIFTY is showing consolidation with mild bullish bias.
Support Zone: Strong support lies near 55,200 – 55,400. If this holds, buyers may remain active.
Resistance Zone: Key resistance is around 55,800 – 56,000. A breakout above this can bring strong momentum.
Indicators: Daily structure is stable; candles show demand near support zones.
Outlook:
Above 56,000 → fresh rally possible.
Below 55,200 → weakness can extend.
👉 In short:
Sideways to bullish.
Strength above 56,000, weakness below 55,200.
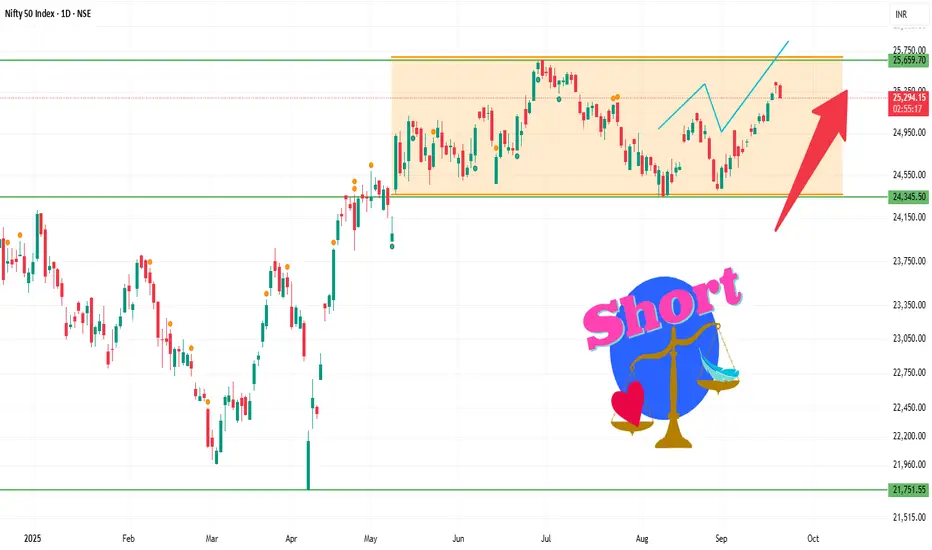
NIFTY 1D Time frameCurrent Trend: Market is moving sideways with limited momentum.
Support Zone: Strong support is around 25,200 – 25,250; bounce is possible from here.
Resistance Zone: If NIFTY sustains above 25,350 – 25,400, fresh upward momentum may come.
Indicators: Daily candle shows buyers are slightly in control, but resistance breakout is important.
Outlook: As long as NIFTY holds above 25,200, the uptrend remains safe. A close above 25,400 can trigger new buying.
👉 In short:
Sideways to bullish tone.
Weakness below 25,200, strength above 25,400.
Nifty 1D Time frameCurrent Facts
Current Level: ~25,300–25,310
Trend: Mildly bullish; Nifty is trading above short-term moving averages (20-day & 50-day EMA).
Momentum Indicators:
RSI (14-day): ~60 → positive but not overbought.
MACD: Positive → supports short-term bullish bias.
Price Action: Daily candles show small upper wicks → slight profit-booking near resistance levels.
⚙️ Outlook
Bullish Scenario:
Holding above 25,270 → retest 25,350–25,370 and possibly 25,420–25,450.
Range / Consolidation:
Price oscillates between 25,270 – 25,350 → sideways action expected.
Bearish Scenario:
Close below 25,250 → downside risk toward 25,180–25,200 or lower.
⚠️ Facts
25,300–25,310 acts as a short-term pivot — above it favors bulls, below it favors bears.
Immediate resistance is at 25,350–25,370; breakout here can trigger upside momentum.
Support at 25,250 is crucial; failure to hold may result in deeper correction.
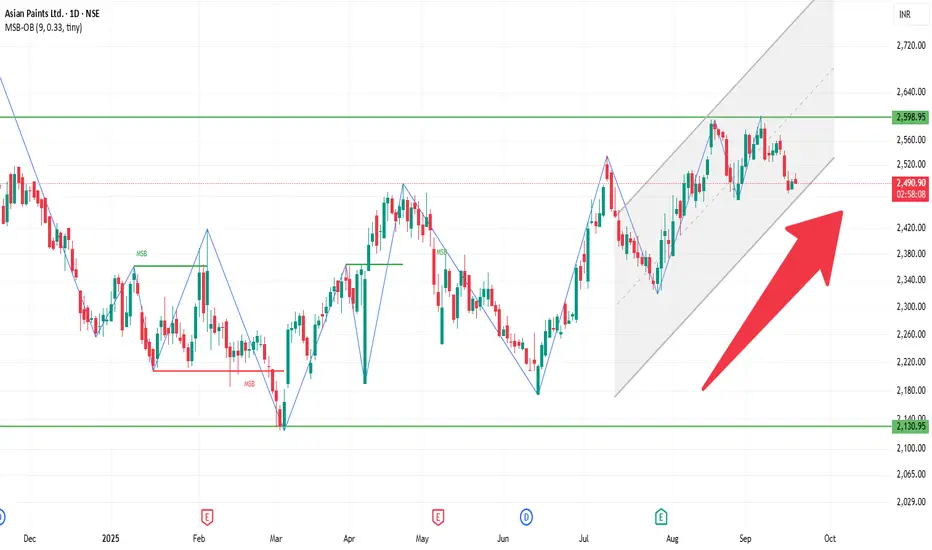
ASIANPAINT 1D Time frameCurrent View
The stock is trading around ₹2,490-₹2,500, roughly in that band.
Recent price action suggests sideways to slightly negative bias in the short term.
The stock is below many of its medium-to-long term moving averages, but above some short term ones — mixed signals.
⚙️ Indicators & Momentum
RSI is in neutral to slightly weak territory (not deeply oversold, not overbought).
MACD shows bearish pressure in recent periods.
Some oscillators & momentum tools showing mild divergence, meaning upward momentum is not strong.
Short-term moving averages are giving mixed signals: some support, some resistance.
📌 Key Levels to Watch
Resistance Zones: ~ ₹2,520-₹2,550 is a resistance range.
Support Zones: ~ ₹2,450-₹2,470 nearer support. More substantial support around ₹2,400-₹2,430.
BAJFINANCE 1D Time frameCurrent Overview
Price is trading around ₹995 – ₹1,008.
Recently touched a 52-week high near ₹1,025.
Stock is moving above 50-day and 200-day moving averages, showing a strong uptrend.
⚙️ Indicators (Daily)
RSI (14) → Slightly overbought, but still stable.
MACD & Momentum → Mixed to positive, buyers still in control.
Volume → Strong volume seen near recent highs, showing active participation.
📌 Key Levels
Immediate Resistance: ₹1,010 – ₹1,025 (recent top).
Immediate Support: ₹995 – ₹1,000 (nearby cushion).
Stronger Support: ₹950 – ₹980 zone (50 & 100-day moving averages).