Kaynes tech (W): Bullish - V-Shape Recovery from Panic BottomTimeframe: Weekly | Scale: Logarithmic
The stock is staging a classic reversal from the bottom of its 6-month consolidation range. The recent panic drop was absorbed by "smart money," as evidenced by the massive volume Hammer candle.
📉 1. The Context (The Panic & Absorption)
> The Trigger: The sharp drop to ₹3,745 in early December was triggered by a brokerage note raising concerns about disclosures.
> The Absorption (The Hammer):
- Price Action: The stock plunged to a low of ₹3,712 but rallied sharply to close near ₹4,265 . This created the long lower wick (Hammer).
- Volume (61 Million): This massive volume confirms that while retail investors panic-sold, institutional buyers stepped in to buy the dip at the valuation floor. This is Climax Volume.
🕯️ 2. Current Price Action (The Pause)
> This Week's Candle: The "Neutral Bearish" candle (Spinning Top/Doji) with lower volume ( 15.06 Million ).
- Interpretation: After the violent volatility of the previous week, this "quiet" week is positive. It shows that the selling pressure has evaporated (volume dropped from 61M to 15M), and the price is stabilizing above ₹4,100 .
📊 3. Technical Indicators
> RSI Divergence: RSI rising from oversold territory confirms the momentum shift.
> Range Play: The stock is strictly following the ₹3,745 (Support) – ₹7,800 (Resistance) box. Trading at the bottom of the box offers the highest Risk:Reward ratio.
🎯 4. Future Scenarios & Trade Setup
The strategy is a classic "Range Trade."
> 🐂 Bullish Case (The Journey to Top):
- Trigger: A breakout above this week's high ( ~₹4,390 ).
- Target 1: ₹5,500 (Mid-range resistance).
- Target 2: ₹7,822 (The ATH). A move from support to resistance represents a ~100%+ potential gain .
>🛡️ Support (The Stop Loss):
- Critical Stop: ₹3,700 . The low of the Hammer candle is the "Line in the Sand." If the price breaks this, the "absorption" thesis fails.
Conclusion
This is a High-Conviction Setup . The Hammer on Climax Volume at major support is one of the most reliable signals in technical analysis.
> Refined View: The "Panic" is over. The "Accumulation" is done. The stock is now likely to drift upwards as the governance fears fade and the focus shifts back to its Semiconductor expansion plans.
KAYNES

#KAYNES Hits Short-Term Support — Bigger Levels Ahead!📉 🚨
KAYNES is trading inside a falling channel and just tested the bottom of the yellow channel , triggering a short-term bounce 🔄
But this isn’t a long-term support zone — no bottom fishing here!
Price can still slide toward 3113–3249 or even 2158–2362 , where true bottoming signals may appear 👀
Resistances: 5318–5476 / 4457–4650
Supports: 3726–3825 / 3113–3249 / 2158–2362
Stay cautious and wait for real reversal signs, not the CMP bounce ⚠️
#KAYNES #NSE #BSE #PriceAction #TechnicalAnalysis #TrendAnalysis #LongTerm
📌 #Disclaimer: This analysis is shared for educational purposes only. It is not a buy/sell recommendation. Please do your own research before making any trading decisions.

KAYNES - Oversold Demand-Zone Reversal Attempt💹 Kaynes Technology India Ltd (NSE: KAYNES)
Sector: Electronics Manufacturing | CMP: 4331 | View: Oversold Demand-Zone Reversal Attempt
Price Action
Kaynes witnessed a sharp vertical decline from the 7800 supply belt and has now landed directly on its major multi-month demand zone between 3710–3900. The latest session delivered a wide-range bullish reaction candle, signalling early evidence of absorption after a heavy liquidation phase. Price is currently stabilizing within a critical structure where further downside may ease if demand continues to hold.
VCP Analysis
The stock has moved from a wide high-volatility decline into the first compression point at the lower demand cluster. Although not a textbook VCP, the pattern resembles early-stage volatility contraction after a capitulation event. Buyers have shown intent inside the zone, and any narrowing of daily ranges around 4000–4300 may signal the beginning of a reclaiming structure.
STWP Trading Analysis
Momentum indicators show downward fatigue — RSI is deep oversold and beginning to curl, MACD histogram reflects slowing bearish force, and Stochastic is trying to reverse from lower bounds. Price behaviour suggests the initial capitulation may be complete, as the sudden spike in volume indicates potential strong-handed accumulation. The trend remains broadly negative, but the first signs of stabilization are visible. Sustaining above 3884 keeps the recovery sequence alive; losing it can re-open downside continuation.
Fibonacci Analysis
Using the swing high at 7822 and swing low at 3712:
0.236 Retracement: 4682
0.382 Retracement: 5282
0.5 Retracement: 5767
Kaynes currently trades below all key retracement levels. A clean push above 4606–4682 (Fib 0.236 region) is essential to unlock further retracements. These levels will act as layered resistance zones during the potential upside path.
STWP Support & Resistance
Strong Supports: 3884 (Primary demand support) | 3437 | 3161
Overhead Resistances: 4606 | 4882 | 5329
Price is positioned directly above major structural support with massive volume backing — a region where reversals traditionally form if sustained accumulation continues.
STWP Volume & Technical Setup
Volume hit an exceptionally high reading, reflecting a potential capitulation or institutional absorption event. Such spikes often mark the beginning stages of a base. The EMAs are widely stretched — a characteristic of trend exhaustion — and may gradually compress if price stabilizes. The volume–price behaviour hints at shift in market tone, where forced selling may have met deep-pocket buyers at the demand floor.
⚠️ STWP Legal Disclaimer
This document is strictly for educational and informational purposes. All examples, charts, levels, and option structures discussed are illustrative and are not intended as buy, sell, or hold recommendations. STWP does not provide investment advice, trading tips, signals, or personalized financial guidance of any kind, nor is it a SEBI-registered intermediary or research analyst. The analyses, illustrations, and risk–reward structures included here are generic in nature and based on publicly available data and observed market behaviour, which may change without notice. Financial markets involve significant risk; derivatives in particular carry the potential for substantial losses. Option premiums, implied volatility, open interest, delta, and other market variables can fluctuate rapidly and unpredictably.
Readers are solely responsible for their trading decisions, capital management, and risk assessment. Before making any investment or trading decision, please consult a SEBI-registered investment advisor. STWP, its representatives, and affiliates shall not be liable for any direct or indirect loss arising from the use of this material. Historical patterns or past market behaviour do not guarantee future outcomes, nor should any part of this document be interpreted as a promise of performance, accuracy, or returns.
Position Status: No active position in this instrument at the time of analysis.
Data Source: TradingView & NSE India.
💬 Found this useful?
🔼 Boost this post to support structured learning
✍️ Share your thoughts or questions in the comments
🔁 Forward this to traders who value clean technical studies
👉 Follow for disciplined, structured, STWP-style analysis
🚀 Stay Calm. Stay Clean. Trade With Patience.
Trade Smart | Learn Zones | Be Self-Reliant 📊

Kaynes Technology is at a crucial breakout zone:
Setup: Price consolidating within a symmetrical triangle, now testing the upper trendline.
Indicators:
RSI ~58, just entering bullish zone, but not overbought.
MACD turning positive → momentum aligning with trend.
EMAs: 20 & 50 EMA aligned upward; price holding above 6,000.
Levels:
Targets: ₹6846 , ₹7,203, ₹7711
Stoploss: ₹6190
👉 Outlook: Break and sustain above ₹6,500 can trigger fresh momentum towards ₹7,000+. Support at ₹6190 is critical.

KAYNES TECHNOLOGY IND LTD – Price Action + ZonesKAYNES TECHNOLOGY IND LTD – Price Action + Zones
Ticker: NSE:KAYNES | Sector: Electronics & Semiconductors
Timeframe: 15-Min | Current Price: ₹6,200.00 ▲ (+0.49%)
Technical View: ⭐⭐⭐⭐ | Chart Setup: Breakout with Zone-Based Trade Planning
Kaynes Technology (NSE:KAYNES) has exhibited strong directional momentum following a structured breakout above a prior consolidation range, as seen on the 15-minute chart. The price surged past intermediate resistance near ₹5,990 and is currently stabilizing around ₹6,200, suggesting trend continuation if supported by further volume. Marked zones like the Top Range (₹6,284) and Bottom Range (₹5,405) provide a visual framework to understand price behavior—where strength above upper resistance may invite bullish setups, while failure to hold could signal re-entry into the lower band. A clearly defined demand zone (₹5,850–₹5,764.50) with an example SL near ₹5,755 offers a contextual learning area to study zone-based entries with risk-reward alignment. Observing volume expansion on the breakout and contraction during consolidation is key for interpreting trend strength. The annotation “Trade as per Trend + Supporting Setup” reinforces the importance of directional bias and confluence. All observations are shared to help learners understand breakout structure, demand zones, and price-volume correlation in a real-world context.
⚠️ Disclaimer & Educational Note
This content is strictly intended for educational and research purposes related to the technical study of Kaynes Technology (NSE:KAYNES). I am not a SEBI-registered advisor, and no buy/sell recommendations are being made. All insights are based on personal chart analysis, price-action interpretation, and educational zone-mapping — not financial advice.
📘 The visual setup in this post demonstrates how traders and learners can study breakout structures, demand/supply zones, price-volume behavior, and risk levels in a controlled technical environment. Tools like support/resistance mapping, volume confirmation, and structure-based SL planning help illustrate disciplined trade preparation. However, trading — particularly in leveraged instruments like options or intraday setups — involves substantial risk, and losses can exceed the initial investment.
👉 Always do your own due diligence and consult a SEBI-registered investment advisor before taking any positions in the market.
👉 Practice strict risk management, and only trade with capital you can afford to lose.
The author assumes no responsibility for financial decisions based on this educational content. By engaging with this content, you acknowledge and accept these terms.
💬 Found this helpful?
Drop your thoughts, questions, or insights in the comments below ⬇️ — let’s learn together!
🔁 Share this post with your trading friends and community — help them discover clean charts, structured setups, and zone-based learning.
✅ Follow simpletradewithpatience for clear setups, educational content, and a no-nonsense approach to price action, supply-demand zones, and risk-managed trades.
🚀 Trade with patience. Trust your charts. Stay clear-headed.
Because the goal is not just to trade — it's to trade better.
Be Self-Reliant | Trade with Patience | Learn with Charts & Zones 📊

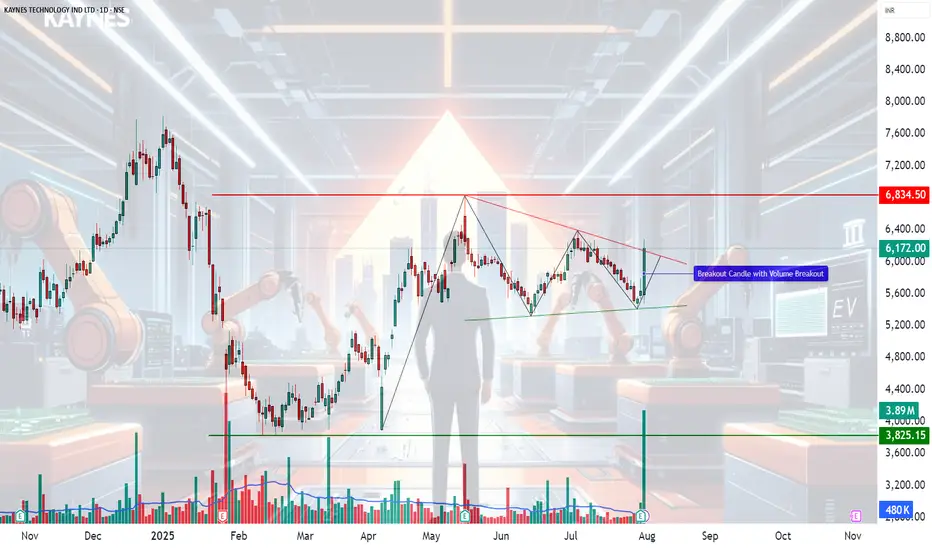
KAYNES TECHNOLOGY IND LTD – Technical Analysis________________________________________
🧠 KAYNES TECHNOLOGY IND LTD – Technical Analysis
Ticker: NSE:KAYNES | Sector: EMS & Semiconductors
Current Price: 6,172.00 ▲ (+9.5% on July 31, 2025)
Technical View: ⭐⭐⭐⭐ | Chart Pattern: Falling Wedge Breakout
________________________________________
📈 Technical Overview
🔹 Chart Pattern Formed: Falling Wedge Breakout with extremely high volume confirmation
🔹 Breakout Zone: 6,000–6,050
🔹 Momentum Signals:
— RSI breakout above 60
— Strong bullish candle with rising volume
— VWAP and SuperTrend aligned bullish
🔹 Support Trendline Held on multiple touchpoints
🔹 Breakout Candle marked by heavy institutional volume
________________________________________
📰 Key Fundamental Developments
✅ Q1 FY26 PAT up ~50% YoY to 74.6 Cr
✅ Gross margin expanded to 41%, EBITDA margin to 16.8%
✅ Strategic acquisitions from Fujitsu (85 Cr domestic + 118 Cr JV with L&T)
✅ Strong order book visibility (~7,400 Cr)
✅ Raised 1,600 Cr via QIP to fund growth
________________________________________
📊 Sentiment Analysis
Sentiment: ✅ Positive
— Strong earnings beat and margin expansion
— Global expansion through Fujitsu JV
— Bullish commentary from major brokerages
— Institutional confidence via QIP and upgrades
________________________________________
🔼 Resistance Levels
6,400 – Immediate breakout target
6,834 – Top of consolidation range
7,285 – Medium-term resistance (historic supply zone)
🔽 Support Levels
5,970 – Breakout retest zone
5,700 – Structure base
5,170 / 4,864 – Deep support for longer-term invalidation
________________________________________
📌 What’s Catching Our Eye
🔹 Volume spike confirms genuine breakout
🔹 RSI, SuperTrend, VWAP – all flashing bullish
🔹 Back-to-back bullish closes after a 10 day contraction breakout
🔹 Volume & price action aligned across multiple timeframes
________________________________________
👀 What We’re Watching For
🔸 Follow-through momentum toward 6,400+
🔸 Whether breakout holds above 5,970 in coming sessions
🔸 Semiconductor line execution progress
🔸 Margin trends in upcoming quarters
________________________________________
⚠️ Risks to Monitor
⚠️ Rich valuations (~130x P/E) – limited room for disappointment
⚠️ Execution risk on new lines and acquisitions
⚠️ Global slowdown in electronics & macro headwinds
⚠️ Any delay in semiconductor segment scale-up
________________________________________
🔮 What to Expect Next
🔹 Retest of breakout zone (~6,000–6,050) possible
🔹 If held, expect momentum toward 6,400–6,800
🔹 Sideways consolidation likely if volumes taper
🔹 Strong close above 6,400 could initiate fresh uptrend leg
________________________________________
📈 Strategy Insight (For Educational Purposes Only)
— Aggressive Traders: Watch level of 6284
— Momentum Traders: Watch 6,050 retest for low-risk entry
— Risk Management: Position sizing + Capital risk – as per individual preference
________________________________________
💬 Why It’s On Our Watchlist
Kaynes blends EMS scale with high-margin ODM design and semiconductor upside. Rare in India’s listed space. Strong revenue visibility, global expansions, and balance sheet strength make it a high-conviction long-term story.
________________________________________
📉 If Price Comes Down…
5,700–5,800 is a critical support zone. Breakdown below this with volume = trend weakness. 5,400 is final demand zone before structural damage.
________________________________________
🪙 Educational Insight for Learners
This chart is a real-world example of a falling wedge breakout confirmed by volume. The key takeaway: price alone is not enough—watch volume, RSI, and structure. Never chase momentum without a plan. Always pair conviction with discipline.
________________________________________
🚨 Reminder: No stock is a “sure thing.” Use proper risk management. Stay rational when others get emotional.
________________________________________
⚠️ Disclaimer (Please Read Carefully):
This content is shared strictly for educational and research purposes only.
I am not a SEBI-registered investment advisor, and no buy or sell recommendations are being made.
All views expressed are based on personal market analysis and experience. They are not intended as financial advice.
Trading — especially in derivatives like options — involves significant financial risk. Losses can exceed your initial investment.
👉 Always do your own research and consult a certified SEBI-registered advisor before making any investment or trading decisions.
👉 Use proper risk management and only trade with capital you can afford to lose.
The author assumes no responsibility or liability for any trading losses incurred from acting on this content.
By engaging with this material, you agree to these terms.
________________________________________
💬 Found this helpful?
Drop your thoughts, questions, or insights in the comments below ⬇️ — let’s learn together!
🔁 Share this post with your trading friends and community — help them discover clean charts, structured setups, and zone-based learning.
✅ Follow simpletradewithpatience for clear setups, educational content, and a no-nonsense approach to price action, supply-demand zones, and risk-managed trades.
🚀 Trade with patience. Trust your charts. Stay clear-headed.
Because the goal is not just to trade — it's to trade better.
Be Self-Reliant | Trade with Patience | Learn with Charts & Zones 📊
KAYNES#KAYNES
A good semiconductor company,,
Looking good for upside
need to confirm if it closes with a
good green candle above the resistance line.

KaynesPrice has been forming parallel channel since May 2024
once the recent high is taken out then we may expect good move above that
