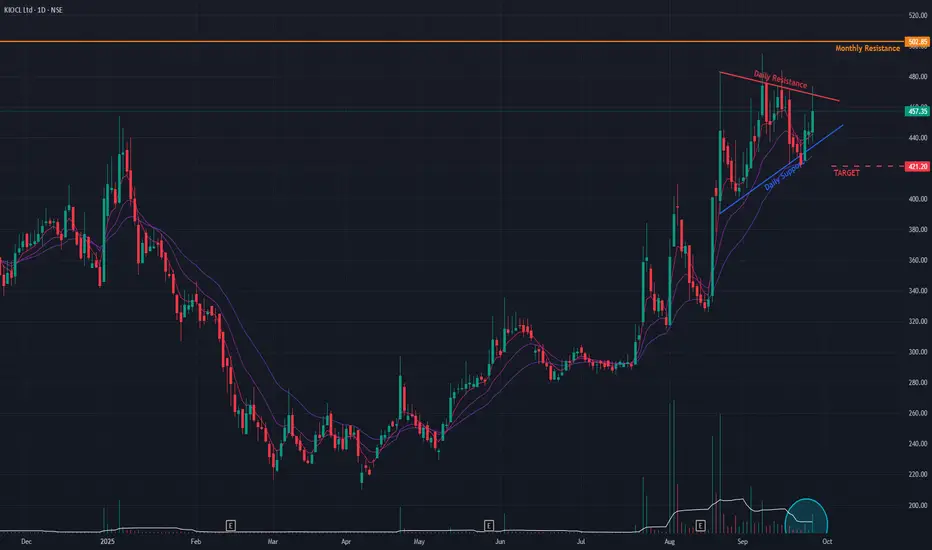
KIOCL (D) - Consolidates in Bullish Pattern After Massive RallyFollowing a powerful uptrend that has seen the stock gain over 125% since its bullish reversal in April 2025, KIOCL is now consolidating in a bullish Flag & Pole pattern . This chart formation is typically a continuation pattern, suggesting that the prior uptrend is likely to resume after this brief pause.
The stock is currently trading within the "flag" portion of the pattern. A breakout from this consolidation is the key trigger for the next potential move.
Broad-Based Bullish Indicators 👍
The underlying trend remains strong, supported by a host of positive technical signals:
- Multi-Timeframe Strength: Short-term Exponential Moving Averages (EMAs) are in a bullish state across the monthly, weekly, and daily charts .
- Confirmed Momentum: The Relative Strength Index (RSI) also confirms a bullish state on the monthly and weekly timeframes. While the daily RSI has not yet completed a bullish crossover, it is positioned to do so.
- Volume Buildup: A noticeable increase in trading volume during recent sessions suggests accumulation is taking place within the pattern.
Hurdles and Key Levels
For the uptrend to continue, the stock must first break out above the upper trendline of the flag pattern . Immediately following a potential breakout, it will face another significant hurdle in the form of a long-term horizontal resistance trendline .
- Bullish Case 📈: If the stock successfully breaks out of the flag pattern and sustains its momentum, the next potential price target is the resistance zone near ₹620 .
- Bearish Case 📉: If the pattern fails and momentum is not sustained, the stock could pull back to find support near the ₹420 level. The price action in the coming days will be critical.
KIOCL
BUY TODAY SELL TOMORROW for 5%DON’T HAVE TIME TO MANAGE YOUR TRADES?
- Take BTST trades at 3:25 pm every day
- Try to exit by taking 4-7% profit of each trade
- SL can also be maintained as closing below the low of the breakout candle
Now, why do I prefer BTST over swing trades? The primary reason is that I have observed that 90% of the stocks give most of the movement in just 1-2 days and the rest of the time they either consolidate or fall
Trendline Breakout in KIOCL
BUY TODAY SELL TOMORROW for 5%

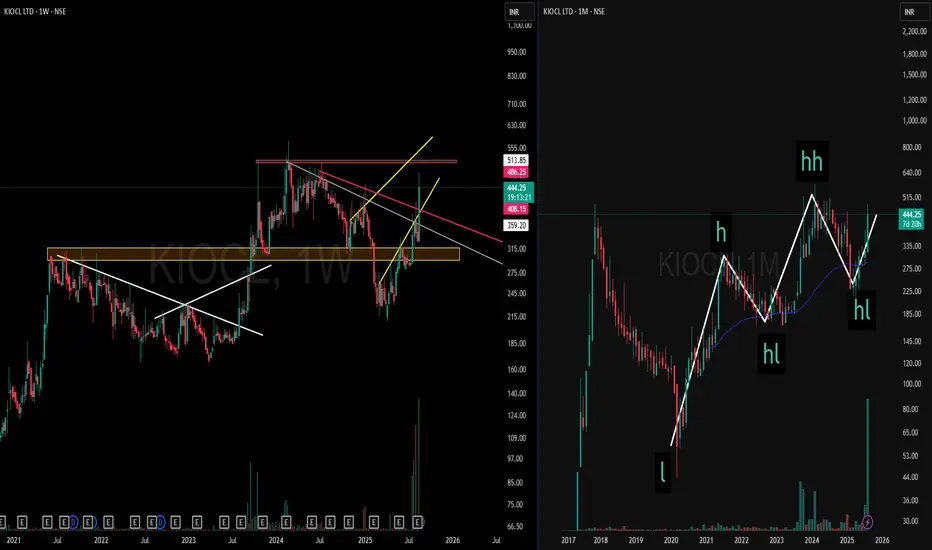
Multi-Timeframe Strength | KIOCL> On the Weekly Timeframe (left), price has gone through extended consolidation phases with counter-trendline breaks and zones of supply transitioning into demand.
> On the Monthly Timeframe (right), the broader structure highlights Higher Highs and Higher Lows, providing a clear larger-picture context.
> Key Takeaway:
Multi-timeframe alignment showcases structural clarity — from consolidation and shifts on the weekly to trend progression on the monthly.
How I Identify High‑Probability Setups Using Weekly + Daily TFI daily make educational content videos for Posts for Swing Trading
📌 This post is for educational purposes only and is not financial or investment advice

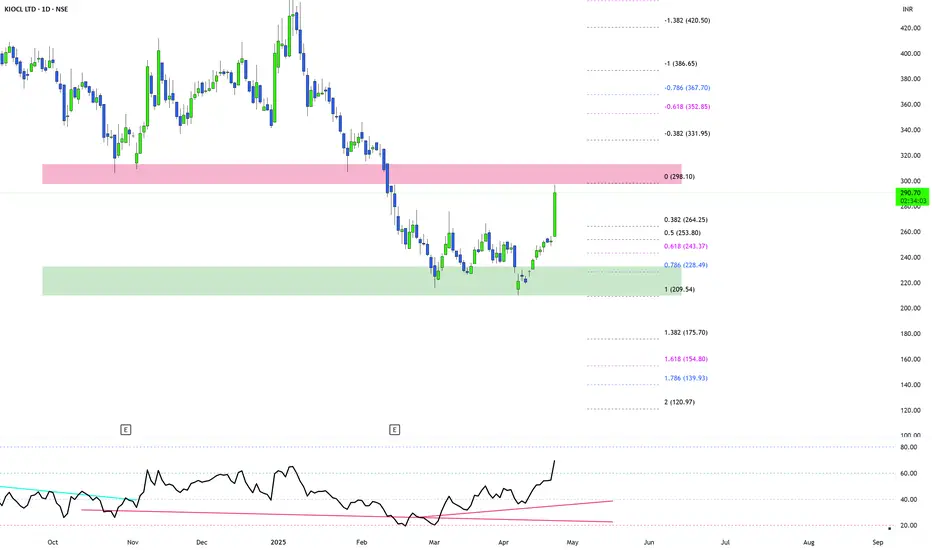
KIOCL (Breakout soon)KIOCL is in accumulation and today up with impressive gains of 15%.
Volumes are crazy and stock is moving with good momentum. A retracement is on cards near 265-260 zone. You can enter near these zones to gain 350-380.
NOTE: I'm not a SEBI REG. Study before investing or consult your financial advisors.
KIOCL Lokking Good For Reversal NSE:KIOCL today gave a big up move in the downtrend with Volumes.
Trade Setup: It's Looking to make a Golden Crossover in a Few Days with the kind of move shown today after a big downtrend and now reversal can be Activated if it Crosses Decisively above 200 DSMA and R1 until S1 and 50 DSMA is Respected it Looks good.
NSE:KIOCL is a flagship company under the Ministry of Steel, GOI, with Miniratna status. It is an export-oriented unit with expertise in iron ore mining, filtration technology, and the production of high-quality pellets.
📌Thank you for exploring my idea! I hope you found it valuable.
🙏FLLOW for more
👍BOOST if useful
✍️COMMENT Below your views.
Meanwhile, check out my other stock ideas below until this trade is activated. I would love your feedback.
Disclaimer: This analysis is intended solely for informational and educational purposes and should not be interpreted as financial advice. It is advisable to consult a qualified financial advisor or conduct thorough research before making investment decisions.

Trade-63/100-KIOCL-R:R Experiment-BuyBuying KIOCL in DAILY positional trade
Good structure making HH-HL.

KIOCL: 2 Year Cup CompleteKIOCL is trying to breakout of the 2.5 years huge cup. Hitting 20% circuit today it broke out but it is important to sustain the breakout keep going higher. Volume and RSI are high.

KIOCL Ltd Analysis Stock has given strong BO on daily and monthly chart with massive volume, follow chart for proper support and resistance levels.

KIOCL LTD - 90% RETURNS!!!BUY - KIOCL LTD
CMP - Rs. 191
Target - 1: Rs. 285
Target - 2: Rs. 365
.
.
Technicals - Bullish Flag Pattern
.
NOTE: Target - 1 will be achieved within 1 year, while Target - 2 will be achieved within 2.5 years.
.
This is just a view by an expert analyst, please invest at your own risk.
.
Follow me for more!

KIOCL - Metals - Lapuk LoOne of the most fantastic metal catalyst shares which has a monopoly. Also 99% shares are not available to public.
This pattern is my favorite broadening bottom pattern.
We should see 500 levels very very soon.
There is nothing but good things I have to say about this company.
This is just a chart pattern discussion. Please trade your hard-earned money on advice of a registered stock market expert. I am a newbie trader :)

KIOCL DAILY CHART ANALYSIS AS ON 26.12.2021KIOCL as per daily chart analysis stock above 282 level for a target 292 level and resistance is at 280 level and 308 level. Nifty monthly chart forming indecisive doji , weekly chart forming bullish candle and daily chart forming a bearish candle shows this week may continue to be bearish being year end and monthly expiry in next 5 sessions.Investors may continue to book profits.Avoid fresh long positions. Nifty Support is placed at 16890 / 16837 / 16785 / 16693. Resistance is placed at 17152 / 17214 / 17378.

[SHORT TERM] BUY KIOCLThe stock is looking good to buy for 8-15% profit.
To motivate me, Please like the idea If you agree with the analysis.
Happy Trading!
InvestPro India Team

KIOCL Bull FlagExpected target of 40% from here. Bull flag pattern can be seen.
Note: This is not a trade recommendation. Traders must do their own research before trading.

KIOCL Trend line BreakoutPositional Trade: #KIOCL Trend line Breakout
CMP: 274.30
Target: 300
Stop Loss: 258

