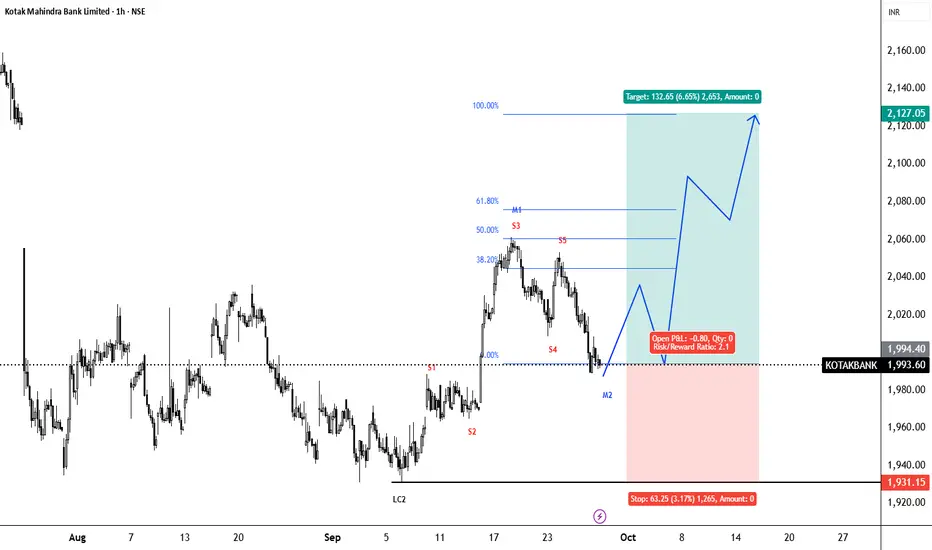
KOTAKBANK -Long - 2 Hour chartKotak Bank Analysis (2H Chart)
Trend: Price is still in an overall uptrend and has taken support exactly on the rising trendline. The recent fall looks like a normal pullback inside a falling wedge.
Volumes: Volumes were low during the fall, which shows sellers were weak. The latest green candle has slightly higher volume, showing buyers are coming back.
Divergence: RSI has formed a bullish divergence. Price made lower lows but RSI made higher lows. This signals a possible trend reversal on the upside.
RSI: RSI is near 58, which is a healthy zone. Momentum is improving and there is room for the price to move higher.
ADX: ADX is around 38, which means the stock is still in a trending phase. If the price breaks out from the wedge, the trend may continue.
Overall View: The chart is showing early signs of a bullish move from trendline support with divergence and improving momentum.
Kotakmahindrabank

Kotak Mahindra Bank (Neowave Trading Idea)Namaskaram
Cycle - consolidated 5th up swing on Long Term Chart (Black Labelling).
Medium Cycle (Blue Labelling) giving an correction, which most likely completed.
Currently retraced 61 percent.
LTP = 2079.7
stoploss = 1,986
About Target- Well target should be above 2302.
But this price should reach before January. So if you see price is rising but not giving enough speed than exit where you get a good price.
I will also make a video on this one today and upload it here.
Thank You.

Kotak Mahindra Bank (Neowave Forecast)NSE:KOTAKBANK
Namaskaram
Cycle - consolidated 5th up swing on Long Term Chart (Black Labelling).
Medium Cycle (Blue Labelling) giving an correction, which most likely completed.
Currently retraced 61 percent.
LTP = 2079.7
stoploss = 1,986
About Target- Well target should be above 2302.
But this price should reach before January. So if you see price is rising but not giving enough speed than exit where you get a good price.
Thank You.

Kotak buying scenario........Kotak Mahindra Bank is forming a wonderful scenario in buying side. It is ranging between trend lines for long time and now taking a reversal after a pullback. Below conditions are reflecting the situation of smart money to jump in…….
1. After pullback it is respecting cluster of 50/100 and 200 SMA and formed a rejection candle.
2. There is a daily FVG nested in OB, which is also being respected.
3. RSI is also at mid-level and showing a reversal..
4. We may see some choppy kind of situation for few days and later breakout.
Note – if you liked this analysis, please boost the idea so that other can also get benefit of it.
Also follow me for notification for incoming ideas.
Also Feel free to comment if you have any input to share.
Disclaimer – This analysis is just for education purpose not any trading suggestion. Please take the trade at your own risk and with the discussion with your financial advisor.

SBIN 1D Time frameCurrent Price (approx): ₹864
52-Week Low: ₹680
52-Week High: ₹880.50
Daily Chart Explanation
On the 1-day timeframe, SBIN is moving near its upper range, close to the recent high. This means the stock is strong but also facing heavy resistance.
Trend: Uptrend overall (higher highs and higher lows).
Momentum: Price is consolidating near resistance, showing hesitation.
Candles: Recent candles show wicks near the top, which means sellers are active near ₹880.

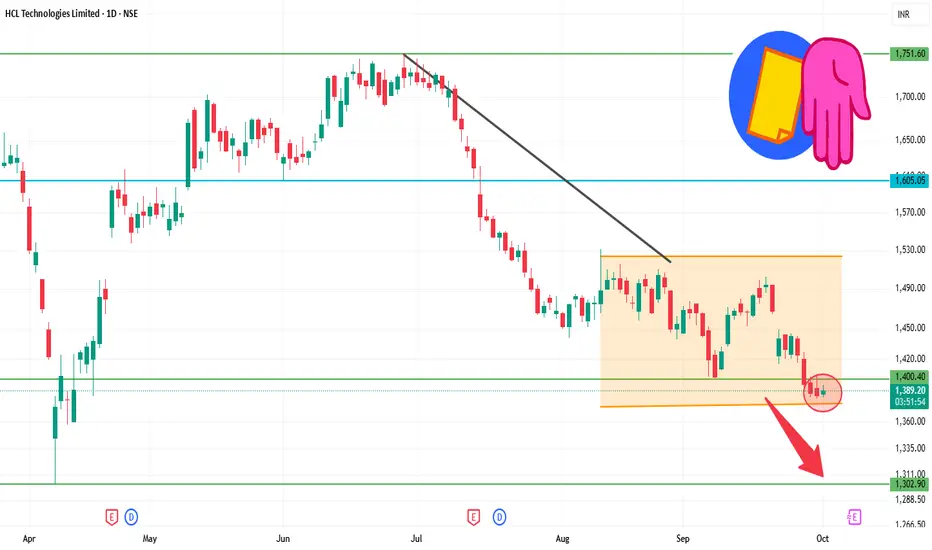
HCLTECH 1D Time frameOpening Price: ₹1,387.40
Closing Price: ₹1,387.40
Day Range: ₹1,383.10 – ₹1,395.00
Previous Close: ₹1,387.40
📉 Trend Analysis
Short-Term Trend: Bearish — The stock is trading below key moving averages, confirming the bearish trend.
Medium-Term Trend: Neutral — The stock is in a consolidation phase, characterized by lower highs and lower lows.
Long-Term Trend: Neutral — No significant trend identified; the stock is trading within a range.
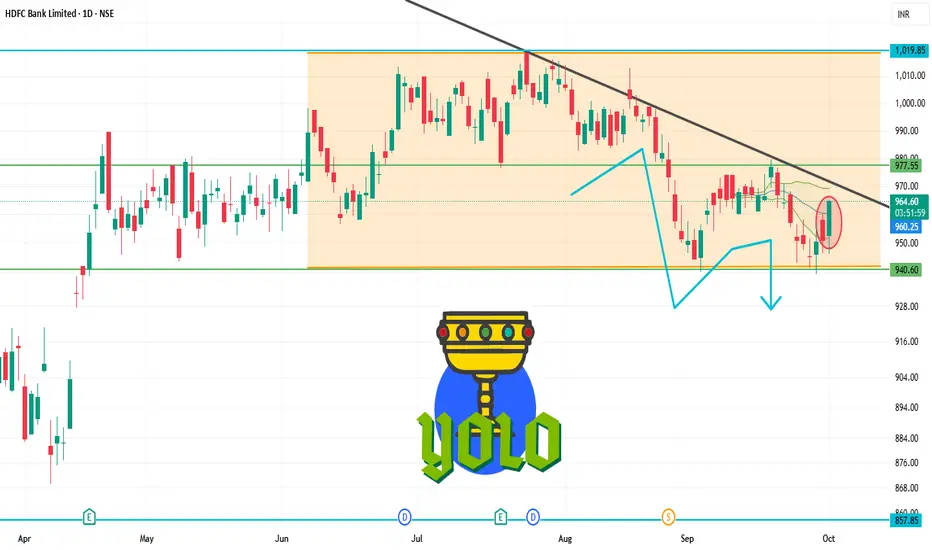
HDFCBANK 1D Time frameOpening Price: ₹950.30
Closing Price: ₹960.45
Day Range: ₹946.00 – ₹961.40
Previous Close: ₹950.30
🧠 Price Action Insights
The stock is trading below key moving averages, confirming the bearish trend.
No significant reversal pattern has formed, suggesting the downtrend may continue.
Watch for a breakout above ₹970.00 for a potential trend reversal.
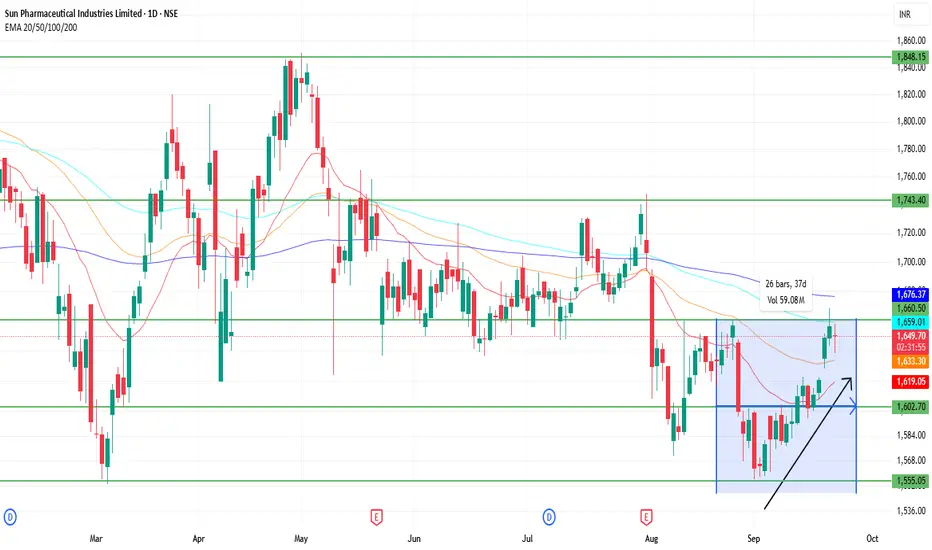
SUNPHARMA 1D Time frameOpening Price: ₹1,611.90
Closing Price: ₹1,628.20
Day Range: ₹1,611.90 – ₹1,651.50
Previous Close: ₹1,594.30
📉 Trend Analysis
Short-Term Trend: Bearish — The stock is trading below key moving averages, confirming the bearish trend.
Medium-Term Trend: Neutral — The stock is in a consolidation phase, characterized by lower highs and lower lows.
Long-Term Trend: Neutral — No significant trend identified; the stock is trading within a range.
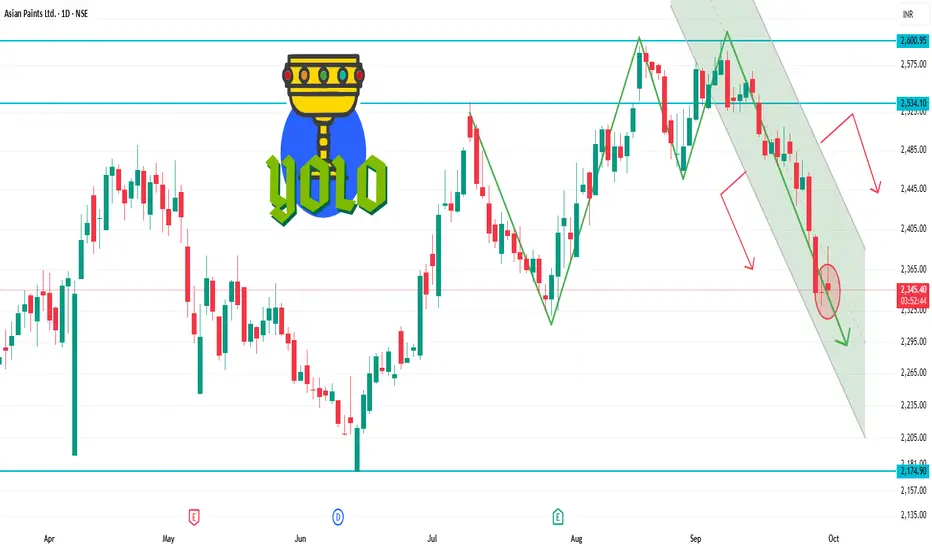
ASIANPAINT 1D Time frameCurrent Price Snapshot
Current Price: ₹2,345.50
Day’s Range: ₹2,342.00 – ₹2,388.80
52-Week Range: ₹2,124.75 – ₹3,358.00
Technical Indicators
RSI (14-day): 44.19 — indicates a neutral to slightly bearish momentum.
MACD: -4.010 — suggests bearish momentum.
Moving Averages:
5-day: ₹2,396.00 — indicates a Sell signal.
50-day: ₹2,389.00 — indicates a Sell signal.
200-day: ₹2,350.00 — indicates a Neutral signal.
Technical Summary: Predominantly Sell signals across various indicators.
Summary
Above ₹2,388.80: Potential rise toward ₹2,400 – ₹2,420.
Below ₹2,342.00: Potential fall toward ₹2,320 – ₹2,300.
Between ₹2,300 – ₹2,380: Likely range-bound movement.
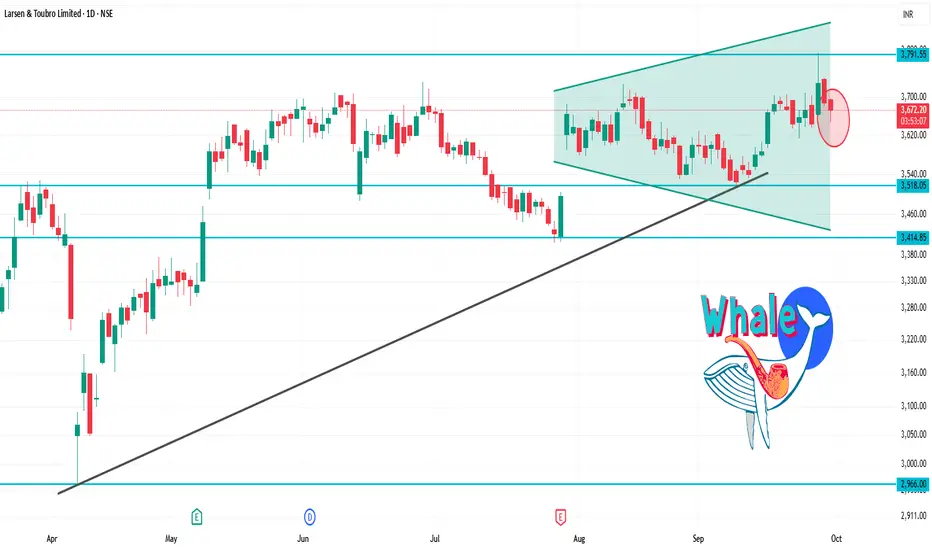
LT 1D Time frameCurrent Price: ₹3,655.30
Day’s Range: ₹3,648.00 – ₹3,696.60
52-Week Range: ₹2,965.30 – ₹3,963.50
Technical Indicators
RSI (14-day): 41.19 — indicates a neutral to slightly bearish momentum.
MACD: -1.47 — suggests bearish momentum.
Moving Averages: Mixed signals — short-term averages are bearish, while long-term averages are bullish.
Technical Summary: Predominantly Sell signals across various indicators.
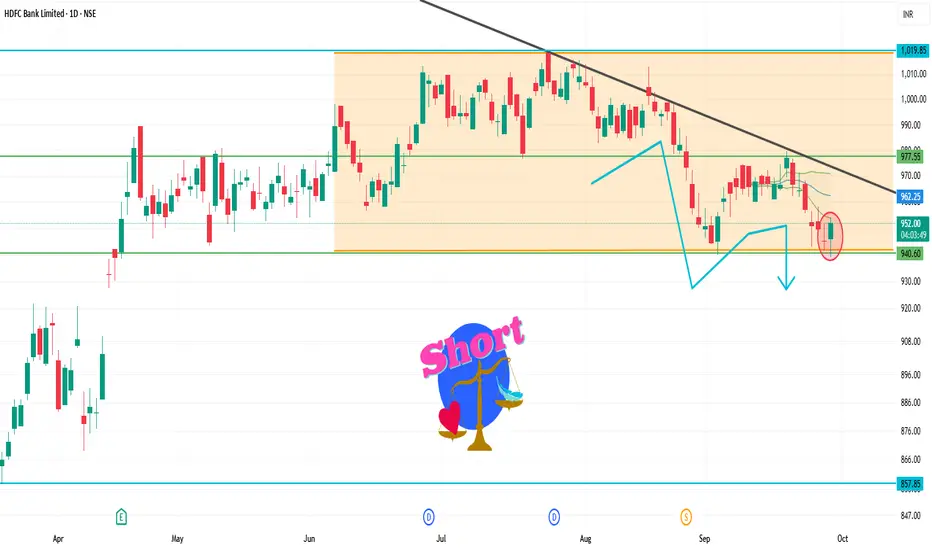
HDFCBANK 1D Time frameCurrent Market Snapshot
Current Price: ₹954.05
Opening Price: ₹945.10
Day's Range: ₹939.10 – ₹953.00
Previous Close: ₹945.05
🔑 Technical Indicators
Relative Strength Index (RSI): 35.08 – indicating a neutral to bearish condition.
Moving Average Convergence Divergence (MACD): -6.02 – suggesting bearish momentum.
Moving Averages: Trading below the 50-day and 200-day moving averages, indicating a bearish trend.
📈 Key Support & Resistance Levels
Immediate Support: ₹939
Immediate Resistance: ₹953
Pivot Point: ₹946
📉 Market Sentiment
Trend: The stock is trading below its 50-day and 200-day moving averages, indicating a bearish trend.
Volume: Trading volume is higher than average, suggesting increased investor activity.
📈 Strategy (1D Timeframe)
1. Bullish Scenario
Entry: Above ₹953
Stop-Loss: ₹939
Target: ₹960 → ₹965
2. Bearish Scenario
Entry: Below ₹939
Stop-Loss: ₹953
Target: ₹930 → ₹925
⚠️ Risk Management
Limit risk to 1% of capital per trade.
Always use stop-loss to protect against unexpected market movements.
Monitor broader market trends and sector-specific news that may impact stock performance.
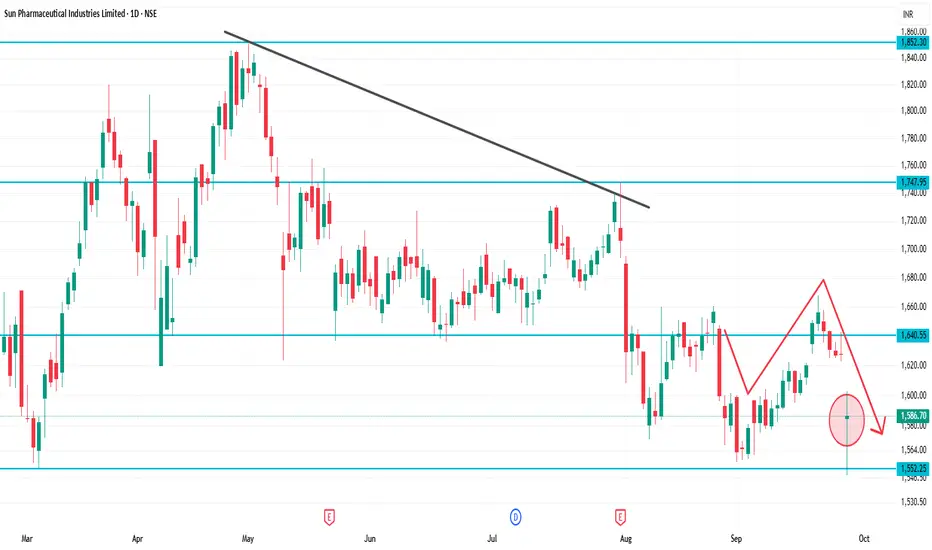
SUNPHARMA 1D Time frameCurrent Price: ~₹1,586
Day Range: ~₹1,582 – ₹1,600
52-Week High: ~₹1,960
52-Week Low: ~₹1,553
📈 Technical Outlook
Immediate Support: ₹1,580 (very close to current price)
Strong Support: ₹1,553 – ₹1,560 (52-week low zone)
Immediate Resistance: ₹1,600 – ₹1,620
Major Resistance: ₹1,650 – ₹1,670
Trend Bias:
Stock is weak, testing lower supports.
If it breaks below ₹1,580, then ₹1,553 may be tested.
A bounce is only possible if it sustains above ₹1,600.
📌 Step-by-Step Market View
Above 1,600: Chance for small recovery toward ₹1,620 – ₹1,650.
Stays between 1,580 – 1,600: Consolidation zone.
Breaks below 1,580: Weakness may extend to ₹1,553.
Kotak Mahindra Bank Neowave Trading IdeaNamaskaram Everyone
I trade using Neowave and on that I have created an trading setup, which is kind of automatic entry and exit with Neowave.
Neowave is kind of a method in which you synchronize all the price action across all the time frames. It hides all the noise and tells you market is bullish or bearish.
About Stock Structure
Entry Type- Medium Term Forecast mean Entry will take 4 to 8 weeks and some times more.
Wave Structure- We are at starting point of wave, which kind of gives you an edge in riding the wave when you above your buying level
60 percent Retracement- Mean you will have easily 1:2 or 3 easy risk reward.
Doubts-If you are fearing in taking trades that mean you are taking stop loss amount more than you & your capital can handle.
Follow 1 percent rule and trail, that's it. Don't complicate life and trading.
Simply live and die. HaHA
Like and share is appreciated.
Thank You
To understand how our coding works read the below post-
NSE:KOTAKBANK NSE:KOTAKBANK1!
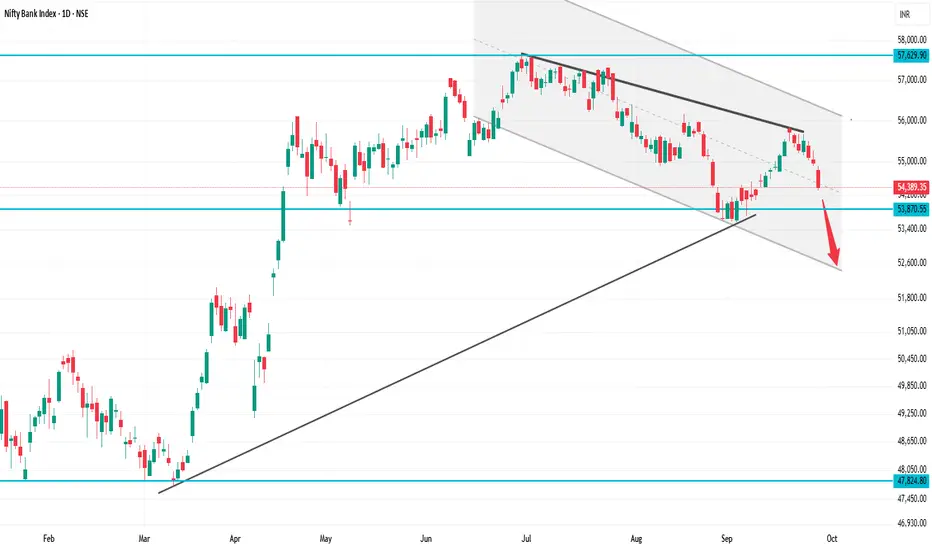
BANKNIFTY 1D Time frame
Previous Close: 55,121
Today Open: 55,061
Day’s High: 55,276
Day’s Low / Last: 54,389
⚡ Strategy
For Intraday / Short-Term Traders:
If BankNIFTY holds above 54,400 – 54,500, a small bounce toward 54,800 – 55,000 is possible.
If it fails to hold 54,400, expect more downside toward 54,000 – 53,800.
Bullish View (Only if recovery): Buy above 54,800 for targets 55,100 – 55,250, SL below 54,500.
Bearish View (Preferred): Sell on rise near 54,700 – 54,900 with SL above 55,000, targets 54,300 → 54,000.
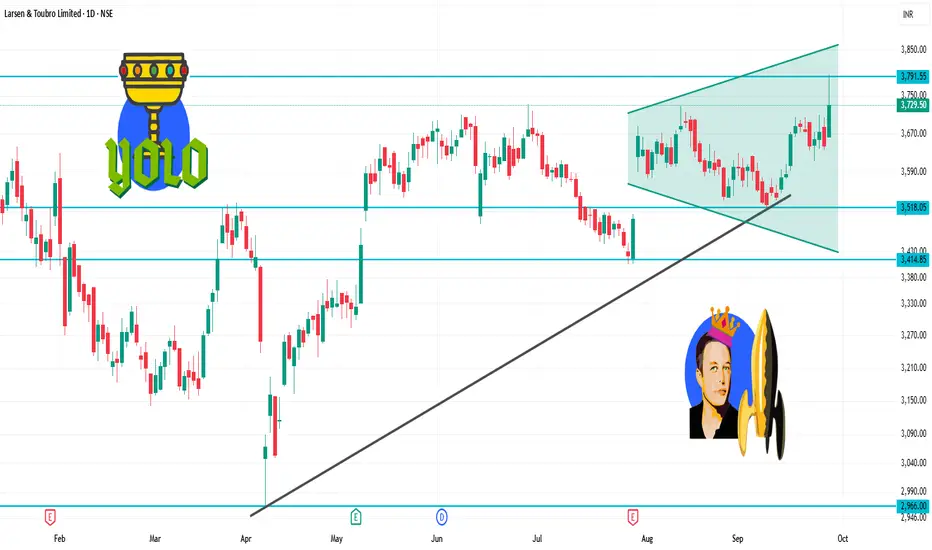
LT 1D Time framePrevious Close: ₹ 3,644
Today Open: ₹ 3,664
Day’s High: ₹ 3,795
Day’s Low: ₹ 3,661
Current / Last Traded Price: around ₹ 3,730
⚡ Strategy
Bullish Side:
Buy on dips near ₹ 3,700 – 3,720 with stop loss below ₹ 3,660. Target ₹ 3,760 → ₹ 3,795.
Bearish Side (Only if Weakness):
If price falls below ₹ 3,660, short opportunities may open toward ₹ 3,600.
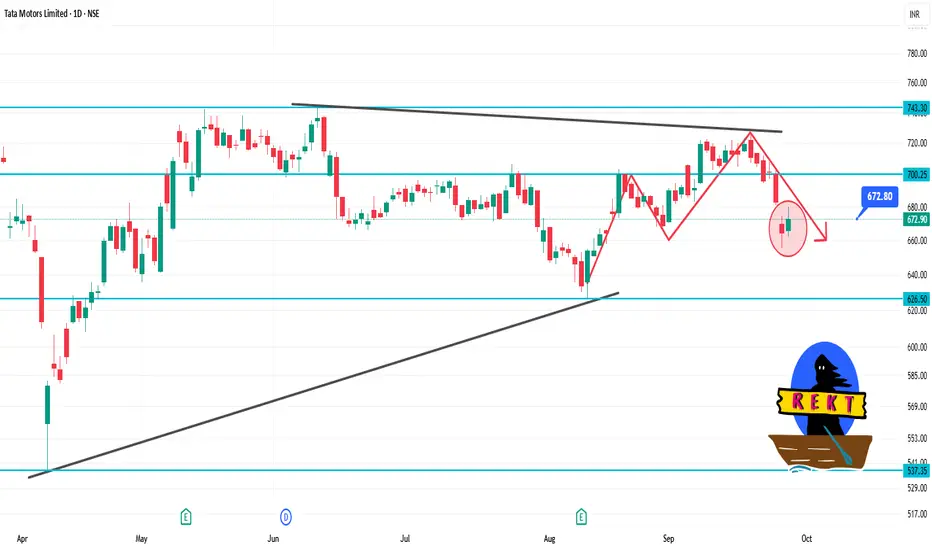
TATAMOTORS 1D Time frameCurrent Price: ₹673.00
Day's Range: ₹662.35 – ₹680.35
Previous Close: ₹664.30
Volume: 15,780,434 shares traded
Market Cap: ₹247,780 crore
52-Week High: ₹1,000.40
52-Week Low: ₹535.75
Face Value: ₹2.00
Beta: 1.30
🧾 Financial Highlights
P/E Ratio (TTM): 11.69
P/B Ratio: 0.00
EPS (TTM): ₹57.54
Dividend Yield: 0.89%
ROE: 28.1%
Book Value: ₹315
📈 Technical Insights
Trend: The stock has shown resilience with strong long-term performance over three years, despite recent challenges compared to the Sensex.
Support Levels: ₹662.35, ₹650.00
Resistance Levels: ₹680.35, ₹700.00
📌 Key Takeaways
Recent Performance: Tata Motors' shares rose over 2% today, snapping a two-day decline, following the announcement that Jaguar Land Rover (JLR) had commenced a phased restart of its operations after a cyberattack.
Analyst Sentiment: Despite recent volatility, Tata Motors remains a top pick among analysts for long-term investment.
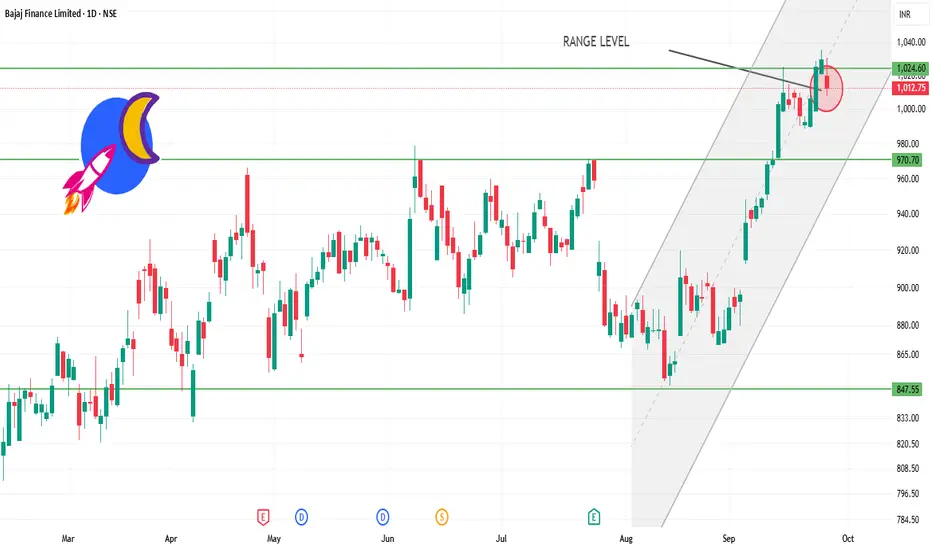
BAJFINANCE 1D time frame📊 Daily Snapshot
Closing Price: ₹1,012.75
Day’s Range: ₹1,008.00 – ₹1,031.10
Previous Close: ₹1,029.75
Change: Down –1.66%
52‑Week Range: ₹645.10 – ₹1,036.00
Market Cap: ₹6.31 lakh crore
P/E Ratio: 36.2
Dividend Yield: 2.76%
EPS (TTM): ₹28.04
Beta: 1.14 (indicating moderate volatility)
🔑 Key Technical Levels
Support Zone: ₹1,008.00 – ₹1,015.00
Resistance Zone: ₹1,031.00 – ₹1,036.00
All-Time High: ₹1,036.00
📈 Technical Indicators
RSI (14-day): 42.88 – approaching oversold territory, suggesting potential for a rebound.
MACD: Positive at 2.46, indicating bullish momentum.
Moving Averages: Trading above the 50-day and 200-day moving averages, indicating an overall uptrend.
📉 Market Sentiment
Recent Performance: Bajaj Finance experienced a decline of 1.66% on September 25, 2025, underperforming the broader market.
Volume: Trading volume was significantly higher than its 50-day average, indicating increased investor activity.
📈 Strategy (1D Timeframe)
1. Bullish Scenario
Entry: Above ₹1,031.00
Stop-Loss: ₹1,008.00
Target: ₹1,045.00 → ₹1,050.00
2. Bearish Scenario
Entry: Below ₹1,008.00
Stop-Loss: ₹1,015.00
Target: ₹995.00 → ₹990.00
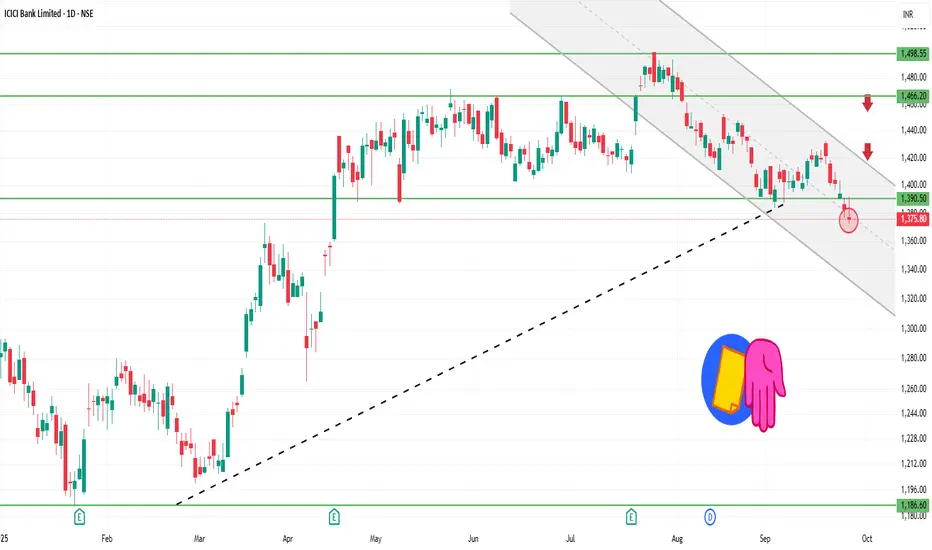
ICICIBANK 1D Time frame📊 Daily Snapshot
Closing Price: ₹1,375.50
Day’s Range: ₹1,371.80 – ₹1,391.50
Previous Close: ₹1,382.70
Change: Down –0.52%
52-Week Range: ₹1,018.85 – ₹1,494.10
Market Cap: ₹9.7 lakh crore
P/E Ratio: 20.5
Dividend Yield: 1.2%
EPS (TTM): ₹67.00
Beta: 1.05 (moderate volatility)
🔑 Key Technical Levels
Support Zone: ₹1,370 – ₹1,375
Resistance Zone: ₹1,390 – ₹1,400
All-Time High: ₹1,494.10
📈 Technical Indicators
RSI (14-day): 34.1 – approaching oversold territory, suggesting potential for a rebound.
MACD: Negative, indicating bearish momentum.
Moving Averages: Trading below the 150-day moving average, indicating a bearish trend.
Candlestick Patterns: Recent formation of a Bearish Engulfing pattern, suggesting potential for further downside.
📉 Market Sentiment
Recent Performance: ICICI Bank has experienced a decline for the fifth consecutive session, underperforming the broader market.
Sector Performance: The NIFTY BANK index also closed lower, reflecting sector-wide weakness.
📈 Strategy (1D Timeframe)
1. Bullish Scenario
Entry: Above ₹1,390
Stop-Loss: ₹1,370
Target: ₹1,405 → ₹1,420
2. Bearish Scenario
Entry: Below ₹1,370
Stop-Loss: ₹1,390
Target: ₹1,355 → ₹1,340
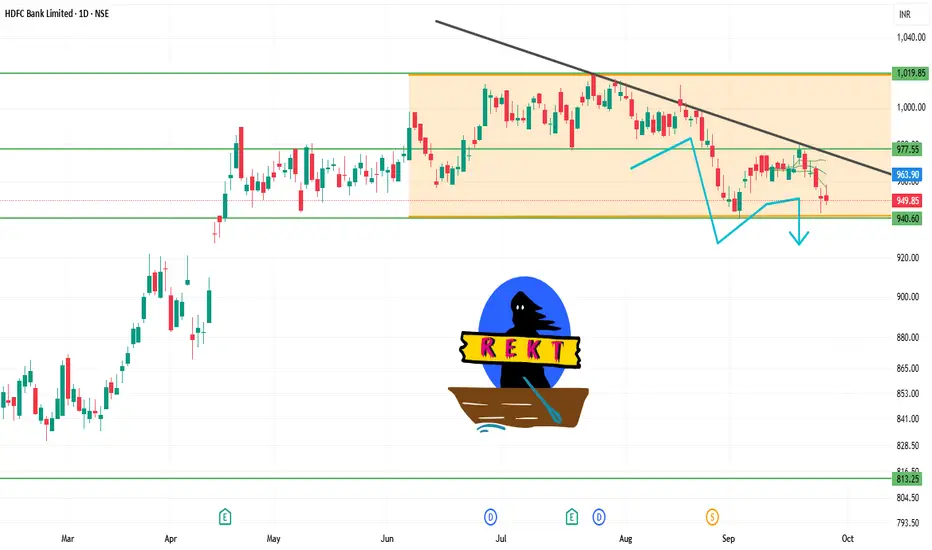
HDFCBANK 1D Time frame📊 Daily Snapshot
Closing Price: ₹949.20
Day’s Range: ₹947.40 – ₹958.00
Previous Close: ₹957.20
Change: Down –0.52%
52-Week Range: ₹806.50 – ₹1,018.85
Market Cap: ₹14.6 lakh crore
P/E Ratio: 20.66
Dividend Yield: 2.32%
EPS (TTM): ₹45.97
Beta: 0.92 (indicating lower volatility)
🔑 Key Technical Levels
Support Zone: ₹947.40 – ₹950.00
Resistance Zone: ₹957.20 – ₹960.00
All-Time High: ₹1,018.85
📈 Strategy (1D Timeframe)
1. Bullish Scenario
Entry: Above ₹957.20
Stop-Loss: ₹947.40
Target: ₹965.00 → ₹970.00
2. Bearish Scenario
Entry: Below ₹947.40
Stop-Loss: ₹957.20
Target: ₹940.00 → ₹935.00
MARUTI 1D Time frame📊 Daily Snapshot
Closing Price: ₹16,240
Day’s Range: ₹16,063 – ₹16,375
52‑Week Range: ₹10,725 – ₹16,375
Market Cap: ₹5.1 lakh crore
P/E Ratio: 35.1
Dividend Yield: 0.83%
EPS (TTM): ₹463.5
Beta: 0.88 (lower volatility)
🔑 Key Levels
Support Zone: ₹16,100 – ₹16,150
Resistance Zone: ₹16,300 – ₹16,375
All-Time High: ₹16,375
📈 Strategy (1D Timeframe)
1. Bullish Scenario
Entry: Above ₹16,300
Stop-Loss: ₹16,150
Target: ₹16,500 → ₹16,600
2. Bearish Scenario
Entry: Below ₹16,100
Stop-Loss: ₹16,150
Target: ₹15,900 → ₹15,800

ADANIENT 1D Time frame📍 Today’s Expected Range (Intraday Approximation)
Expected High: ₹2,686–₹2,700
Expected Low: ₹2,640–₹2,650
These levels are approximate intraday zones. Volatility may cause small deviations.
🔍 Key Points
Current price: ₹2,675, right between support and resistance.
If the price breaks above ₹2,700 with strong buying → bullish momentum likely.
If the price falls below ₹2,640 → potential pullback or short-term correction.
📊 Trading Strategy for Today
Bullish Scenario:
If price breaks ₹2,680–₹2,700, you can buy, targeting ₹2,720–₹2,750.
Stop-loss: Below ₹2,665
Bearish Scenario:
If price falls below ₹2,640, you can sell/short, targeting ₹2,620–₹2,600.
Stop-loss: Above ₹2,655
Range-Bound / Sideways:
If price stays between ₹2,640–₹2,680, it’s better to wait and avoid trading until a clear breakout happens.
💡 Summary:
Resistance zone: ₹2,680–₹2,700
Support zone: ₹2,640–₹2,650
Strategy: Trade in the direction of the breakout and always use stop-loss.

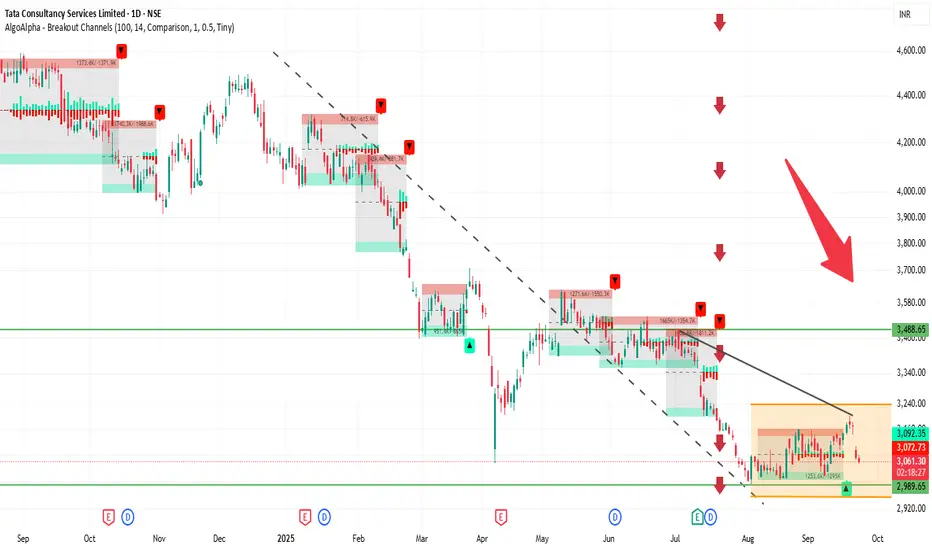
TCS 1D Time frame📍 Current Price & Range
Current price: ₹3,063.80
Day’s High / Low: ₹3,106.90 / ₹3,052.00
52-week High / Low: ₹4,494.90 / ₹2,991.60
🔍 Key Levels
Immediate resistance: ₹3,100–₹3,110
Next resistance: ₹3,200–₹3,250
Immediate support: ₹3,050–₹3,060
Psychological / strong support: ₹3,000
📊 Indicators & Momentum
Price is just below near-term resistance, showing hesitation.
Short-term trend is neutral to slightly bearish; momentum is weak.
RSI and MACD suggest neutral to weak momentum, no strong reversal yet.
Stock is trading well below its 52-week high, indicating it has already corrected significantly.
🔮 Possible Scenarios
Bullish breakout → Sustaining above ₹3,110 could push price toward ₹3,200–₹3,250.
Sideways / consolidation → Likely to trade between ₹3,050–₹3,110 if no strong catalyst.
Bearish pullback → Breaking below ₹3,050 may take price toward ₹3,000, and further down to ₹2,950–₹2,900 if weakness continues.
👉 Outlook: At the current level (₹3,073.80), TCS is in a neutral zone. The next directional move depends on either a breakout above resistance or a fall below support.
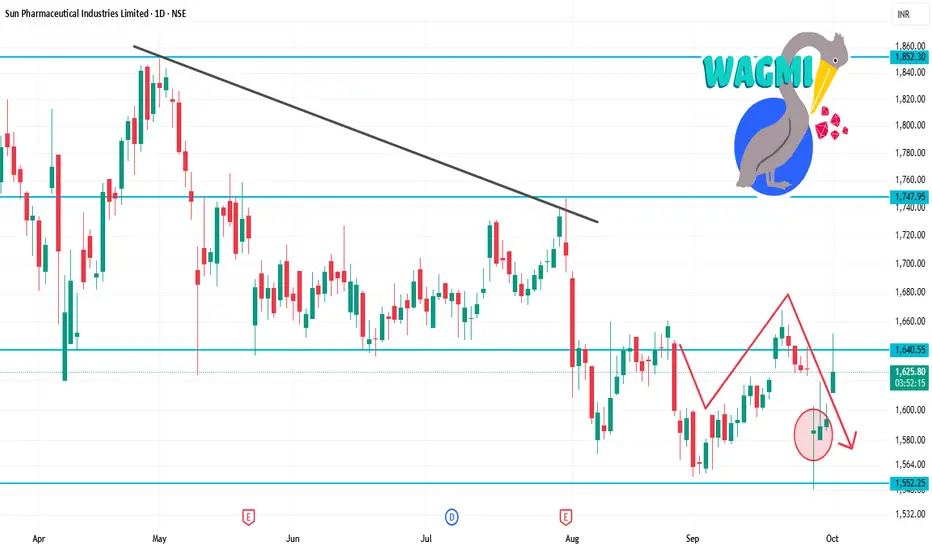
SUNPHARMA 1D Time frame🔍 Current Price
Approximately ₹1,646 – ₹1,650
🧮 Strategy / Trade Ideas
Long Setup:
If price holds above ₹1,630 – ₹1,620 and shows reversal signals (bullish candle etc.), opportunity to go long.
Target zones: first towards ₹1,655 – ₹1,660, then potentially ₹1,675 – ₹1,680.
Stop-loss could be just below support around ₹1,620 to manage risk.
Short / Pullback Setup:
If price faces resistance near ₹1,655 – ₹1,660 and fails to break with conviction.
Potential downside toward ₹1,630 first, then ₹1,600 if that support doesn’t hold.
Breakout Setup:
If price clears and sustains above ₹1,675 – ₹1,680, especially closing above ₹1,745 – ₹1,755, there may be scope for further upside.
✅ Summary
Sun Pharma on the daily chart is moderately bullish. Key for continuation is holding above support in lower ₹1,600-₹1,630 zone, and overcoming resistance around ₹1,655-₹1,660. A breakout above ₹1,675-₹1,680 would strengthen bullish case; failure to hold support could lead to downside.