Break of trendline1.RSI and stock are moving in same trend
2.break of trendline
3.kpittech is in all time high
good stock for btst trade
KPITTECH
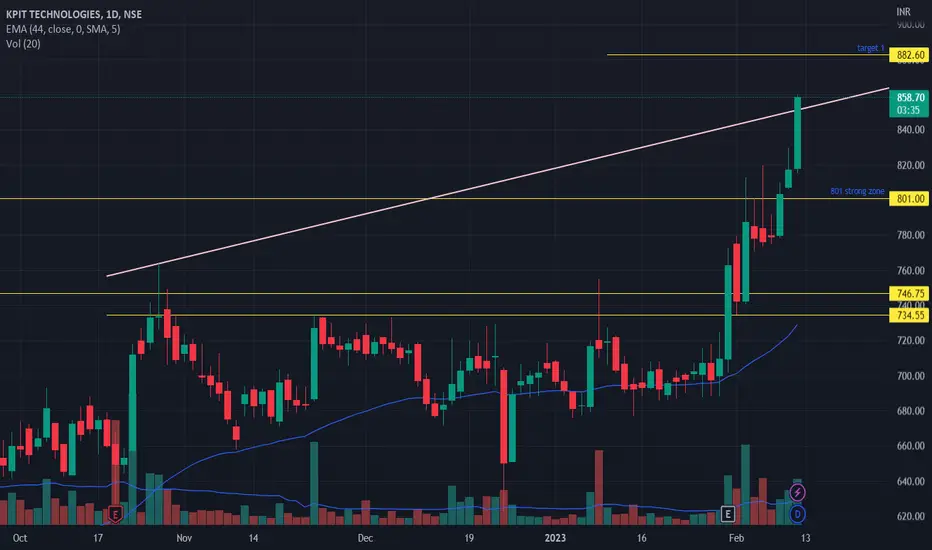
KPITTECH - All Time High Breakout - Swing TradeThose who study charts on regular basis, would be familiar that when a stock price breaks its ATH level on a higher Time frame, in majority of cases, it goes much above that level. Similar is the setup in this stock which has been in uptrend for quite long and has shown strength even during market correction recently.
The analysis is done on weekly as well as on Daily TF hence price may take few weeks to few months in order to reach the targets.
Trade setup is explained in image itself.
The above analysis is purely for educational purpose. Traders must do their own study & follow risk management before entering into any trade
Checkout my other ideas to understand how one can earn from stock markets with simple trade setups. Feel Free to comment below this or connect with me for any query or suggestion regarding this stock or Price Action Analysis.

Perfect cup and handle patternAfter a long consolidation, the chart has a higher probability of breaking out. This is only an educational chart and is no way a recommendation. Please study and consult your financial advisor.

KPITTECH - Ichimoku Bullish Breakout Stock Name - KPIT Technologies Ltd
Ichimoku Cloud Setup :
1). Today's close is above the Conversion Line
2). Future Kumo is Turning Bullish
3). Chikou span is slanting upwards
All these parameters are showing bullishness at Current Market Price
and more bullishness AFTER crossing 735
#This is not Buy and Sell recommendation to any one. This is for education purpose and a helping hand to learn trading in Market.
# Cloud Trading
# Ichimoku Cloud
# Ichimoku Followers
I hope you all like my analysis.
Please do share your thoughts into comment section.
Please give a like, it motivates me to do analysis.

KPIT TECHSimple Price Action
Formed a trend line support from June and respecting the levels.
Gave a breakout , took the retest and again broke the weekly candle high with High volumes.
#HappyDiwaliFolks
#HappyTrading

A POTENTIAL UPFLAG PATTERN IN kpit
Only For Educational Purposes,
Invest at your own discretion
KPIT TECH after delivering a staggering quarter with updated Growth Guidance and Highest TCV for all time now looks to deliver in the Charts,
KPIT Closed around 681 a few weeks ago, and has tried to test the same levels a couple of times but has failed to do so clearly.
Now after respecting the FIB levels @647 the stock is looking to form a good base and forming a Potential Upflag pattern which may burst out in upcoming Months,
One can look to add it at the present levels as well with the potential target of Rs 750/- before Q4 23 ends.
Regards


KPIT Technologies... Is it ready to "tech" off?The stock price action in KPIT Technologies look good, given its move from around 450 levels to 569.
Breakout above 590 will add some momentum for it to go till 625 and 650 levels in the short to medium term.
Good support in the range between 540 and 525, below which it has strong support at 455.
Always trade with a stop loss.
Note: Not a buy/sell recommendation. Do consult your financial advisor.

KPITTECHNSE:KPITTECH
One Can Go long with a Strict SL below the Trendline or Swing Low of Daily Candle.
Close should be good, and Clean.
R:R ratio should be 1 :2 .
Disclaimer : You are responsible for your Profits and loss, Shared for Educational purpose

KPITTECH Cup&Handle BO !!NSE:KPITTECH
#NSE:KPITTECH formed beautiful #Cupandhandle and BO,
sustainability above the resistance level may reach to 750 🎯

KPITTECH - Ichimoku Bullish Breakout Stock Name - KPIT Technologies Ltd
Ichimoku Cloud Setup :
1). Today's close is above the Conversion Line
2). Future Kumo is Turning Bullish
3). Chikou span is slanting upwards
All these parameters are showing bullishness at Current Market Price
and more bullishness AFTER crossing 603
#This is not Buy and Sell recommendation to any one. This is for education purpose and a helping hand to learn trading in Market.
# Cloud Trading
# Ichimoku Cloud
# Ichimoku Followers
I hope you all like my analysis.
Please do share your thoughts into comment section.
Please give a like, it motivates me to do analysis.

KPITECH LOOKING GOOD i m nog sebi reg advisor here i share my view before trade take advice from ur advisor
Any profit loss me not responsible

KPITTECH - Ichimoku Bullish Breakout Stock Name - KPITTECH
Ichimoku Cloud Setup :
1). Today's close is above the Conversion Line
2). Future Kumo is Turning Bullish
3). Chikou span is slanting upwards
All these parameters are showing bullishness at Current Market Price
and more bullishness AFTER crossing 580
#This is not Buy and Sell recommendation to any one. This is for education purpose and a helping hand to learn trading in Market.
# Cloud Trading
# Ichimoku Cloud
# Ichimoku Followers
I hope you all like my analysis.
Please do share your thoughts into comment section.
Please give a like, it motivates me to do analysis.

KPIT TECHNOLOGIES_DOWN TREND BREAKOUT?KPIT Technologies down trend breakout, Today will confirm based on daily chart closing above the trend line. If price sustain above 548, It will move new rally towards upward. Refer mentioned upcoming Targets.

Will you Buy it now?Stock witnessed tremendous buying from huge gap down and closed with huge green candle. Volume and RSI in support but closed near Resistance zone. Will you buy now or wait further? Share your answer in comment section.

KPIT Technologies - Break out zone to look for...Currently the price is in a narrow price range. Good buy range between 608 and 623.
Follow strict stop loss of 5-8%, depending on your risk management.
Can also see formation of ascending triangle pattern and breakout above 608.
Targets of 675, 743 and 801 are placed at key support and resistance zone.
Bullish above 801 and can see probable target of 1260 in the long term.
Read my previous analysis here:

Rising Triangle formation in KPITTECHKPITTECH chart is forming a rising triangle after a good retracement.
Rising triangles are theoretically supposed to breakout to the upside and continue the price higher but practically you'll find many examples where it breaks down below the rising trendline.
on the upside, the price is getting rejected on horizontal resistance and forming hammers/spinning tops.
Wait for it to break on either side to take a trade. if it breaks to the upside, one should wait for a retest of the trendline.

KPIT looks goodChart -> KPIT Tech 4 hours
Volatility Contraction Pattern breakout above 608 in KPIT has been given by the stock.
CMP: 623
Target 1: 675
Target 2: 735
Stoploss: 568
Disclaimer: This is for educational purpose only. This is not any recommendations. I am not SEBI registered. Please consult your financial advisor before taking any action.

KPIT Technologies : Price analysisShort term target of 662.
The stock can consolidate in the near term.
However, upward movement above 662, supported by volume, RS and price movement staying above the 21 EMA will help stock stay strong.
Always keep a stop loss of 5-8%.

What's up with KPIT?KPIT has delivered stellar returns to the investors in the past two years. Stock is currently trading at the support level of a Descending triangle pattern. If it closes below the 600 level, it can fall further to 500 levels. However, if it breakout from the pattern, it can reach its previously high levels.
Cheers! This is as per my Analysis. Feel free to share your view about this. Please do your analysis before trading/Investing.
Happy Trading

KPIT - A very short swing idea in EV themeChart is self explanatory. Entry, Targets and Stop Loss are mentioned on the chart.
Disclaimer: This is for demonstration and educational purpose only. This is not buying or selling recommendations. I am not SEBI registered. Please consult your financial advisor before taking any trade.

KPITTECH : Breakout with Strong Relative StrengthKPIT Technologies:
Symmetrical Triangle Breakout
Very Strong Relative Strength
High Trade and Delivery Quantity this Week
Very close to 52 Week High Zone of 435.60
Strong Financials
Target: 850 plus in long term
Note: Not a buy recommendation. For educational purposes only.
Contact your financial advisor before initiating any trade.
Disclaimer: I am not SEBI registered.
