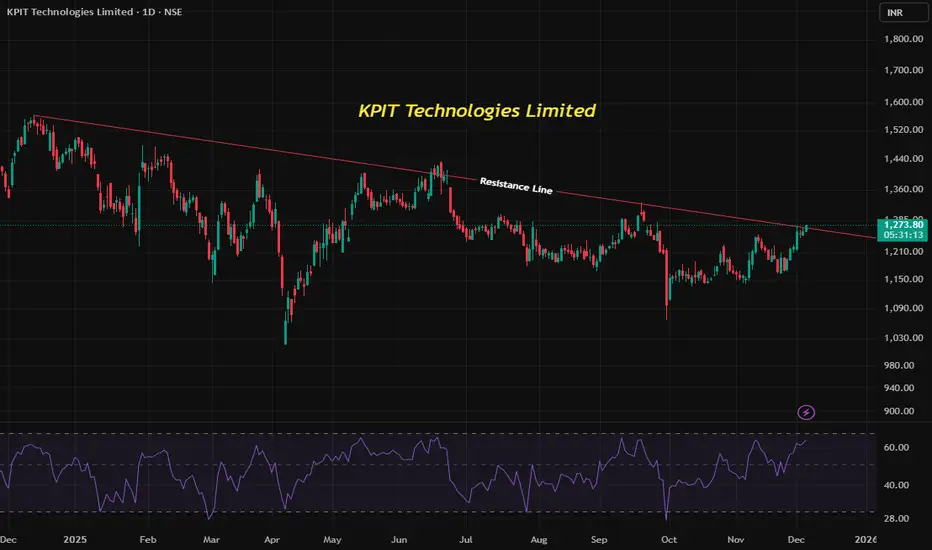
KPIT Technologies Downtrend Reversal with RSI ConfirmationKPIT Technologies Ltd is currently trading near ₹1271 on the daily chart. The stock has been in a downtrend, forming lower highs and lower lows, but is now attempting a trend reversal by breaking out of its downtrend line. Alongside this, the RSI indicator has moved above 50, signaling renewed buying strength. Let’s break down these concepts and understand the current opportunity.
🔹 Understanding the Downtrend Pattern
1. Downtrend Definition: A downtrend is characterized by a sequence of lower highs and lower lows, showing persistent selling pressure.
2. Trendline Role: Traders often draw a descending trendline connecting the highs. As long as price stays below this line, the downtrend remains intact.
3. Reversal Signal: When price breaks above the downtrend line, it suggests that sellers are losing control and buyers may be taking over.
4. KPIT Example: The breakout above its downtrend line indicates a potential shift from bearish to bullish sentiment.
🔹 RSI Indicator as Momentum Confirmation
Relative Strength Index (RSI): A momentum oscillator ranging from 0–100.
Key Levels:
Below 50 → bearish momentum
Above 50 → bullish momentum
Why It Matters: RSI crossing above 50 often confirms that buying activity is strengthening.
KPIT Example: RSI moving above 50 supports the breakout, adding conviction that the trend reversal is genuine.
🔹 Combining Downtrend Breakout with RSI
Dual Confirmation:
1. Breakout of the downtrend line → structural change in price action.
2. RSI above 50 → momentum shift toward buyers.
Why This Combination Works: It reduces false signals. A breakout alone may fail, but when supported by momentum indicators, the probability of success increases.
🔹 Current Trading Opportunity
Setup:
1. Entry: Near current levels (~₹1271), as price has broken the downtrend line.
2. Stop Loss: Below the most recent swing low, ensuring risk is defined if reversal fails.
3. Target: Traders often aim for the next resistance zone or use trailing stops to capture extended moves.
Risk Management:
1. Always define risk before entering.
2. Use the pullback low or recent swing low as a stop loss.
3. Adjust position size to maintain favorable reward-to-risk ratio.
📌 Key Takeaways
1. A downtrend reversal occurs when price breaks above its descending trendline.
2. RSI above 50 confirms momentum is shifting toward buyers.
3. Combining structural breakout with momentum confirmation creates a stronger trading signal.
4. Using the recent swing low as stop loss ensures disciplined risk management.
KPIT Technologies’ current setup is a textbook example of how traders can use trendline breakouts and RSI momentum together to identify potential reversals. It highlights the importance of combining price action with indicators to build a structured trading plan.
Kpittechnologies
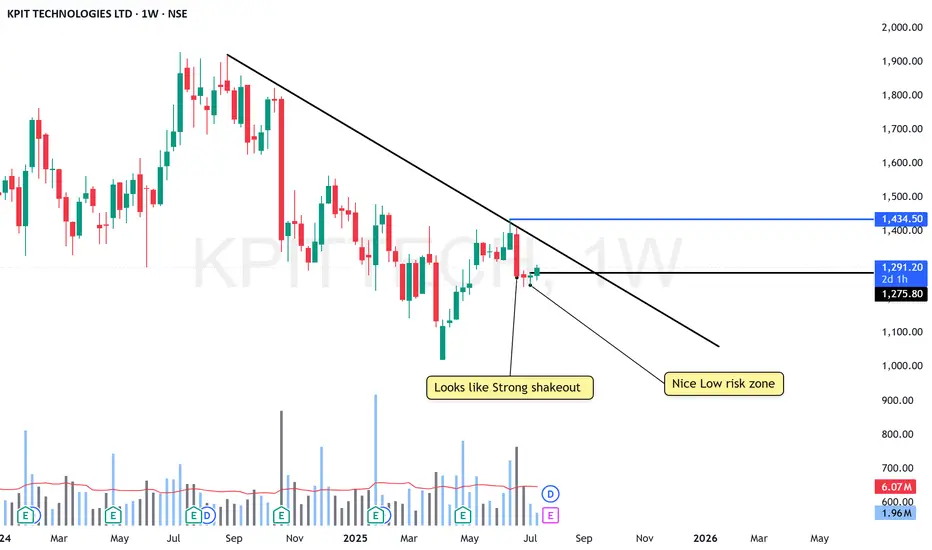
KPIT At low risk Zone - Getting ready to BlastNSE:KPITTECH
Its at Nice low risk Zone
KEEP IN MIND: The 6Rs Dividend Announced at QTR is on 28th JULY
Good to keep on the radar
Always respect SL & position sizing
========================
Trade Secrets By Pratik
========================
Disclaimer
NOT SEBI REGISTERED
This is our personal view and this analysis
is only for educational purposes
Please consult your advisor before
investing or trading
You are solely responsible for any decisions
you take on basis of our research.
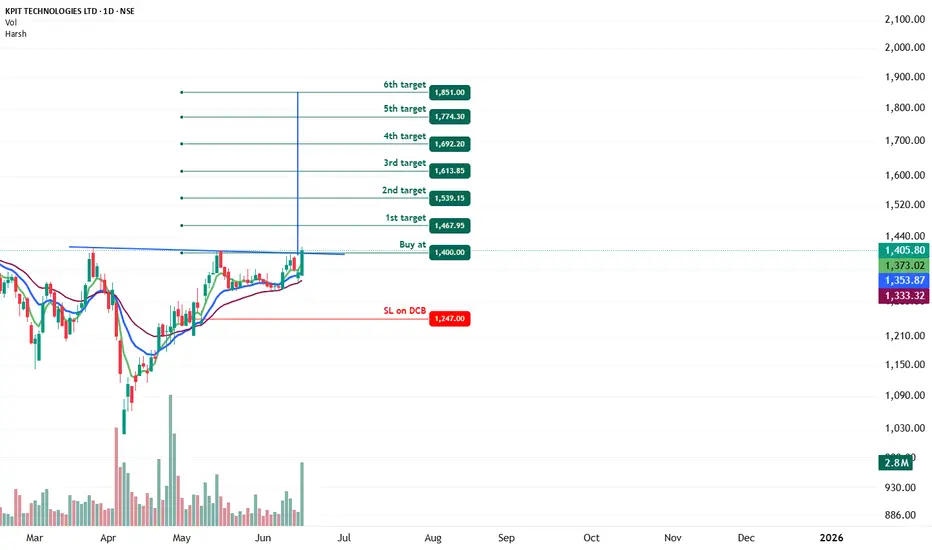
KPIT TECHNOLOGIES - Bullish Inverted H&S Breakout (Daily T/F)Trade Setup
📌 Stock: KPIT TECHNOLOGIES ( NSE:KPITTECH )
📌 Trend: Strong Bullish Momentum
📌 Risk-Reward Ratio: 1:3 (Favorable)
🎯 Entry Zone: ₹1400.00 (Breakout Confirmation)
🛑 Stop Loss: ₹1247.00 (Daily Closing Basis) (-10 % Risk)
🎯 Target Levels:
₹1467.95
₹1539.15
₹1613.85
₹1692.20
₹1774.30
₹1851.00 (Final Target)
Technical Rationale
✅ Bullish Inverted Head and Shoulder Breakout - Classic bullish pattern confirming uptrend continuation
✅ Strong Momentum - Daily RSI > 65, Weekly RSI >64 & Monthly RSI >55
✅ Volume Confirmation - Breakout volume 2.8M vs previous day's 589.41K (Nearly 5x surge)
✅ Multi-Timeframe Alignment - Daily and weekly charts showing strength
Key Observations
• The breakout comes with significantly higher volume, validating strength
• Well-defined pattern with clear price & volume breakout
• Conservative stop loss at recent swing low
Trade Management Strategy
• Consider partial profit booking at each target level
• Move stop loss to breakeven after Target 1 is achieved
• Trail stop loss to protect profits as price progresses
Disclaimer ⚠️
This analysis is strictly for educational purposes and should not be construed as financial advice. Trading in equities involves substantial risk of capital loss. Past performance is not indicative of future results. Always conduct your own research, consider your risk appetite, and consult a financial advisor before making any investment decisions. The author assumes no responsibility for any trading outcomes based on this information.
What do you think? Are you watching NSE:KPITTECH for this breakout opportunity? Share your views in the comments!
Bullish harmonic in Bataindia in Time frame- DAILYSpotted- Bullish harmonic in Bataindia in Time frame- DAILY
Observe whether it respects the harmonic levels.
Study-Practice-sharing
Educational purpose only.
This is not a recommendation -
I am not SEBI registered - Do not TRADE/INVEST based on what I publish here.
I am not responsible for your loss or gain.

Bullish harmonic in jublpharma in Time frame- DAILYSpotted- Bullish harmonic in jublpharma in Time frame- DAILY
Observe whether it respects the harmonic levels.
Study-Practice-sharing
Educational purpose only.
This is not a recommendation -
I am not SEBI registered - Do not TRADE/INVEST based on what I publish here.
I am not responsible for your loss or gain.

Bullish harmonic in BOSCHLTD in Time frame- DAILYSpotted- Bullish harmonic in BOSCHLTD in Time frame- DAILY
Wait for reversal
Observe whether it respects the harmonic levels.
Study-Practice-sharing
Educational purpose only.
This is not a recommendation -
I am not SEBI registered - Do not TRADE/INVEST based on what I publish here.
I am not responsible for your loss or gain.

KPITTECH DOUBLE BOTTOM BREAKOUTKPITTech double bottom breakout
with volume spike strong rsi
after breaking 200ema 1550
#target 1550-1800-1900
NO BUY/SELL RECOMENDATION

KPIT - at 1 YEAR SUPPORT LEVEL Can Enter at 1330
if again falls then you need to average at 1230 level
Target - 1800,1930
Disclaimer - All information on this page is for educational purposes only,
we are not SEBI Registered, Please consult a SEBI registered financial advisor for your financial matters before investing And taking any decision. We are not responsible for any profit/loss you made.
Request your support and engagement by liking and commenting & follow to provide encouragement
HAPPY TRADING 👍

KPIT Tech: Is This High-Conviction Pattern Set to Deliver?This is purely a technical play in NSE:KPITTECH
The chart is showing a high-conviction inverse head and shoulders pattern, suggesting a potential bullish reversal. A volume breakout and close on a lower timeframe above 1882 could provide a solid entry point.
For this trade one can maintain a strict stop loss of 1790. The targets to aim for are 2054 and 2105, which align with the expected move from this setup .
This is a short-term trade idea, but monitor price action and volume for confirmation of the breakout. Additionally, consider any other technical indicators or tools that could further validate this setup.
Disclaimer: This analysis is for educational purposes only and does not constitute financial advice. Trading involves risks and is not suitable for everyone. Always conduct your own research and consult with a financial advisor before making any investment decisions. The author is not responsible for any losses incurred.

KPIT - Can it make C&HKPIT - Can it make C&H pattern on weekly TF, which is continuation pattern after a huge rally from base....
Keep tracking

KPIT TECH Medium term setupKPIT Tech for the medium timeframe (6+months)
• 61% retracement done of 26sep-12feb trend
• Resistance broken should now act as a support
• On the downside, 1550 should not break for swing traders & 1400 should not break for medium-term traders

KPIT TECH - Price analysis & observation1. Currently it is consolidating, if it breaks upside we can look for the marked targets.
2. No new entry as RRR is not favourable.
3. I'm holding it from the bottom and trailing the SL aggressively.
- Stay tuned for further insights, updates and trade safely!
- If you liked the analysis, don't forget to leave a comment and boost the post. Happy trading!
Disclaimer: This is NOT a buy/sell recommendation. This post is meant for learning purposes only. Please, do your due diligence before investing.
Thanks & Regards,
Anubrata Ray

KPIT Analysis! Ascending triangle!!KPIT Weekly Analysis
Ascending Triangle Pattern Formation in KPIT
KPIT has made Ascending Triangle Patern on Weekly Timeframe. KPIT has giver breakout at it's resistance level and trying to retest the level to establish the support over there. 805-829 is the support zone range. Price may take support at this zone and move further up towards our projected profit.
Trading Psychology - Aggresive investors can initiate buy at current price level and Conservative investers can initiate buy above 945 levels.
Entry - Current Level or Above 945
Taregt - 1992.35
Stop Loss- Below 737.25
If you like my analysis please do boost and share. I want support from you guys to help our trading community to achieve an edge in Technical Analysis
Disclaimer - All my analysis are for Educational Purpose only. Before entering into any trade - 1) Educate Yourself 2)Do your own research and analysis 3)Define your Risk to Reward ratio 3)Don't trade with full capital

KPITTECH - good time to accumulateNSE:KPITTECH
cmp 1476
can be accumulated between 1640-1350 and be ready to hold for 3-4 months
keep a watch for weekly close above 1765
should do well above 1765
The objective of this analysis is knowledge sharing and education. There isn't any buy or sell advise in this article. Every stock is held for a short to medium amount of time and is positional.
It is expected of each person to carry out independent research and evaluation to ascertain whether my perspective is consistent with your studies.

KPIT Tech might cross the resistance levelsKPIT Tech has been showing signs of bounching back up after some down moves and has formed an upward triangle pattern showing less signs of the fall. It seems that with the current strengh it can break the resistance levels of 1530.
If the breakout is supported by Good volumes then it can give us the levels of 1562-1593-1635-1671-1763 with the base levels of 1473-1406-1391.
Overall market conditions and volitality should be in favour to support its move.
No recommendations, Just my view based on chart pattern.

KPITTECH 'W' CHART PATTERNCMP 1540
1st Target 1610
2nd Target 1680
3rd Target 1725
Stop loss 1470
W Pattern in Stock Market:
W pattern in stock market is a technical analysis chart pattern that resembles the letter “W” and typically indicates a potential reversal in the direction of a stock’s price movement. This pattern consists of two consecutive troughs (low points) separated by a higher peak (high point) in between, forming the shape of a W .

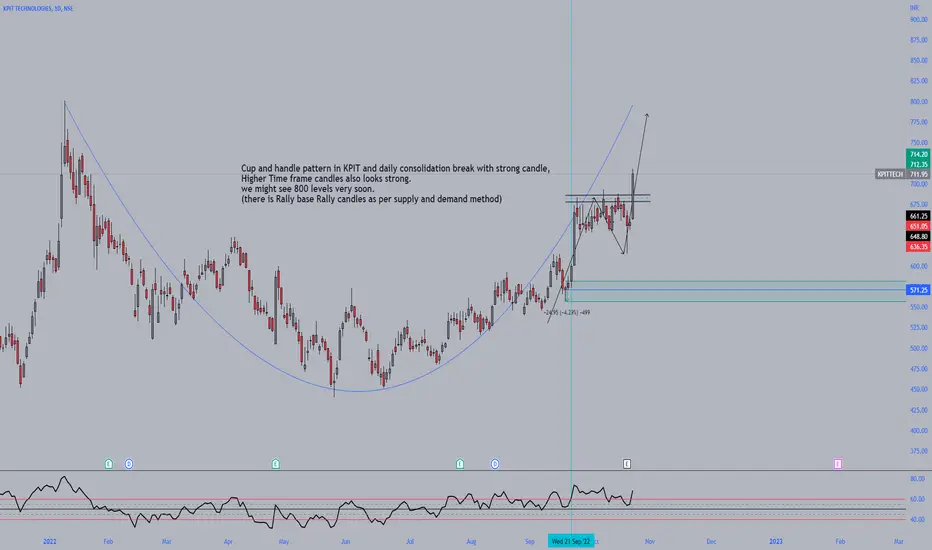
KPIT - Strong consolidation breakout and Cup-handle pattern.Cup and handle pattern in KPIT and daily consolidation break with strong candle,
Higher Time frame candles (M/W)also looks strong.
we might see 800 levels very soon.
(there is Rally base Rally candles as per supply and demand method)
-Educational purpose.
KPIT ready to take offKPITTECH has given a box breakout and is in a strong uptrend with the sector being bullish too. One can look to make entries around cmp. The breakout is on back of a false breakdown which gives the trade more confidence. Stop loss should be around 1425

KPITTECH Analysis & PredictionThis is the analysis of KPITTECH in the Daily Time Frame. Watch carefully. The chart explains itself.
If it breaks and sustains above the upcoming resistance level, it is good for the stock.
There are some prediction levels. These Levels act as Support and Resistance according to position of price. You have to trade according to level breakout or breakdown.
Always maintain your risk management.
Book your profit according to your “STOMACH”.
Disclaimer:
This is not investment advice. I am not a SEBI Registered Analyst. Anything posted here is my own analysis and views. This is created for educational purposes only. Always consult your Financial Advisor before taking any decision or trade.
Happy trading.
About KPITTECH :
KPIT Technologies Ltd. engages in the provision of software for the automobile and mobility industry. It operates through the following geographical segments: Americas, UK and Europe, and Rest of the World. The company was founded by Shashishekhar Pandit, Kishore Parshuram Patil, and Sachin Dattatraya Tikekar on January 1, 2018 and is headquartered in Pune, India.

KPITTECH - Long Setup, Move is ON..NSE:KPITTECH
✅ #KPITTECH trading above Resistance of 1540
✅ Next Resistance is at 1715
Related charts:
Charts are self-explanatory. Levels of breakout, possible up-moves (where stock may find resistances) and support (close below which, setup will be invalidated) are clearly defined.
Disclaimer: This is for demonstration and educational purpose only. This is not buying or selling recommendations. I am not SEBI registered. Please consult your financial advisor before taking any trade.

KPIT Tech hits record high ,surges 11% after raisingKPIT Tech hits record high, surges 11% after raising FY24 growth outlook
KPIT increased FY24 CC growth outlook to 37%+ from 27%-30% earlier and EBITDA outlook increased to 20%+ from 19%-20% earlier.
Shares of #KPITTechnologies hit a record high of Rs 1,249.95, as they rallied 5 per cent on the BSE in Tuesday’s intra-day trade in an otherwise volatile market after the company raised fiscal 2023-24 (FY24) growth outlook. In past two trading days, the stock has surged 11 per cent. In comparison, the S&P BSE Sensex was down 0.1 per cent at 64,051 at 09:311 AM.
#KPITTechnologies said it increased FY24 constant currency (CC) growth outlook to 37 per cent plus from 27 per cent - 30 per cent earlier. Earnings before interest, taxes, depreciation, and amortization (EBITDA) outlook increased to 20 per cent plus from 19 per cent - 20 per cent earlier.

KPIT - ANOTHER BULLISH WAVE SETTING UPDoes It Need Any Explanation?
Crossover Of The Horizontal Line Explains The Most Of It.
New Targets Of 1380-1430 Approaching.

baap_of_breakout analysis of multibagger stocksthis analysis is behalf of previous suggested stocks how they performs last week
