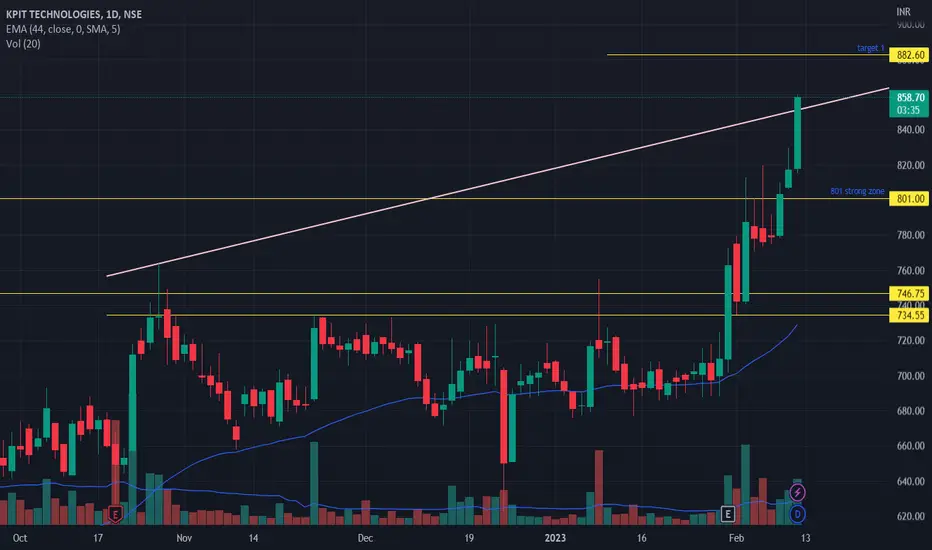
Ride the Wave: KPITTECH- Breakout Signals Profitable OpportunityKPITTECH, has recently caught the attention of traders with its impressive momentum. stock experienced a breakout from the bullish trendline, marking a significant turning point. Currently, the stock is testing its breakout at trendline which was supply line before breakout, which has now transformed into a demand line.
📊 Key Analysis Points 📊
When examining the daily timeframe, it's clear that the stock is holding above its breakout level with minimal volume, confirming the bullish outlook at retest of breakout.
Zooming in to the 75-minute timeframe, we observe a bullish RSI divergence, providing additional confirmation for a buy entry at the retest of the trendline breakout.
Moreover, analysing the volume on the 75-minute timeframe, we notice that the majority of bullish candles exhibit higher volume, surpassing the 50-day moving average of volume. This indicates a significant buying interest and reinforces the bullish setup.
Based on this analysis, we can plan our buy trade if the price surpasses today's high at 1067. Once the breakout is confirmed, we can enter the trade at 1069. To manage risk, it is recommended to place the stop loss below the previous swing low, around 1044, it's prudent to keep a buffer and set the stop loss at 1041. it's crucial to trail stop losses to secure profits as the trade progresses.
🔍 Educational Insights 🔍
Before concluding this analysis, let's clarify some technical terms used:
1. Breakout : This refers to a price movement that surpasses a key resistance level or trendline, indicating a potential shift in market sentiment and often leading to further price appreciation.
2. Volume : It represents the number of shares or contracts traded during a given time period. Analysing volume can provide insights into the strength or weakness of price movements.
Curious about volume? Check out my educational article on volume analysis that made it to TradingView's prestigious Editor's Pick:
3. RSI (Relative Strength Index) Divergence : RSI is a popular momentum oscillator. Divergence occurs when the price and RSI indicator move in opposite directions, indicating a potential trend reversal.
curious about RSI Divergence? Learn more in my educational article on Divergence, chosen for TradingView's Editor's Pick:
Remember, this analysis is for educational purposes only and does not serve as financial advice. As a reminder, I am not a SEBI registered analyst.
If you found this analysis helpful, please like and share your observations in the comments section below. Your feedback keeps me motivated to consistently provide valuable content. Don't forget to follow me on TradingView for more articles and trade setups. Let's connect and grow together! 😊📈
Follow me on TradingView for more: in.tradingview.com
"The only way to do great work is to love what you do."
Kpittechnologies

KPIT Technologies Ltd - Drifting towards breaking trend lineAn india based global technology company focussed on automobile engineering and mobility solutions. Stock under strong resistance zone, Retested and bounced back . Respected the resistance line so many times .So if it bounce over from here , can expect a good movement.

KPIT TECHNOLOGIES : Resistance BreakoutAfter numerous rejections from the resistance, a breakout finally occurred.
The price is above the 200-day moving average.
Price is trending above its 20-day moving average.
The breakout candle has proper volume, so it can't be called a fake breakout.
Resistance Breakout in KPITTECH

KPIT Technologies Limited KPITTECH:- Cup and handle pattern has formed, don't plan until proper breakout is found, keep an eye till strong stock is there
Hello traders,
As always, simple and neat charts so everyone can understand and not make it too complicated.
rest details mentioned in the chart.
will be posting more such ideas like this. Until that, like share and follow :)
check my other ideas to get to know about all the successful trades based on price action.
Thanks,
Ajay.
keep learning and keep earning.

KPIT TECH - LONG TERM - HARMONICSPotential Bullish butterfly yet to complete.
PRZ marked with the completion of the above-mentioned pattern.
Also, potential targets on the CD retracement are marked with fib retracement plot.

Break of trendline1.RSI and stock are moving in same trend
2.break of trendline
3.kpittech is in all time high
good stock for btst trade
KPIT Technologies - In a strong resistance zoneAn india based global technology company focussed on automobile engineering and mobility solutions. Only for educational purpose.Not a recommendation . Stock under strong resistance zone. Respected the resistance level 2-3 times .So if it bounce over from here , can expect a good flow to upside.

Perfect cup and handle patternAfter a long consolidation, the chart has a higher probability of breaking out. This is only an educational chart and is no way a recommendation. Please study and consult your financial advisor.

KPIT Forming a CnH and BO#KPIT looking very good and forming a bookish CnH. Can be taken for 30-40% upside in midterm.
CMP 716
KPIT in news all positive reasons also moving to Midcap.

KPIT on ConsolidationGet ready for next rally over 730 , trying to create rounding bottom
keep it on your watchlist!

KPITTECH - Ichimoku Bullish Breakout Stock Name - KPIT Technologies Ltd
Ichimoku Cloud Setup :
1). Today's close is above the Conversion Line
2). Future Kumo is Turning Bullish
3). Chikou span is slanting upwards
All these parameters are showing bullishness at Current Market Price
and more bullishness AFTER crossing 735
#This is not Buy and Sell recommendation to any one. This is for education purpose and a helping hand to learn trading in Market.
# Cloud Trading
# Ichimoku Cloud
# Ichimoku Followers
I hope you all like my analysis.
Please do share your thoughts into comment section.
Please give a like, it motivates me to do analysis.

KPITTECH_Rounding Bottom?KPITTECH Seems like a Rounding Bottom not yet activated. If price sustain above the 750. It will move higher. refer the target.

KPIT TECHSimple Price Action
Formed a trend line support from June and respecting the levels.
Gave a breakout , took the retest and again broke the weekly candle high with High volumes.
#HappyDiwaliFolks
#HappyTrading

KPITTech, strong script in weak IT pack, 612-620 grt valu zoneIn entire IT pack which is struggling right now, KPIT Tech looks strong on daily & weekly TF. Any retracement towards 612-620 zone will provide good opportunity to enter. RSI, ADX both are strong on daily & weekly TF so I would be looking for opportunity to enter. Entry in the zone of 612-620 with targets 1) 720 2) 790 and SL of 599 on weekly basis will be my plan.
Happy earning :)


A POTENTIAL UPFLAG PATTERN IN kpit
Only For Educational Purposes,
Invest at your own discretion
KPIT TECH after delivering a staggering quarter with updated Growth Guidance and Highest TCV for all time now looks to deliver in the Charts,
KPIT Closed around 681 a few weeks ago, and has tried to test the same levels a couple of times but has failed to do so clearly.
Now after respecting the FIB levels @647 the stock is looking to form a good base and forming a Potential Upflag pattern which may burst out in upcoming Months,
One can look to add it at the present levels as well with the potential target of Rs 750/- before Q4 23 ends.
Regards

KPIT important levelsKPIT intraday important levels for 11-10-2022.
KPIT has is near a support zone.
It has tested it multiple times. Chances of it breaking the support levels are high.

Kpit Tech -Inverted Head & Shoulders Pattern Breakout..Kpit Tech -Inverted Head & Shoulders Pattern Breakout Daily Time Frame. Entry Zone-640/670.Expect a Target-795.Stop Loss-600 Closing Basis. Only Education Purpose..


KPIT looks goodChart -> KPIT Weekly
After an unbelievable uptrend, the stock needed some time to cool off. That's what happened with a down move. But this week it broke the previous high with a volume spark!
CMP -> 660
Good range: 600-640
Target: 801
SL: 570 weekly close
Disclaimer: This is for educational purposes only, not any recommendations to buy or sell. As I am not SEBI registered, please consult your financial advisor before taking any action.


KPIT Technologies... Is it ready to "tech" off?The stock price action in KPIT Technologies look good, given its move from around 450 levels to 569.
Breakout above 590 will add some momentum for it to go till 625 and 650 levels in the short to medium term.
Good support in the range between 540 and 525, below which it has strong support at 455.
Always trade with a stop loss.
Note: Not a buy/sell recommendation. Do consult your financial advisor.

KPITTECH Cup&Handle BO !!NSE:KPITTECH
#NSE:KPITTECH formed beautiful #Cupandhandle and BO,
sustainability above the resistance level may reach to 750 🎯
