KSCL – Technical & Educational Snapshot📊 KSCL – Technical & Educational Snapshot
Ticker: NSE: KSCL | Sector: 🌱 Seeds & Agro
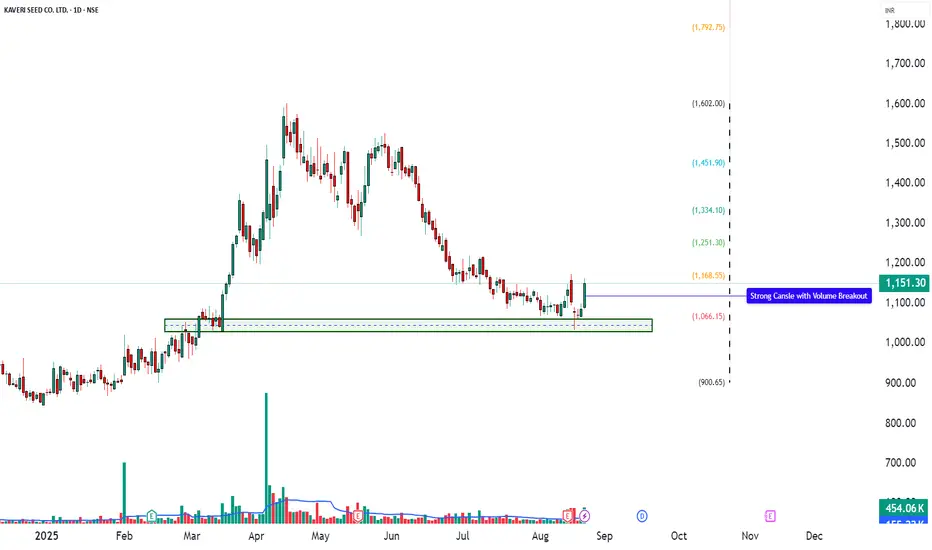
CMP: ₹1,151.30 ▲ (as of 21 Aug 2025)
Rating (for learning purpose): ⭐⭐⭐⭐
Pattern Observed: 📉 Double Top + Descending Wedge (target near ₹1,000 completed)
KSCL earlier formed a Double Top followed by a Descending Wedge breakdown, with the projected bearish reference zone being successfully achieved. With that completion, the stock has now entered a new phase, displaying fresh bullish momentum. A strong bullish candle, RSI breakout, and Bollinger Band expansion from a squeeze highlight renewed buying strength.
This technical shift points towards a possible trend reversal or at least a medium-term bounce, provided the price sustains above key resistance levels. Supporting indicators (MACD, CCI, Stochastic) are aligned in favor of momentum continuation, adding weight to the bullish case.
📊 Momentum Snapshot:
Momentum indicators are tilting to the bullish side. While Stochastic (84) is moderately elevated, the confluence of RSI breakout, MACD bullish crossover, and strong CCI indicates that momentum could sustain until higher resistance levels are tested.
📊 Volume Check
🔹 Current Volume: 454.06K
🔹 20 SMA Volume: 155.22K ✅
💥 Nearly 3x average volume – confirms strong institutional / broad-based buying interest!
💡 Interpretation:
When volume is well above the 20-period average, it strengthens the reliability of a breakout.
This shows the move is not just retail-driven but likely backed by larger participants.
High-volume breakouts tend to sustain better compared to low-volume moves.
💡 Learnings:
Breakouts emerging from a Bollinger Band Squeeze often lead to strong trending moves as volatility expands. When supported by confirmations such as RSI and MACD turning positive together, the reliability of the breakout improves significantly.
Elevated CCI values reflect strong buying momentum, though traders should remain mindful of possible pullbacks. Above all, defining clear stop-loss and invalidation levels ensures disciplined trade management.
📌 Fresh bullish signals are emerging → but confirmation only comes on sustained move above ₹1,180–1,209. Failure to hold above ₹1,100 may keep it in sideways consolidation or trigger further downward pressure.
🔑 Key Levels
Resistance: 1180 | 1209 | 1256
Support: 1104 | 1057 | 1028
Fibonacci Levels: 900.65 | 1066.15 | 1168.55 | 1251.30 | 1334.10 | 1451.90 | 1602
Pullback Level: Around 1104–1110 zone (first support & prior base)
Invalidation Level: Close below 1057 (would negate the bullish setup)
📝 STWP Trade Setup
📌 Entry (Long): Above 1,162
🛡 Stop Loss: 1,059 or below
🎯 Reference Levels: 1264 | 1366
⚠️ Disclaimer – Please Read Carefully
The information shared here is meant purely for learning and awareness. It is not a buy or sell recommendation and should not be taken as investment advice. I am not a SEBI-registered investment advisor, and all views expressed are based on personal study, chart patterns, and publicly available market data.
Trading — whether in stocks or options — carries risk. Markets can move unexpectedly, and losses can sometimes exceed the money you have invested. Past performance or past setups do not guarantee future results.
If you are a beginner, treat this as a guide to understand how the market works — practice on paper trades before risking real money. If you are experienced, always assess your own risk, position sizing, and strategy suitability before entering trades.
Consult a SEBI-registered financial advisor before making any real trading decision. By engaging with this content, you acknowledge full responsibility for your trades and investments.
💬 Found this useful?
🔼 Give this post a Boost to help more traders discover clean, structured learning.
✍️ Drop your thoughts, questions, or setups in the comments — let’s grow together!
🔁 Share with fellow traders and beginners to spread awareness.
✅ Follow simpletradewithpatience for beginner-friendly setups, price action insights & disciplined trading content.
🚀 Stay Calm. Stay Clean. Trade With Patience.
Trade Smart | Learn Zones | Be Self-Reliant 📊
KSCL
KSCL BREAKING LONG TIME RESISTANCEKSCL breaking resistance on daily basis
good volume building up strong rsi
20ema crossing 200ema above side
#target 1200,sl 850
NO BUY/SELL RECOMENDATION

KSCL - Long Setup, Move is ON..NSE:KSCL
✅ #KSCL trading above Resistance of 1026
✅ Next Resistance is at 1470
Related charts:
Charts are self-explanatory. Levels of breakout, possible up-moves (where stock may find resistances) and support (close below which, setup will be invalidated) are clearly defined.
Disclaimer: This is for demonstration and educational purpose only. This is not buying or selling recommendations. I am not SEBI registered. Please consult your financial advisor before taking any trade.

KSCL is ready for longHey Family, there is a one more stock Which is showing a great opportunity.
Key Points:-
* Formation of Ascending Triangle pattern in daily TF.
* From June 2024 to July 2024 tested resistance many times.
* It's Near resistance Zone and trying to sustain above Resistance Zone with good volume.
* If resistance zone is Sustained then we can see a good move.
* Volume Accumulation (Volume is Showing Strength).
What is your view please comment it down and also boost the idea this help to motivate us. We are Certified. All views shared on this channel are my personal opinion and is shared for educational purpose and should not be considered advise of any nature.

KAVERI SEED COMPANY 1000 ABOVE?+Stock is forming corrective abc pattern then it long period consolidation we can see all time high breakout in this share as per candle behaviour. I have market all wave pattern in this share you can ask me any question in comment section
First target is 957
second target is 1176
Third target is 1293
Thanks

KSCL - Long Setup, Move is ON..NSE:KSCL
✅ #KSCL trading above Resistance of 782
✅ Next Resistance is at 1026
Related charts:
Charts are self-explanatory. Levels of breakout, possible up-moves (where stock may find resistances) and support (close below which, setup will be invalidated) are clearly defined.
Disclaimer: This is for demonstration and educational purpose only. This is not buying or selling recommendations. I am not SEBI registered. Please consult your financial advisor before taking any trade.

KSCL for 30% (approx..) GainKaveri Seed Company Ltd is showing a trendline breakout with good volume. Fundamental is very nice. you can see this on below link. Low PE , good DII and FII holding, less public holding is also very good. Piotroski Score is 8 and Altman Z Score is 4.98 this shows the fundamental comfort for this stock. rest is in the link..
( www.screener.in )
CMP : 630
TG : 780
SL : Below 21 daily EMA or 9 weekly EMA
Stock's selection based on 5 Point Analysis:
1: Idea : Breakout.
2: Support : Volume, Delivery & VWAP. (To view this, click sedg.in )
3: Technical : 9/21/55/200-EMA, RS>0, MACD, RSI & Super trend up. ( To view this, click sedg.in )
4: Fundamental : PE , PAT, Industry & peer PE and sector performance.
5: Timing : Entry Timing on Daily chart.
Disclaimer : It is my personal view as a trader and for educational purpose only. Equity market involves risk .
Please consult your financial adviser before taking any decision.
Disclosure : Going to Hold

Long Position Opportunity in KSCL: Bottom FormationAn enticing long position opportunity arises in the cash market stock KSCL, marked by a bottom formation pattern and a significant breakout from deep consolidation.
*Technical Analysis:*
KSCL's stock price has recently formed a bottoming pattern, indicating a potential reversal from previous downtrends. Additionally, the stock has experienced a breakout from a period of deep consolidation, suggesting renewed bullish momentum. Key technical indicators may further confirm the bullish outlook, providing additional validation for potential long positions.
*Trade Setup:*
Traders aiming to capitalize on this bullish momentum should conduct their own analysis and consider the provided target and stop-loss levels outlined on the accompanying charts. These levels are strategically determined to facilitate effective risk management and maximize potential gains.
*Target and Stop-loss Levels:*
- *Target:* Identified resistance levels and price targets on the charts offer clear objectives for profit-taking, reflecting the anticipated upward movement in the stock.
- *Stop-loss:* A predetermined stop-loss level is established to mitigate risk and protect capital in the event of adverse price movements.
*Conclusion:*
KSCL presents an attractive opportunity for a long position in the cash market, supported by a bottom formation pattern and a breakout from deep consolidation. Traders are encouraged to conduct their own analysis and consider the provided target and stop-loss levels to manage risk effectively while aiming for potential profits.
Disclaimer: Trading involves inherent risks, and individuals should conduct their own research or consult with a financial advisor before making any investment decisions.

KSCL - Bullish Consolidation with VolumesNSE: KSCL is closing with a bullish consolidation candle supported with volumes.
Today's volumes and candlestick formation indicates strong demand and stock should move to previous swing highs in the coming days.
The stock has been moving along the horizontal support for the past few days which is indicating demand.
One can look for a 8% to 13% gain on deployed capital in this swing trade.
The view is to be discarded in the event of the stock breaking previous swing low.
#NSEindia #Trading #StockMarketindia #Tradingview #SwingTrade

PAY HEED TO KAVERI SEED !!!Incorporated in 1976 with an objective to fuel India’s green revolution, the Co. is now India’s largest agriculture seed production company specializing in Hybrid Seeds for key Indian field and vegetable crops.
Manufacturing Capabilities
The Co. has 17 seed processing plants. It has 170+ outreach trial centres and a maize cob drying facility capable of producing 4,500 MT every cycle. The overall average throughput of the seed production facilities is 115 MT per hour, with a cotton delinting capacity of 18 MT per day. The daily ginning capacity is 5 MT. It has a total of 10 lakh square feet of warehouse space in numerous key locations across India, as well as 15,000 MT of total cold storage capacity.
The Co. has a significant local presence and has seen rising growth in the export market, which includes Pakistan, Sri Lanka, Bangladesh, and Vietnam.
During FY22, the Co. completed a buy-back of 20 lacs Equity Shares at an average price of Rs. 597.50/- per Equity Share for an aggregate consideration of Rs. 119.95 Crores.
Future Outlook
The Co. will further introduce new product variants across the Non-cotton segments like rice, maize, pearl millet and vegetables and expand its market presence.

#KSCL #Shortterm Pick#KSCL Stock made a Higher-High, made a rejection from Previous high, currently at the Retracement Point. Buy at decent dip maintaining SL on Daily candle basis.
Good to buy for minimum 15 to 20% returns.

KSCL BREKOUT H&S PATTERN WCBKSCL breaking h&s pattern #weekly chart
good volume on WCB
target can be 780+
use sl as per ur risk management
educational idea

KSCL - Breakout after 350+ daysDetailed View about this Breakout:
No.of Resistance: 4
No.of Support: 4
Consolidation Days: 350+ Days
What do you think?
1. It is Good Breakout after 350+ days
2. Trap on buying High
3. No idea about it
Share your view in comment section...
I Post educational chart for 3 Swing / Potential Stocks Everyday.
Check Related Ideas section for more Swing Stock analysis.

KSCL Triangle BreakoutKSCL has given a breakout from Triangle pattern on 1D & 1W timeframe with high volumes. It has formed a triangle pattern within a flag pattern.

head and shoulder pattern in KSCLIdea is published for educational purpose and not for trading purpose.

KSCL LongKSCL Long
50 Day EMA- 525
200 Week EMA- 538
RSI-68
Buy at CMP- 540
SL- 514
Target- 570, 591, 609
Join us, Learn more, Earn more
Disclaimer- We are not SEBI registered advisor.
Charts and views are only for educational purpose.

[KSCL] | EXPECT GOOD MOVE | 2:1 RRDisclaimer: Please take trades according to your risk appetite & analysis. This chart is by no means intended to be a recommendation.
a) Rounding consolidation since 2018.
b) Important zone of 680-700 broken in May 2021.
c) Last week a strong bullish candle printed respecting the previous resistance zone now as support
Buying at CMP, for targets of 940, 1016. SL 646


KAVERI SEEDS COMPANY LTD (KSCL) SHARE ANALYSIS Today I'll discuss company stock i.e. KSCL
2. Today Date is 02-09-2021 and I am writing this blog after trading hours in evening.
3. Currently stock is trading at 588.55.
4. I am using daily candle chart for technical analysis.
5. As per my technical analysis this stock is technical target is 588.55 to 780, which is approximately 32% gain. if we buy at current price at hold upto our target price, then we can earn 32% gain.
6. How much time it takes to reach target, according to my analysis, it takes maximum 4-5 months
7. Company is debt free.
IMPORTANT RULES
8. Only invest 3 % of your capital in one stock, Please don't ignore this rule because we are investing our hard-earn money here so risk management is best part of trading.
9. We never sell stock in loss.
10. We are investing in equity share.


KAVERI SEED TARGET UPDATE 10-8-2021Look fresh in range 680-710 for upside 900-1000 med term with SL 600..!!!


