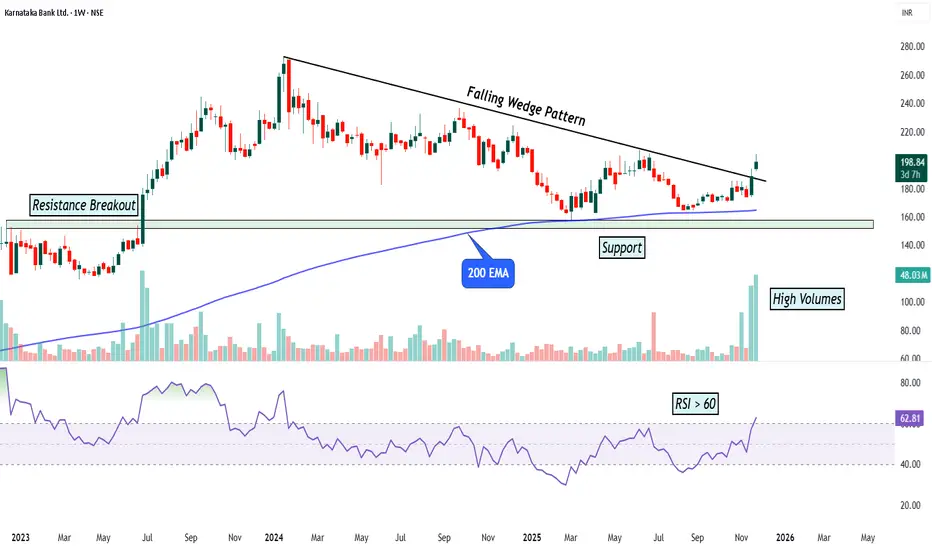
KTKBANK - Weekly Long Set upThis weekly chart highlights a long-term bullish setup forming after a previous resistance breakout. Following that breakout, the price moved into a prolonged correction and created a falling wedge pattern. Falling wedges are known for signaling potential upside reversals, especially when they occur within a larger uptrend.
Throughout the wedge, the 200 EMA continued to act as strong dynamic support. Each time price approached the 200 EMA, buyers defended the level, showing that long-term investors were still active. This area also aligned with a horizontal support zone, creating a strong confluence where the probability of a reversal increases.
The breakout signal appears when the price finally moves above the upper trendline of the falling wedge. This breakout is supported by a clear surge in volume, indicating strong participation and confirming that the breakout has strength behind it.
The RSI crossing and sustaining above 60 adds another layer of confirmation. On a weekly timeframe, RSI above 60 usually signals the start of a stronger momentum phase where buyers dominate.
Entry point 1 (aggressive):
Entering when price breaks above the falling wedge trendline with improving volume while staying above the 200 EMA and support zone.
Entry point 2 (conservative):
Waiting for a weekly candle to close firmly above the wedge trendline, along with RSI holding above 60 and volume remaining above average.
Risk placement is below the support zone and the 200 EMA, because a breakdown below these levels would weaken the overall setup. Reward is projected based on the height of the wedge and previous major swing highs.
This combination of wedge breakout, strong support confluence, rising volume, and momentum shift provides a complete technical setup for a potential trend continuation.
Ktkbanklong
Potential Breakout: Karnataka Bank Eyeing Upside Towards 285Details:
Asset: Karnataka Bank Limited (KTKBANK)
Breakout Level: Sustaining above 245
Potential Target: 285 and beyond
Stop Loss: Below breakout level or as per risk tolerance
Timeframe: Short to medium-term
Rationale: Karnataka Bank Limited (KTKBANK) is approaching a potential breakout level around 245. Sustaining above this level could signal a bullish sentiment shift, potentially leading to further upside momentum. If the breakout occurs and is sustained, KTKBANK could target 285 and beyond in the near future.
Market Analysis:
Technical Breakout: A sustained move above 245 would indicate a technical breakout, attracting buying interest and potentially driving the price higher.
Market Sentiment: Positive market sentiment or company-specific catalysts may be contributing to the anticipated breakout in KTKBANK.
Price Target:
The initial target for KTKBANK is set at 285, with potential for further upside depending on market dynamics and investor sentiment.
Risk Management:
It's important to implement a stop loss strategy below the breakout level to manage risk in case of unexpected price reversals.
Timeframe:
The projected target of 285 and beyond is based on a short to medium-term outlook, but actual timing may vary based on market conditions.
Risk-Reward Ratio: Consider individual risk tolerance and adjust position size accordingly to maintain a favorable risk-reward ratio.
As with any investment opportunity, conduct thorough analysis and consider factors such as market trends, company fundamentals, and risk management strategies before making trading decisions.

KTKBANKMarket Cap: ₹ 8,469 Cr.
Stock P/E: 6.25
ROCE: 5.86 %
Stock is trading at 0.93 times its book value
Company has delivered good profit growth of 29.4% CAGR over last 5 years
Symmetrical Triangle Breakout on Daily Time Frame with Long Signal.

Karnataka Bank: Still one can enter for a long setup
KTKBank is trending up, possibly target price to hit 190.00 Still very good setup to go up once it clears the line of resistance.
Flag and Pole pattern has already given a breakout followed by two legged correction. Spike phase is still trending on daily chart.
SL can be very well placed at the pullback showed at 146.35 or more comfortable one can be at 136.
Please note that this is more of educational purpose and it's important to note that this analysis is based on technical indicators
so further research and analysis are recommended before anyone making any investment decisions.

KTKBANK LONG#KTKBANK is getting ready for breakout.
Looks like IHS pattern to me. So Kept in radar.
Accumulated a little --> will add main chunk after breakout confirmation only
Still need to check relative strength & momentum as it is PSU bank. Bcuz they don't usually move.

KTKBANK - Ichimoku Bullish Breakout Stock Name - The Karnataka Bank Limited
Ichimoku Cloud Setup :
1). Today's close is above the Conversion Line
2). Future Kumo is Turning Bullish
3). Chikou span is slanting upwards
All these parameters are showing bullishness at Current Market Price
and more bullishness AFTER crossing 113
#This is not Buy and Sell recommendation to any one. This is for education purpose and a helping hand to learn trading in Market.
# Cloud Trading
# Ichimoku Cloud
# Ichimoku Followers
I hope you all like my analysis.
Please do share your thoughts into comment section.
Please give a like, it motivates me to do analysis.

Karnataka Bank Bullish EngulfingBuy KTK Bank On Any Dip To 62-63
Add More If Price Drops To 58-60
SL - 51 (WCB)
Target - 86/100

KTK bank to go longLong KTK Bank above 74.15 SL 67 Target 110. Good risk to reward ratio. Stock is trading near the Weekly BO area. Wait for the Bo of weekly area. This is for your educational purpose only.

KARNATAKA BANK LTDKTK BANK is in Wolfe Wave, the good thing is it is about to get triggered. This is a weekly TF chart. Once it gives a weekly closing above 74. Then it will give a stellar move towards 128 ( P4 of Wolfe Wave). Few intermediate targets would be 99-115. This is a stock which you should have for Diwali.
Chart & Analysis - Adarsh Dey

KTKBANK longAccumulate KTK BANK in between 59-61
with SL 57
Target 1= 73-75
target 2= 83-85
Short term view hold it for next quarter result
Note : Trading in any financial market is very risky. I post ideas for educational purpose only. It is not financial advice. Do not hold us responsible for any potential loss you may incur. Please consult your financial adviser before trading.

keep eye on KTKbankkeep eye on KTKbank
resistance line breakout with huge volume
and declared good result
buy only small qty near 50
low risk trader can buy near 45-47
Target 54 59 63
SL closing below 44
