LALPATHLAB By KRS Charts12th June 2025 / 12:44
Why LALPATHLAB?
1. Fundamentals are good company's figures are stable and giving Dividends too.
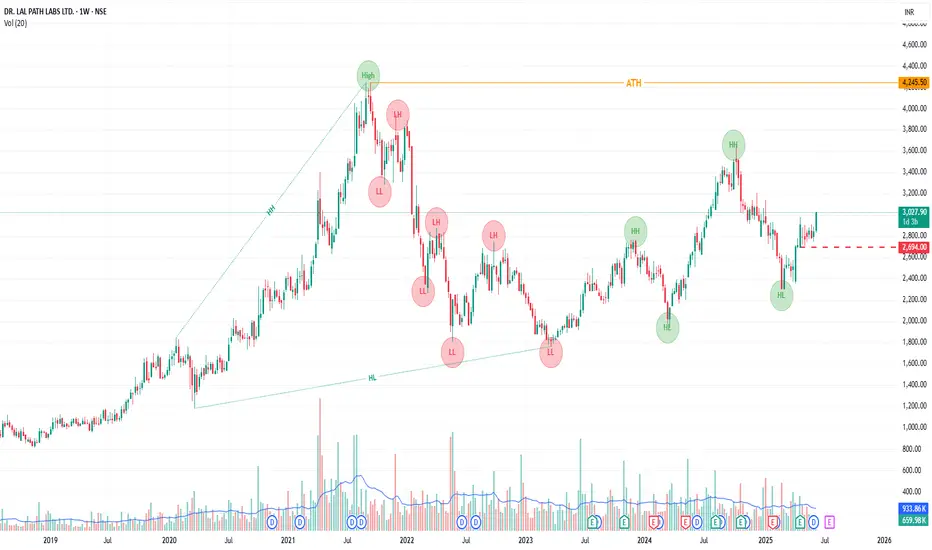
2. Technically, All Time Bullish Stock making Higher Highs and H.Low.
3. Today in 1D timeframe it broke neckline of invt. Head & Shoulder chart pattern.
4. NSE:CNXPHARMA is also looking good which is one more reason to be bullish on one of a good company.
Targets will be New High Point 3750+ Rs.
SL is mentioned in Chart.
Lalpathlabllong
Weekly Bullish Breakout in LALPATHLABA Weekly Bullish Inverted Head and Shoulder pattern is visible in the charts of NSE:LALPATHLAB
Inverted Head and shoulder pattern is a bullish reversal pattern and it is visible in charts after a meaningful downfall in the $NSE:LALPATHLAB.
The stock has made a life high of Rs. 4245.50 and gave highest daily close of Rs. 4208.60, highest weekly close of Rs. 4117.40 and highest monthly close of Rs. 4051.55
MACD already gave Positive crossover on Daily and Weekly charts
and on the Monthly chart it is on the verge of giving positive breakout. So, expecting the momentum to continue.
The daily and weekly RSI is also in bullish zone.
One can look to create a fresh position in the scrip near Rs. 2500 levels with the stoploss of Rs. 2302.50 on weekly closing basis. The 1st target will be 2632.50, 2nd target will be 2752.85, 3rd target will be 2892.10, 4th target will be 3028.65, fifth target will be 3164.00 and sixth and final target will be 3250.
And finally this study is for educational purpose only.

LALPATHLAB BREAKOUTBuy Lalpathlab At Cmp - 2205.8
SL - 2075 ( Weekly Closing Basis )
Target - 2800/3000

LALPATHLABAfter breaking out price retested the level . Looks good for the longs. let see what happens


LALPATHLAB breakout on weekly trendline with high volumeLALPATHLAB has given a breakout on weekly trendline with high volume. It's good stock and almost trading in downtrend since 2021, and corrected from ATH -4245. Now trend reversal is expected and can achieve targets up to 3250 in coming weeks. Keep eye on it or add at mentioned levels.


Looks like moving in next upper box(Darvas box)Buy Lalpathlab @ 2270+/-20
SL - 2042
Target - 2800
Reasons -
1. Breakout with W pattern
2. lower darvas box detected
3. Bad result also did not drawn down the stock price

LALPATHLAB Trade Setup For TomorrowWait for proper breakout and retest and based on that, one can look for buy side entries.
Please HIT the like button, this motivates us to make more such analysis.
For more such trading content follow us on ( @tradechefofficial )

Lalpathlab on monthly demand zoneOne time price is reacted from zone and as a result /footprint daily demand zone created. I think we can enter into trade if price start respecting demand zone.
If price sustain we trade for 1st safe target 3650 and next target will be 3800 & 4100.
Best entry level is near by 2580-3000

Lalpathlab trend analysisRange bound from last 15 days, chances are high for breakout upside. If price sustain over price range 3692 then good to buy for target previous high or new higher high.

NSE:LALPATHLAB All levels mentioned on chart !!NSE:LALPATHLAB
#NSE:LALPATHLAB trading bullish and BO TL
ALl the levels mentioned on chart.
Safe side both the ways marked.

Dr Lal Pathlabs Ltd - 23.12.2021Dr Lal Pathlabs Ltd - 23.12.2021
The stock is trading @ 3473 levels
There is a Support Zone @ 3400
There is a Hammer @ Support Zone
The prices are near EMA
One can initiate a buy position @ current levels with support @ 3388
Watch out for the price action

LALPATHLABNSE: LALPATHLAB 3651
-Triangle Like Formation
-May Be Forming Of H&S As well So Book Profit Timely
-Price Confirms But Volume Missing
-Next Levels To Watch 3652-3800
-Support Levels Are 3480-3380-3300
-Closing Basis

Lalpath Swing TradeLalapath labs price action analysis. Swing traders can plan their trade in this with proper risk management.

LalpathLab - Good RR setupLalpath took support over the lower TL of the channel. Swing traders can make positions above 3800 in the upcoming session. SL below the lower TL.

LALPATHLAB : Triangle pattern LALPATHLAB
trading in a triangle pattern. Wait for breakout any side before entering. Chart from 15 min TimeFrame only.
This is for educational purposes only and my personal view. Please check from your end before entering in to trade.
Please Like and comment for more & regular studies for Nifty , Banknifty & Stocks.

Lal Path: Testing 21 EMAWhenever the stock went below 21 EMA it had a strong bounce. And that is exactly what is happening in here. 4200+ is on the cards

High probablility setupLOGIC,LEVEL AND TARGET WELL MENTIONED IN THE CHART
NOTE -The above interpretation from the chart is my personal view and doesn't guarantee any success.
(Do talk to your financial advisor before making any investment decisions)
please like, share and comment if you have any suggestion regarding this analysis

Price Action - BullishLal Path gave an outstanding result this quarter, it has almost reached its support and the RSI and MACD too seem turning bullish. This seems like a good long set up.

LALPATHLAB FLAG AND POLE PATTERN LALPATHLAB FALG AND POLE BREAKOUT AND CLOSE 200 POINT MOVE POSSIBLE
