Nifty: Balance Still Intact — Rotation Is Quietly Taking ShapeToday’s NSE:NIFTY action again needs to be read calmly.
This was not a breakdown session.
It was another day of controlled rotation inside a well-defined range.
You can see on the chart that even candle looking bearish, buyers are present. 💡( That Green Label on the Candle)
Across intraday timeframes, price drifted lower but without momentum expansion.
No panic candles.
No aggressive follow-through selling.
Just slow, overlapping price action.
That tells us sellers are present, but not in control.
On the daily chart, NIFTY continues to hold above the broader demand zone.
The bullish structure is still intact.
This is time based correction and not price based.
That distinction matters more than the red candle.
💡 For tomorrow, the market’s task remains simple — confirm support or test it once more.
Two scenarios have higher probability:
Scenario 1:
The index holds the 26100–26150 zone and starts compressing again.
Stability here keeps the range intact and preserves the possibility of another upside attempt.
Scenario 2:
The market dips toward the 26000–26050 zone and buyers respond.
A controlled dip followed by acceptance would be constructive and offer better risk-reward for selective longs.
⚠️ The risk scenario to watch:
If NIFTY starts sustaining below 25950,
then this balance phase can shift into a deeper consolidation and momentum will pause.
Intraday bias for tomorrow:
Bias remains neutral to mildly positive as long as price holds above 26000 with acceptance.
This is still not a chasing market.
Trades should be taken only near support, after price slows down.
Now, the important part — where momentum is quietly building.
While the index is digesting, money is rotating selectively into Capital Goods / Infrastructure names.
This is typical behaviour during index consolidation phases.
Leadership starts emerging before the index itself resolves.
Within this sector, two stocks stand out for the next session:
1. NSE:LT
L&T is behaving like a true leader.
Pullbacks are getting absorbed quickly.
Price is holding above short-term supports without distribution near highs.
This is the kind of stock that usually moves first when the index stabilizes.
2. NSE:SIEMENS
Siemens is showing constructive price action.
Relative strength versus NIFTY is improving, not fading.
Approach for these stocks remains the same:
No chasing.
Either buy dips into support with stabilization
or act only on clean breakouts with acceptance.
Overall market mood is balanced, not weak.
This phase rewards selection and patience, not activity.
Let support show itself.
Let leadership confirm.
Then act.
That’s all for today.
Stay process-driven, not opinion-driven.
Have a focused and disciplined trading day ahead.
📊 Levels at a glance:
Support zone: 26100–26150
Major support: 26000–26050
Immediate resistance: 26280–26320
Risk level: Below 25950
Bias: Neutral to mildly positive, trade near support only
High-momentum sector focus: Capital Goods / Infrastructure
Top stocks to track: Larsen & Toubro, Siemens India
Larsentoubro

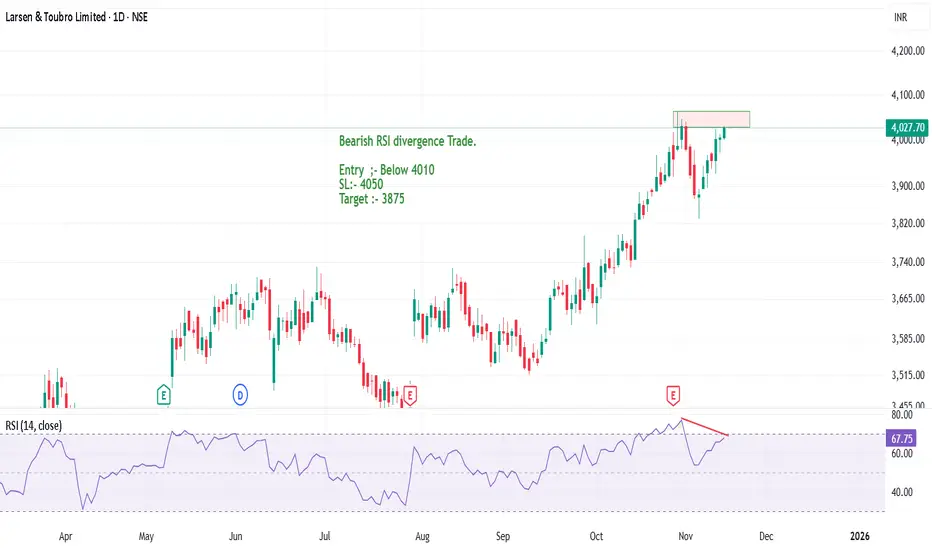
L&T forming a new high or Double Top pattern?Larsen & Toubro is showing a strong bearish RSI divergence on the daily charts. There can be an opportunity to sell the stock in coming trading sessions.
The stock has performed fabulously and good returns has been yeilded by the stock.
If there is a bearish price action, a double top pattern confirmation, good R:R trade can be capture in the stock.
Entry :- Below today's low (4000)
Stop Loss :- 4055
Target :- 3875
A swing trade can be initated in the stock with Target 1 as 3875 and trailing SL for next target upto 3780.
Target 2 can also be made with the help of the 50 EMA.
In case price tries to form a new high is can be shorted only when there is some negative sentiment and price action in the stock.
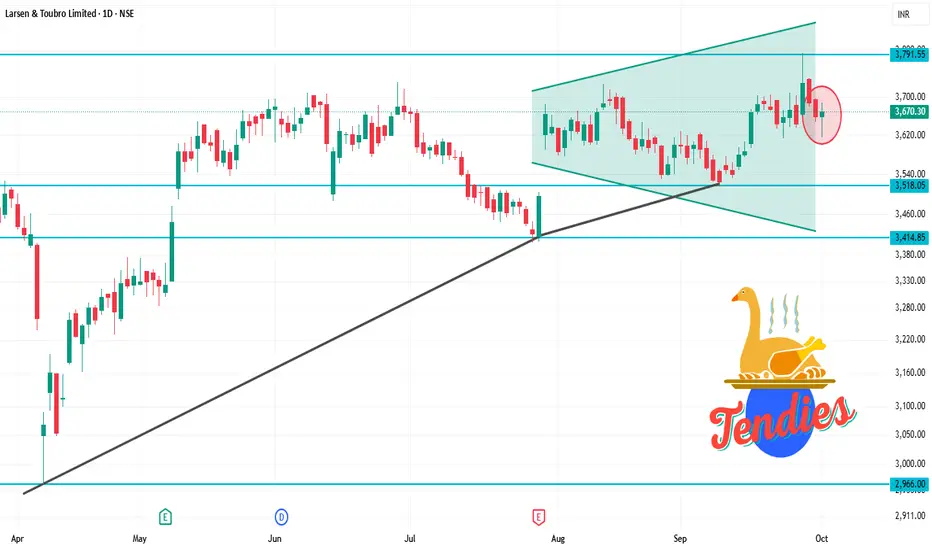
LT 1D Time frameCurrent Snapshot
Current Price: ₹3,670.30
52-Week High: ₹3,963.50
52-Week Low: ₹2,965.30
Strategy & Outlook
Bullish Bias: The stock is in a short-term uptrend with positive momentum indicators.
Buying Opportunity: Consider entering near support zones (₹3,600–₹3,650) with a target towards ₹3,700–₹3,750.
Risk Management: Place stop-loss orders below the support levels to manage potential downside risks.
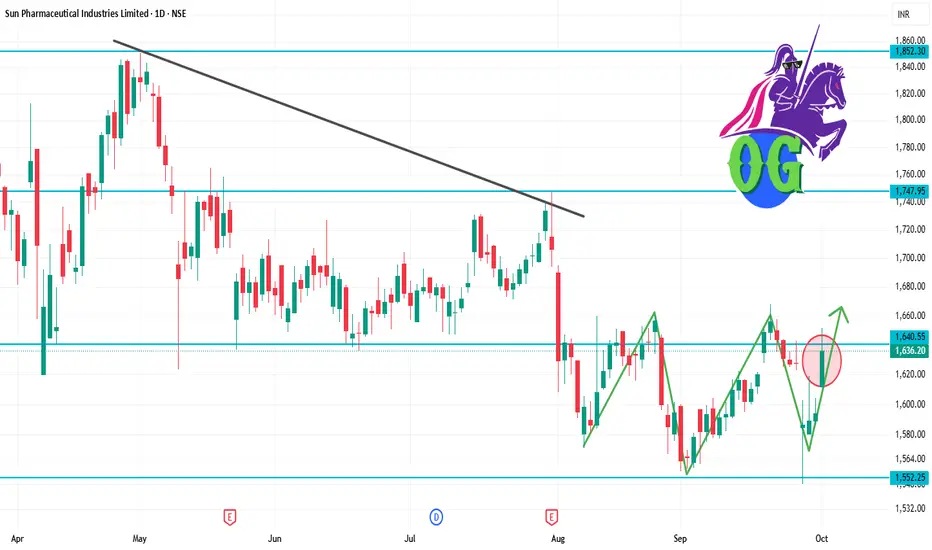
SUNPHARMA 1D Time frameCurrent Snapshot
Current Price: ₹1,636.20
52-Week High: ₹1,952.25
52-Week Low: ₹1,548.00
Strategy & Outlook
Bullish Bias: The stock is in a short-term uptrend with positive momentum indicators.
Buying Opportunity: Consider entering near support zones (₹1,600–₹1,610) with a target towards ₹1,650–₹1,670.
Risk Management: Place stop-loss orders below the support levels to manage potential downside risks.
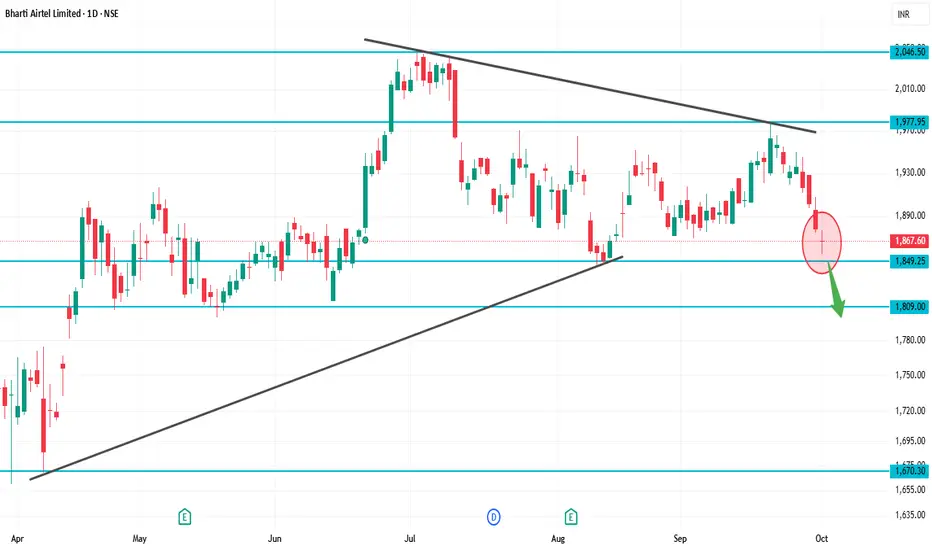
BHARTIARTL 1D Time frameCurrent Price: ~₹1,867
52-Week High: ~₹2,045
52-Week Low: ~₹1,511
Explanation
At ₹1,867, Airtel is just above immediate support (₹1,840–1,850).
If buyers hold this support, stock may bounce back toward ₹1,900+.
But if ₹1,840 breaks, then downside may open toward ₹1,800–1,750.
For bulls, a clean breakout above ₹1,920–2,000 is needed for fresh rally.
BRITANNIA 1D Time frameCurrent Price: ~₹5,953.50
Day’s Range: ₹5,939.50 – ₹6,036.00
52-Week Range: ₹4,506.00 – ₹6,469.90
📏 Key Levels
Immediate Resistance: ~₹6,300
Next Resistance: ~₹6,470 (52-week high)
Immediate Support: ~₹5,800
Next Supports: ~₹5,600 and ₹5,300
🧠 Insights
If Britannia breaks above ₹6,300 with volume, it may push toward ₹6,470+ (new highs).
If it fails to break resistance, expect sideways movement or a pullback toward ₹5,800.
A break below ₹5,800 would signal weakness and can drag it down toward ₹5,600–₹5,300 levels.

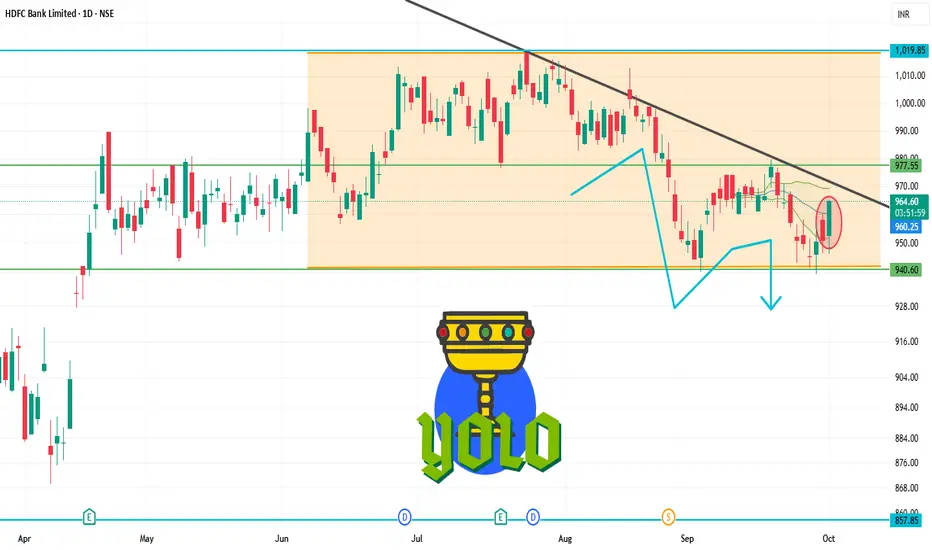
HDFCBANK 1D Time frameOpening Price: ₹950.30
Closing Price: ₹960.45
Day Range: ₹946.00 – ₹961.40
Previous Close: ₹950.30
🧠 Price Action Insights
The stock is trading below key moving averages, confirming the bearish trend.
No significant reversal pattern has formed, suggesting the downtrend may continue.
Watch for a breakout above ₹970.00 for a potential trend reversal.
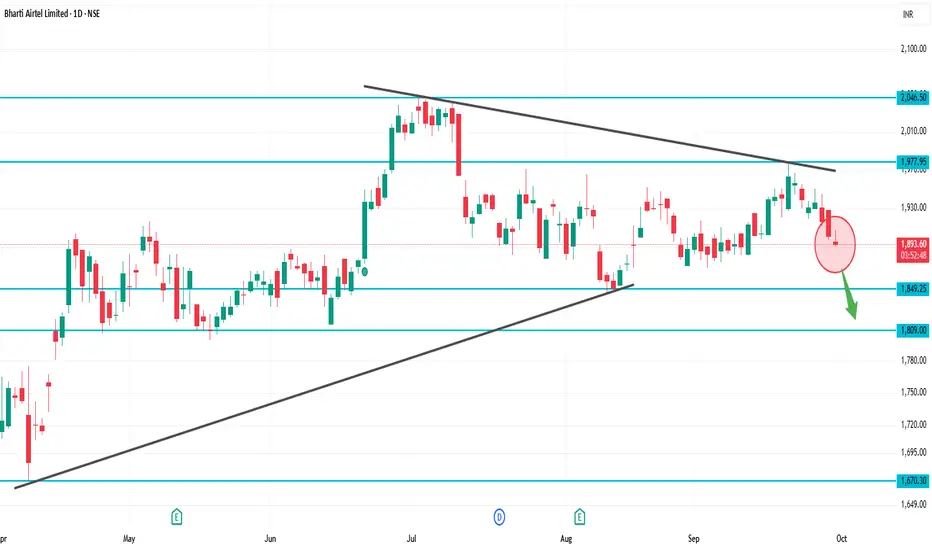
BHARTIARTL 1D Time frameCurrent Price Snapshot
Current Price: ₹1,897.80
Day’s Range: ₹1,890.80 – ₹1,907.60
52-Week Range: ₹1,511.00 – ₹2,045.80
Technical Indicators
RSI (14-day): 44.19 — indicates a neutral to slightly bearish momentum.
MACD: -4.010 — suggests bearish momentum.
Moving Averages:
5-day: ₹1,896.00 — indicates a Sell signal.
50-day: ₹1,890.00 — indicates a Sell signal.
200-day: ₹1,850.00 — indicates a Buy signal.
Technical Summary: Predominantly Sell signals across various indicators.
Summary
Above ₹1,907.60: Potential rise toward ₹1,920 – ₹1,940.
Below ₹1,890.80: Potential fall toward ₹1,880 – ₹1,860.
Between ₹1,860 – ₹1,900: Likely range-bound movement.
KOTAKBANK 1D Time frameCurrent Price Snapshot
Current Price: ₹1,991.60
Day’s Range: ₹1,990.50 – ₹2,015.00
52-Week Range: ₹1,679.05 – ₹2,301.90
Technical Indicators
RSI (14-day): 46.61 — indicates a neutral momentum.
MACD: -7.62 — suggests bearish momentum.
Moving Averages: Mixed signals — short-term averages are bearish, while long-term averages are bullish.
Technical Summary: Predominantly Sell signals across various indicators.
Summary
Above ₹2,015: Potential rise toward ₹2,050 – ₹2,100.
Below ₹1,990: Potential fall toward ₹1,950 – ₹1,900.
Between ₹1,950 – ₹2,010: Likely range-bound movement.

BAJFINANCE 1D Time frameCurrent Price Snapshot
Current Price: ₹999.00
Day’s Range: ₹989.45 – ₹1,002.30
52-Week Range: ₹645.10 – ₹1,036.00
Technical Indicators
RSI (14-day): 59.37 — indicates a neutral to slightly bullish momentum.
MACD: -4.010 — suggests bearish momentum.
Moving Averages: Mixed signals — short-term averages are bearish, while long-term averages are bullish.
Technical Summary: Predominantly Buy signals across various indicators.
Summary
Above ₹1,002.30: Potential rise toward ₹1,020 – ₹1,030.
Below ₹989.45: Potential fall toward ₹980 – ₹970.
Between ₹980 – ₹1,010: Likely range-bound movement.
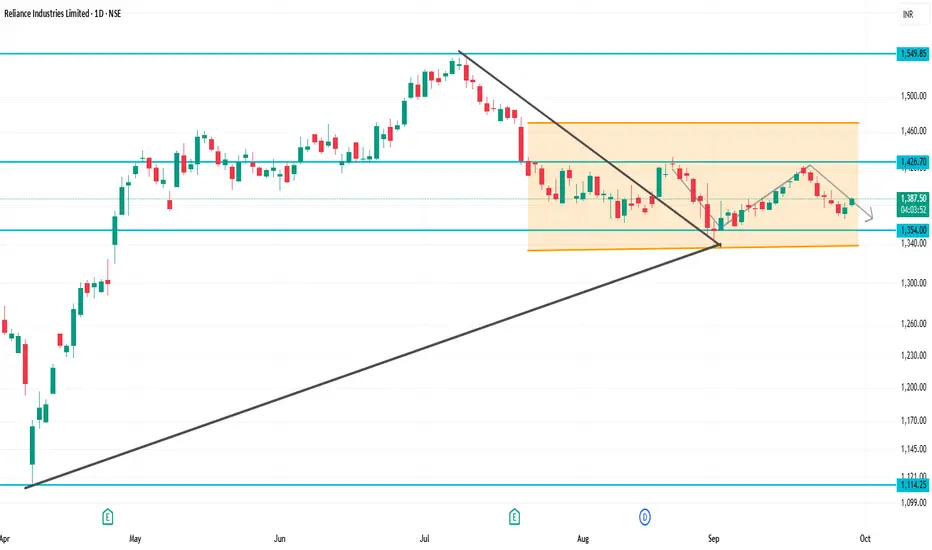
RELIANCE 1D Time frameCurrent Market Snapshot
Current Price: ₹1,383.30
Opening Price: ₹1,381.60
Day’s Range: ₹1,379.00 – ₹1,386.90
Previous Close: ₹1,377.60
🔑 Technical Indicators
Relative Strength Index (RSI): 49.76 – indicating a neutral condition.
Moving Average Convergence Divergence (MACD): -3.20 – suggesting bearish momentum.
Moving Averages: Mixed signals; trading slightly below the 50-day and 200-day moving averages, indicating a neutral to bearish trend.
📈 Key Support & Resistance Levels
Immediate Support: ₹1,379
Immediate Resistance: ₹1,387
Pivot Point: ₹1,383
📉 Market Sentiment
Recent Performance: Reliance Industries experienced a decline of 0.82% on September 25, 2025, underperforming the broader market.
Volume: Trading volume is higher than average, suggesting increased investor activity.
📈 Strategy (1D Timeframe)
1. Bullish Scenario
Entry: Above ₹1,387
Stop-Loss: ₹1,379
Target: ₹1,395 → ₹1,400
2. Bearish Scenario
Entry: Below ₹1,379
Stop-Loss: ₹1,387
Target: ₹1,370 → ₹1,365
⚠️ Risk Management
Limit risk to 1% of capital per trade.
Always use stop-loss to protect against unexpected market movements.
Monitor broader market trends and sector-specific news that may impact stock performance.
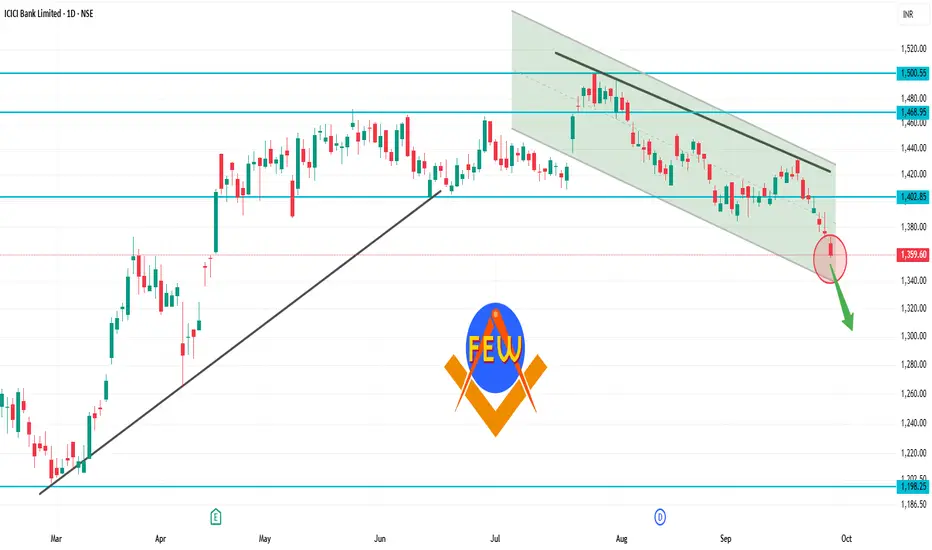
ICICIBANK 1D Time frameClosing Price: ₹1,363.00
Day's Range: ₹1,357.00 – ₹1,372.70
Previous Close: ₹1,375.80
Volume: 18,342,280 shares traded
Market Cap: ₹971,186 crore
52-Week High: ₹1,500.00
52-Week Low: ₹1,186.00
Face Value: ₹2.00
Beta: 0.90
🧾 Financial Highlights
P/E Ratio (TTM): 18.36
P/B Ratio: 3.12
EPS (TTM): ₹74.04
Dividend Yield: 0.81%
ROE: 17.05%
Book Value: ₹436.56
📈 Technical Insights
Trend: The stock is approaching its 200-day moving average, a key technical indicator. A bounce from this level could signal a buying opportunity, while a breakdown may suggest further downside risk.
Support Levels: ₹1,357.00, ₹1,350.00
Resistance Levels: ₹1,375.00, ₹1,400.00
📌 Key Takeaways
Recent Performance: ICICI Bank's stock declined by 0.91%, underperforming the broader market.
Analyst Sentiment: Despite recent volatility, ICICI Bank remains a top pick among analysts for long-term investment.
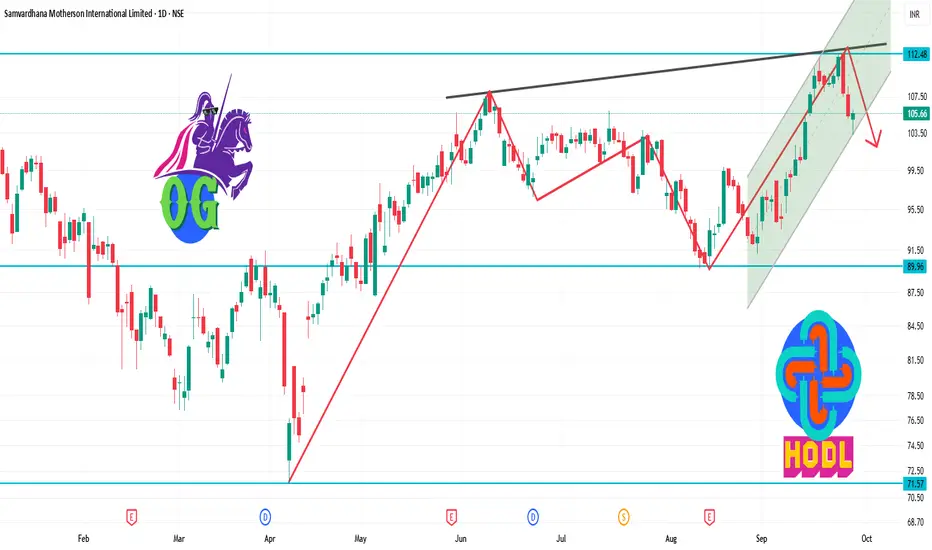
MOTHERSON 1D Time frameStock Snapshot
Closing Price: ₹105.66
Day's Range: ₹103.26 – ₹106.01
52-Week Range: ₹71.50 – ₹144.66
Market Cap: ₹1,11,518 crore
P/E Ratio (TTM): 33.54
P/B Ratio: 3.20
Dividend Yield: 0.80%
Book Value: ₹33.05
Beta: 1.64
Volume: 24,534,407 shares traded
VWAP: ₹104.93
Face Value: ₹1.00
📈 Performance Overview
1-Week Return: -3.14%
1-Month Return: +13.27%
YTD Return: +22.73%
1-Year Return: -11.16%
3-Year Return: +28.45%
5-Year Return: 0.00%
🧾 Financial Highlights
TTM EPS: ₹3.15
Net Sales (Latest Four Quarters): ₹9,271.58 crore
Net Profit (Latest Four Quarters): ₹605.86 crore
Shareholder's Funds: ₹1,676.80 crore
Total Assets: ₹3,089.00 crore
🔍 Technical Insights
Trend: Currently in a downtrend; price below VWAP indicates bearish momentum.
Support Levels: ₹103.26, ₹100.00
Resistance Levels: ₹106.01, ₹110.00
📌 Key Takeaways
Dividend: 50% (₹0.50 per share)
Bonus Issue: 1:2 ratio
Market Position: Strong over 3 years despite short-term volatility
Analyst Sentiment: Positive overall, short-term corrections possible
SENSEX 1D Time frameCurrent Snapshot
Closing / Current Level: ~ ₹ 80,426.46
Day’s Range: High ~ ₹ 81,033, Low ~ ₹ 80,332
Open: ~ ₹ 80,956
⚡ Strategy Thoughts
Bullish approach:
If it recovers above ~80,700 and holds, targets can be 81,000 → 81,300.
Bearish / defensive view:
If Sensex fails near 80,700–81,000, or breaks below ~80,300, downside toward 79,800 and lower comes into play.
Range play:
Between 80,300 and 80,700, you can trade both sides — buy near the bottom of the range, short near resistance — but use tight stops.

NIFTY 1D Time framePrevious Close: 24,889
Today Open: 24,819
Day’s High: 24,869
Day’s Low: 24,629
Current / Last Price: around 24,655
⚡ Strategy
Bullish Plan:
Buy near 24,550 – 24,600 with SL below 24,300.
Targets: 24,700 → 24,800 → 24,900.
Bearish Plan:
If price breaks below 24,300, expect weakness toward 24,100 – 24,000.
LT 1D Time frameClosing Price: ₹3,644.40
Day’s Range: ₹3,635.70 – ₹3,704.00
Previous Close: ₹3,657.60
Change: Down –0.80%
52-Week Range: ₹2,965.30 – ₹3,963.50
Market Cap: ₹5.13 lakh crore
P/E Ratio (TTM): 32.31
Dividend Yield: 0.93%
EPS (TTM): ₹112.81
Beta: 1.20 (indicating moderate volatility)
🔑 Key Technical Levels
Immediate Support: ₹3,635 – ₹3,640
Immediate Resistance: ₹3,700 – ₹3,710
52-Week High: ₹3,963.50
52-Week Low: ₹2,965.30
📈 Technical Indicators
RSI (14-day): 45.2 – indicating a neutral condition.
MACD: Negative, suggesting bearish momentum.
Moving Averages: Trading below the 50-day and 200-day moving averages, indicating a bearish trend.
📉 Market Sentiment
Recent Performance: L&T experienced a decline of 0.80% on September 25, 2025, underperforming the broader market.
Volume: Trading volume was significantly higher than its 20-day average, indicating increased investor activity.
📈 Strategy (1D Timeframe)
1. Bullish Scenario
Entry: Above ₹3,700
Stop-Loss: ₹3,635
Target: ₹3,750 → ₹3,800
2. Bearish Scenario
Entry: Below ₹3,635
Stop-Loss: ₹3,700
Target: ₹3,600 → ₹3,550

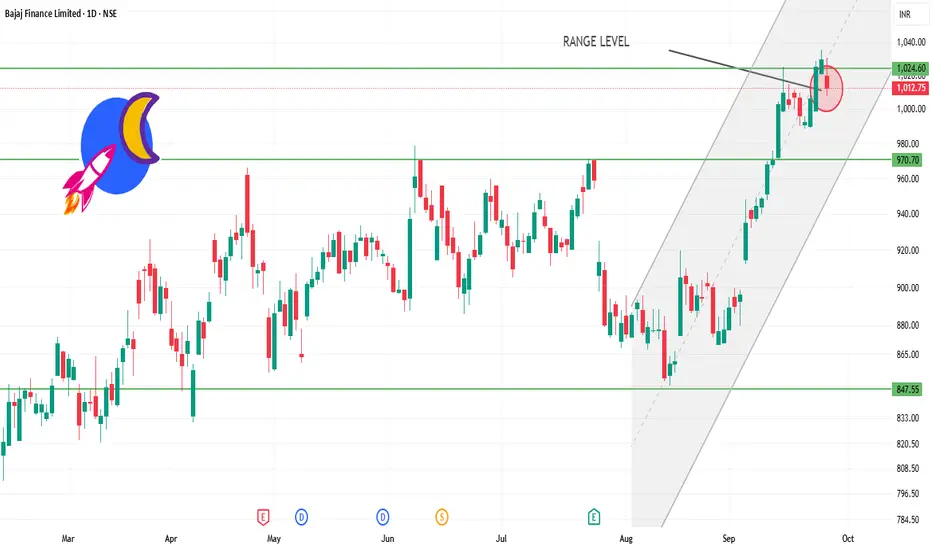
BAJFINANCE 1D time frame📊 Daily Snapshot
Closing Price: ₹1,012.75
Day’s Range: ₹1,008.00 – ₹1,031.10
Previous Close: ₹1,029.75
Change: Down –1.66%
52‑Week Range: ₹645.10 – ₹1,036.00
Market Cap: ₹6.31 lakh crore
P/E Ratio: 36.2
Dividend Yield: 2.76%
EPS (TTM): ₹28.04
Beta: 1.14 (indicating moderate volatility)
🔑 Key Technical Levels
Support Zone: ₹1,008.00 – ₹1,015.00
Resistance Zone: ₹1,031.00 – ₹1,036.00
All-Time High: ₹1,036.00
📈 Technical Indicators
RSI (14-day): 42.88 – approaching oversold territory, suggesting potential for a rebound.
MACD: Positive at 2.46, indicating bullish momentum.
Moving Averages: Trading above the 50-day and 200-day moving averages, indicating an overall uptrend.
📉 Market Sentiment
Recent Performance: Bajaj Finance experienced a decline of 1.66% on September 25, 2025, underperforming the broader market.
Volume: Trading volume was significantly higher than its 50-day average, indicating increased investor activity.
📈 Strategy (1D Timeframe)
1. Bullish Scenario
Entry: Above ₹1,031.00
Stop-Loss: ₹1,008.00
Target: ₹1,045.00 → ₹1,050.00
2. Bearish Scenario
Entry: Below ₹1,008.00
Stop-Loss: ₹1,015.00
Target: ₹995.00 → ₹990.00
SBIN 1D Time frame📊 Daily Snapshot
Closing Price: ₹861.15
Day’s Range: ₹859.95 – ₹870.15
Previous Close: ₹866.20
Change: Down –0.59%
52-Week Range: ₹680.00 – ₹880.50
Market Cap: ₹794,895 crore
P/E Ratio: 10.01
Dividend Yield: 1.85%
EPS (TTM): ₹86.06
Beta: 1.00 (indicating average market volatility)
🔑 Key Technical Levels
Support Zones: ₹860.00 – ₹854.00 – ₹844.00
Resistance Zones: ₹876.00 – ₹886.00 – ₹892.00
All-Time High: ₹912.00
Fibonacci Pivot Point: ₹865.68
📈 Strategy (1D Timeframe)
1. Bullish Scenario
Entry: Above ₹876.00
Stop-Loss: ₹859.00
Target: ₹886.00 → ₹892.00
2. Bearish Scenario
Entry: Below ₹859.00
Stop-Loss: ₹866.00
Target: ₹854.00 → ₹844.00

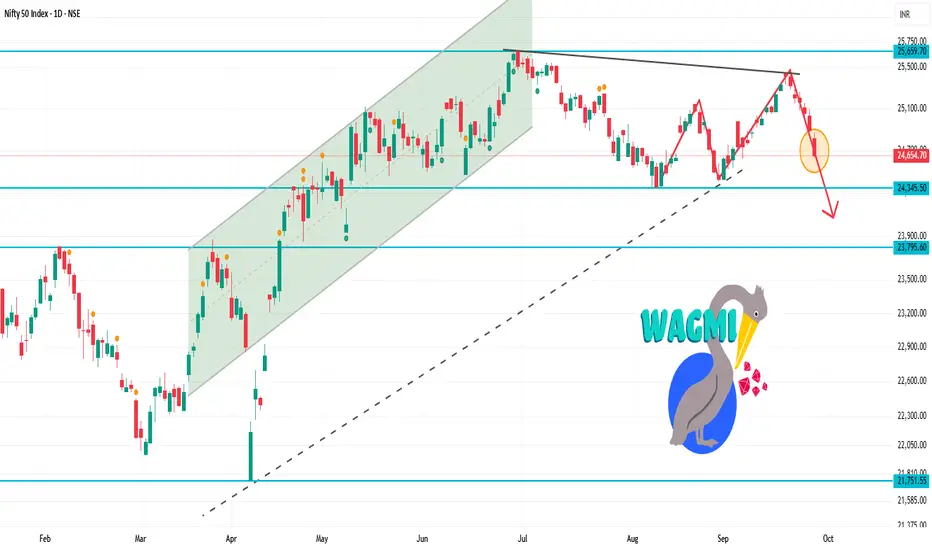
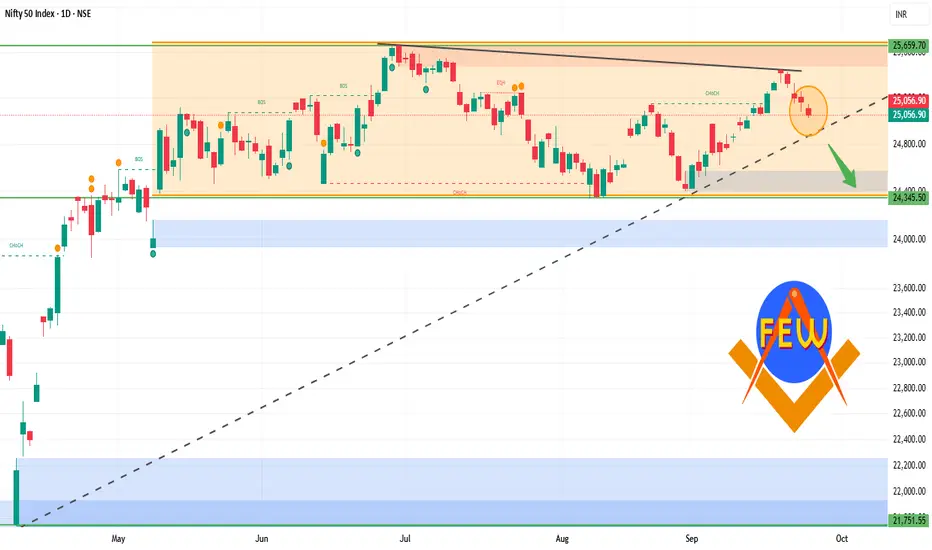
NIFTY 1D Time frame📊 Today’s Nifty Performance
Opening: Around 25,109
Closing: Around 25,057
Result: Market slipped about –52 points (–0.45%)
Range: High near 25,150, Low near 25,027
👉 If you were long (buy side) from the open and held till close → small loss (~52 points).
👉 If you were short (sell side) from the open and held till close → small profit (~52 points).
🎯 Key Levels
Support Zone: 25,000 – 25,020
Resistance Zone: 25,130 – 25,150
📝 Strategy
For Intraday Traders
Sell near resistance (25,130–25,150) with stop-loss just above 25,160.
Buy near support (25,000–25,020) with stop-loss just below 24,980.
For Swing Traders (2–3 days)
If Nifty sustains above 25,150, expect bounce toward 25,250+.
If Nifty breaks below 25,000, expect fall toward 24,900.
Risk Management
Use stop-loss always.
Don’t risk more than 1% of your capital on one trade.
Trail stop-loss if trade goes in your favor.
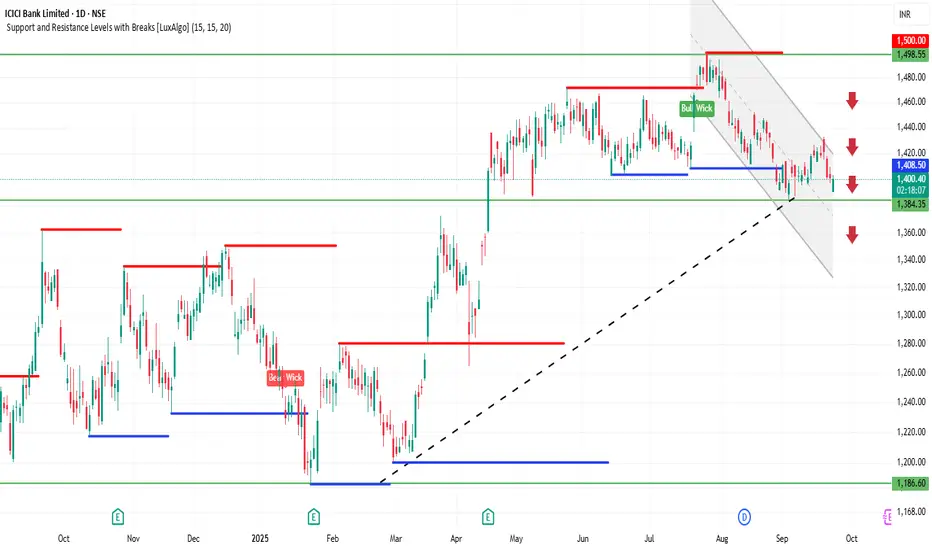
ICICIBANK 1D Time frame📍 Today’s Expected Range (Intraday Approximation)
Expected High: ₹1,403–₹1,410
Expected Low: ₹1,391–₹1,385
These are approximate intraday levels. Actual prices may fluctuate slightly due to market volatility.
🔍 Key Points
Current price: ₹1,400–₹1,401, close to resistance.
If price breaks above ₹1,410 with strong volume → bullish momentum likely.
If price drops below ₹1,385 → short-term correction or pullback possible.
📊 Suggested Trading Strategy
Bullish Scenario
If ICICI Bank breaks ₹1,403–₹1,410, you can buy, targeting ₹1,420–₹1,430.
Stop-loss: ₹1,395
Bearish Scenario
If ICICI Bank drops below ₹1,385, you can sell/short, targeting ₹1,375–₹1,370.
Stop-loss: ₹1,390
Range-Bound / Sideways
If price trades between ₹1,385–₹1,403, it’s better to wait and avoid trading until a clear breakout occurs.
💡 Summary
Resistance Zone: ₹1,403–₹1,410
Support Zone: ₹1,385–₹1,391
Strategy: Trade in the direction of the breakout, and always use stop-loss to manage risk.
ADANIENT 1D Time frame📍 Today’s Expected Range (Intraday Approximation)
Expected High: ₹2,686–₹2,700
Expected Low: ₹2,640–₹2,650
These levels are approximate intraday zones. Volatility may cause small deviations.
🔍 Key Points
Current price: ₹2,675, right between support and resistance.
If the price breaks above ₹2,700 with strong buying → bullish momentum likely.
If the price falls below ₹2,640 → potential pullback or short-term correction.
📊 Trading Strategy for Today
Bullish Scenario:
If price breaks ₹2,680–₹2,700, you can buy, targeting ₹2,720–₹2,750.
Stop-loss: Below ₹2,665
Bearish Scenario:
If price falls below ₹2,640, you can sell/short, targeting ₹2,620–₹2,600.
Stop-loss: Above ₹2,655
Range-Bound / Sideways:
If price stays between ₹2,640–₹2,680, it’s better to wait and avoid trading until a clear breakout happens.
💡 Summary:
Resistance zone: ₹2,680–₹2,700
Support zone: ₹2,640–₹2,650
Strategy: Trade in the direction of the breakout and always use stop-loss.

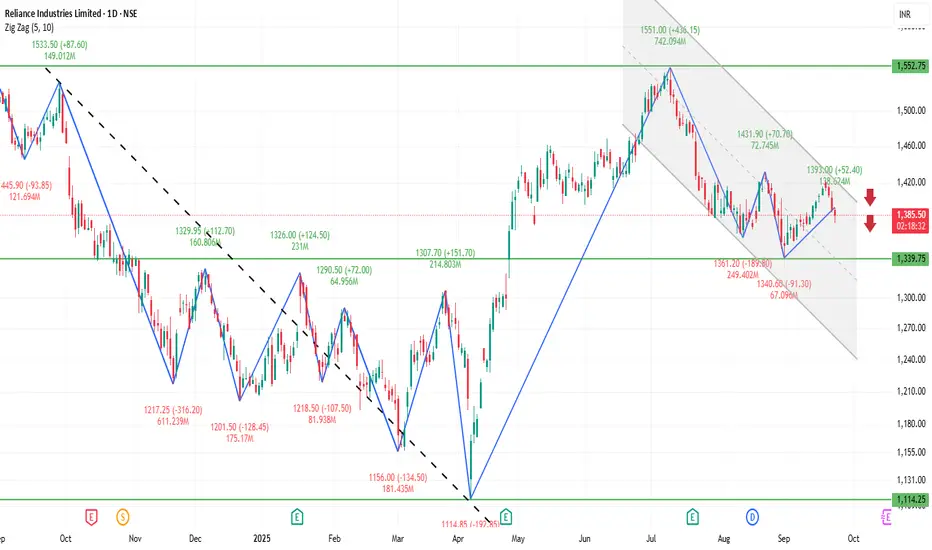
RELIANCE 1D Time frame📍 Current Price Context
Trading around ₹1,386
Price is near a resistance zone → important level to watch.
🔍 Key Levels
Immediate resistance: ₹1,380–₹1,390 (current zone)
Next resistance: ₹1,420–₹1,450 (if breakout happens)
Immediate support: ₹1,350–₹1,360
Stronger support: ₹1,320–₹1,330
📊 Indicators & Trend
Price is just below resistance, so breakout or rejection will decide the move.
RSI near neutral → neither overbought nor oversold.
Structure looks range-bound, but slightly bullish as long as it holds above ₹1,350.
🔮 Possible Scenarios
Bullish breakout → If Reliance sustains above ₹1,390–₹1,400 with volume, next upside target is ₹1,420–₹1,450.
Sideways move → May trade between ₹1,350–₹1,390 until momentum builds.
Bearish pullback → If it fails at resistance, price could slip toward ₹1,350, and if broken, then ₹1,320.
👉 At the current level (₹1,386), Reliance is at a decisive zone. Breakout above ₹1,390 will be bullish, while rejection could send it back to supports.
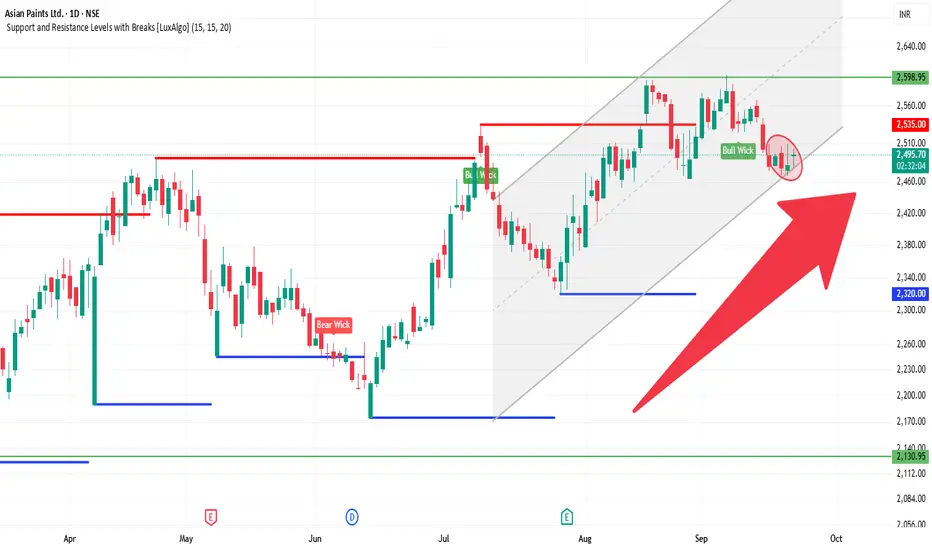
ASIANPAINT 1D Time frame🔍 Current Status
The stock is trading around ₹2,490 – ₹2,500
Recent price action has been somewhat mixed — not a strong trend, some resistance in higher zones.
🧮 Trade Strategy Ideas
Long Setup:
If price holds above ~₹2,460 and shows reversal candlestick or volume strength.
Target resistance around ₹2,505-₹2,528.
Stop-loss could be placed just below ₹2,440 or so (to protect against breakdowns).
Short / Pullback Setup:
If price gets rejected near resistance around ₹2,505-₹2,528 and bearish candlestick forms.
Potential downside toward ~₹2,460 first, then further to ~₹2,420.
Breakout Setup:
If price breaks above ~₹2,528 with good volume, could aim for ~₹2,546 or higher.
Must confirm with strength / follow-through.
✅ Summary: Asian Paints is in a consolidation / neutral phase. Key to watch is how it reacts around the resistance zone ~₹2,505-₹2,528. Holding above support ~₹2,460 is important. A clear breakout gives upside, else downside risk remains.