Larsentoubro


LT (Bullish WW)Point5 of wolfe wave is forming around a good supply zone. Bullish outlook for coming days. Enter based on price action around the zone

LT opening above resistanceThe order that it received for the bullet trains has resulted in an opening above the resistance. New way upwards.

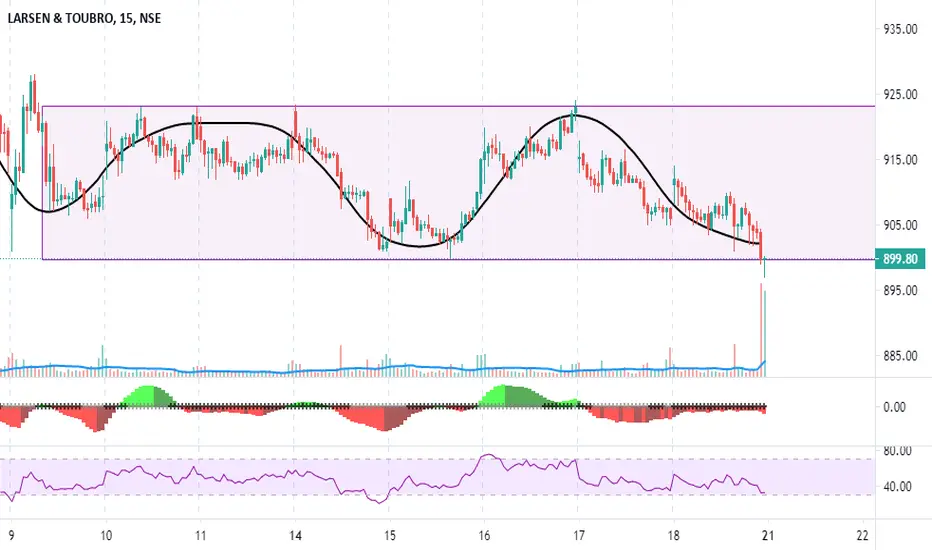
LT - Buy or sell at breakouts (Intraday 20/10/2020)LT is swinging in a particular range marked in Orange.
For Intraday buy above last candle high 906.
1st target - 908 (near upper resistance line)
2nd target - 910
3rd target - around 914/915
Sell below 901
1st target - 898.5
2nd target - 892 (It's a strong support)
3rd target - 885
*This is based on my analysis just for the educational purpose.

Larsen & Toubro (LT)CMP - INR 908
BUY Above - INR 900
SL - 895
Target 1 - 924
Target 2 - 935+
R:R - 1:4


LT has broken resistance on daily chartsLT has broken resistance on daily charts on open. Slipped post open. This could be an entry opportunity from here.
Buy@913. Target@933. SL@890.

L&T buy above 919, targets 958-990, s.loss 894.trade with caution, preferably using a risk defined strategy.
follow due deligince.

#Oct12 - LT (intraday+swing)The stock has been continuously testing the resistance at 915. Last day too the resistance was respected, but since the stock is highly bullish, there is chance for the breakout to happen. The bullishness will be confirmed if the resistance is broken. This is an intraday as well as swing pick from my side.
Buy above 915
Note:
Avoid the stock if a big gap up or gap down is seen
Enter after the breakout happens and not before it
Do not chase the market, i.e., do not get involved in late entries
Only enter with strict stop-loss and target
This is not a recommendation and is for educational purposes only.
always follow risk-reward and quantity management for the 100% of the times
The above mentioned idea may not work, so beware of the risk you are taking


Go long L_TFH expect 3-4 rs per shareGo long L_TFH expect 3-4 rs per share if market supports could give big momentum. It is in uptrend could give satisfying results
Additional conformation inside candle pattern in 30 min candle time frame :
Trade with your own risk
Sl at 63.60 which is todays support
Target when macd indication shows to sell watch only 30 min candle

LT Taking Support LT Taking Support at 900. Long here and SL close range below 900 levels(Positional)

Long LT above 921Hi Traders, go long on LT above 921 if a strong candle breaches 921.
LT can take a good upmove in short term, if a large candle breaches 921 level (a confirmation).
Entry price: 921-924.
Target: 955-966.

Larsen & Toubro will elevate or fall more!! See yourself here!! Disclaimer: Don't just blindly Trade or Invest, learn and then trade. Manage your risks properly.
This analysis is purely for EDUCATIONAL purpose, just to give an idea on the price movements!!
RSI is weak but from here it might take a short term pullback till the levels mentioned above.
L&T is a stock for long term investment and getting a cheaper price now so those who want this in your portfolio can add small small quantities for long term.
If you earn from my ideas, kindly consider donating small part of your profits to those in need.
Thank You.

EXPECTING DOWNSIDE BREAKOUT IN LT SOON ? GO SHORT ?LT IS CURRENTLY TRADING IN ITS VERY CRUCIAL SUPPORT AREA.
MOST OF THE PEOPLE BELIVES IT WILL REVERT FROM THIS SUPPORT AND THERFORE ONE SHOULD GO LONG.
BUT AS PER MY VIEW IF STOCK IS HOVERING AT A PARTICULAR PRICE IN THIS PARTICULAR CASE AROUND 895-905 THEN IT'S SURE THAT SOMETHING IS COOKING AND WE SHOULD BE CAUTIOUS. (MIGHT BE PEOPLE WERE RIGHT ABOVE GOING LONG)
BUT I AM PREDICTING THAT LT WILL SOON BREAK THIS SUPPORT AS SMART MONEY IS MOVING OUT OF THE STOCK ANS ITS LOSING ITS CHARM UNTIL NOW ATLEAST FOR ME :)
KEEPING IN THIS MIND ENTER SHORT IN LT IF MOVES BELOW 895 KEEPING SL AOROUND 920 AND TARGEST OF 20-40-80-160+ POINTS FROM HERE.

L&T is Making Rectangle Channel Pattern (Breakout Trade)Larsen & Toubro Limited : Construction Engineering Company ( NSE:LT ) is Making Rectangle Channel Pattern (PATTERN BREAKOUT TRADE).
This can become a very good trade for INTRADAY traders.
Target + StopLoss: There is no target here. You keep the first target as much as the StopLoss you put. And the StopLoss will be the Low/High of the candle that broke this pattern. Or Low/High swing backward inside the pattern.
And as soon as you get a profit of 0.50% of your target, you will trail your StopLoss and bring it to the entry point. And as soon as your first target is hit, you will release half of your total quantity and continue to trail your StopLoss above the last swing Low/High.
Target and StopLoss are never already fixed in the chart pattern.
Thank you.
You always have to trade only by money management, position sizing, StopLoss trailing. This is the way to stay in profit.
Chart Published By Ravinder Sharma


LT (Bullish Wolfe Wave)LT is at a very important zone... Any bounce from here can give a great short covering. Bullish WW in sight too.


Swing in LTRSI moved from 40 indicating upmove which is supported by buy signal in MACD.
Price Acttion shows reversal but the movement of 200 EMA suggests that price may face resistance once it reaches that level.
Anyway, it looks good for swing with a price range of 950-960 being the target and stoploss being below the channel.
