SENSEX 1D Time frame Current Status
Trading around 81,904 points
Showing steady upward move in recent se
Key Levels
Support: 81,600 → 81,400 → 81,000
Resistance: 82,000 → 82,400 → 83,000
Outlook
As long as Sensex holds above 81,400–81,600, trend remains positive. Break above 82,000–82,400 can lead toward higher levels, while falling below 81,000 may trigger correction.
Larsentoubro

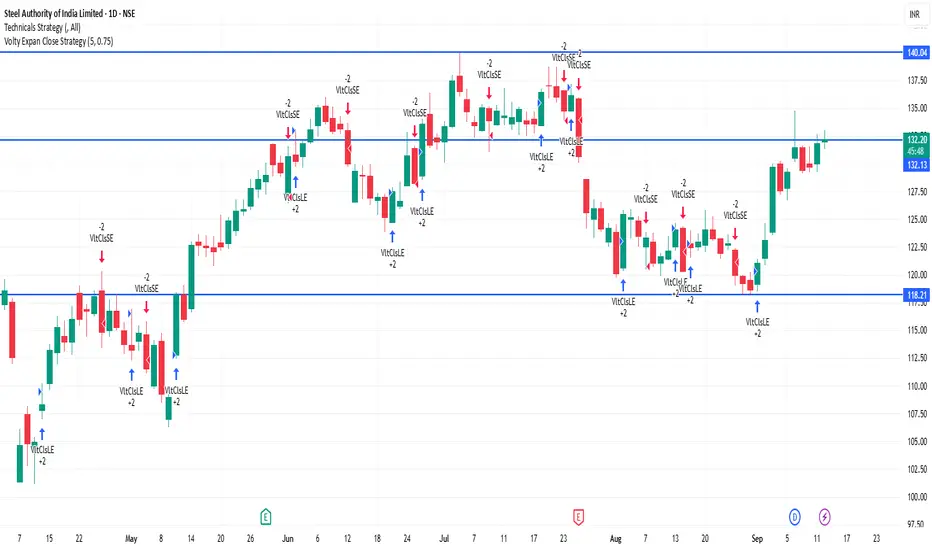
SAIL 1D Time frame🔢 Current Level
Trading around ₹132.28
🔑 Key Resistance & Support Levels
Resistance Zones:
₹133.00 – ₹134.00 (near-term resistance; breakout above this may lead to further upside)
₹135.00 – ₹136.00 (stronger resistance above)
Support Zones:
₹131.50 – ₹132.00 (immediate support; failure to hold above this may lead to a decline)
₹130.00 – ₹130.50 (short-term support; a break below this could indicate weakness)
₹128.00 – ₹129.00 (deeper support zone if price dips further)
📉 Outlook
Bullish Scenario: If SAIL holds above ₹132.00, upward momentum may continue. Break above ₹134.00 can open the way toward ₹135.00+.
Bearish Scenario: If it falls below ₹130.00, risk increases toward ₹128.00 – ₹129.00.
Neutral / Range: Between ₹132.00 – ₹134.00, SAIL may consolidate before a directional move.
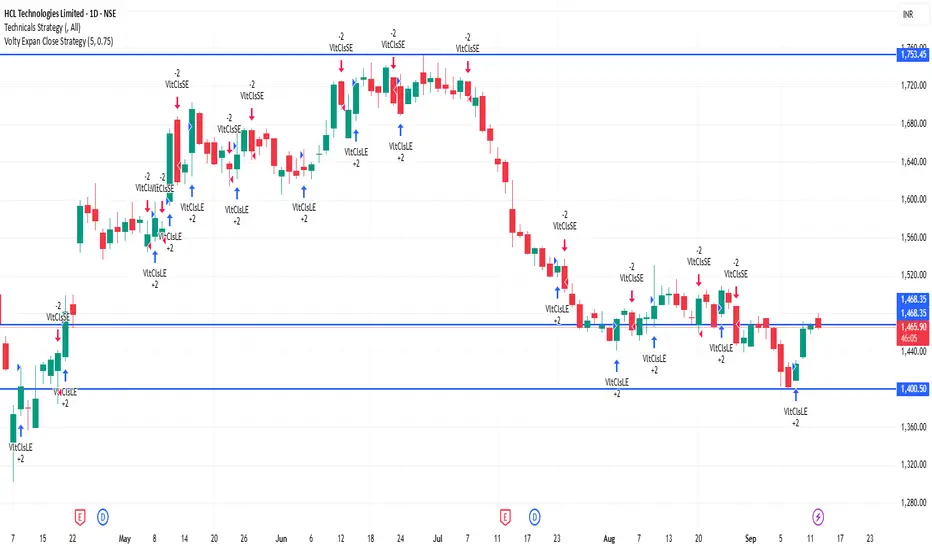
HCLTECH 1D Time frame🔢 Current Level
Trading around ₹1,465.80 - ₹1,467.80
🔑 Key Resistance & Support Levels
Resistance Zones:
₹1,472 – ₹1,475 (recent highs; breakout above this may lead to further upside)
₹1,485 – ₹1,490 (stronger resistance above)
Support Zones:
₹1,460 – ₹1,463 (immediate support; failure to hold above this may lead to a decline)
₹1,450 – ₹1,453 (short-term support; a break below this could indicate weakness)
₹1,440 – ₹1,445 (deeper support zone if price dips further)
📉 Outlook
Bullish Scenario: If HCL Technologies holds above ₹1,463, upward momentum may continue. Break above ₹1,475 can open the way toward ₹1,485+.
Bearish Scenario: If it falls below ₹1,440, risk increases toward ₹1,430 – ₹1,445.
Neutral / Range: Between ₹1,463 – ₹1,475, HCL Technologies may consolidate before a directional move.
HDFCBANK 1D Time frame🔢 Current Level
Trading around ₹966 – ₹968
🔑 Key Resistance & Support Levels
Resistance Zones:
₹970 – ₹975 (near-term resistance; breakout above this may lead to further upside)
₹980 (psychological resistance)
₹1,000 (stronger resistance above)
Support Zones:
₹960 – ₹962 (immediate support; failure to hold above this may lead to a decline)
₹950 (short-term support; a break below this could indicate weakness)
₹940 – ₹945 (deeper support zone if price dips further)
📉 Outlook
Bullish Scenario: If HDFCBANK holds above ₹962, upward momentum may continue. Break above ₹975 can open the way toward ₹980+.
Bearish Scenario: If it falls below ₹950, risk increases toward ₹940 – ₹945.
Neutral / Range: Between ₹962 – ₹975, HDFCBANK may consolidate before a directional move.

KOTAKBANK 1D Time frame📊 Price Action
Previous Close: ₹1,973.30
Day’s Range: ₹1,963.30 – ₹1,985.00
Volume: 1,694,935 shares
VWAP: ₹1,975.06
52-Week Range: ₹1,679.05 – ₹2,301.90
🔧 Technical Indicators
RSI (14): 55.59 — Indicates neutral to bullish momentum.
MACD: 5.67 — Suggests a positive trend.
ADX (14): 37.42 — Confirms a strong trend.
Stochastic RSI: 18.53 — Indicates oversold conditions.
CCI (14): 50.23 — Neutral, with potential for upward movement.
Ultimate Oscillator: 58.25 — Signals bullish momentum.
Rate of Change (ROC): 0.72 — Positive, indicating upward price movement.
Williams %R: -54.58 — Neutral, neither overbought nor oversold.
Bull/Bear Power (13): 13.35 — Indicates buying pressure.
📈 Moving Averages
MA5: ₹1,976.44 — Sell signal.
MA10: ₹1,973.57 — Buy signal.
MA20: ₹1,968.21 — Buy signal.
MA50: ₹1,956.95 — Buy signal.
MA100: ₹1,964.72 — Buy signal.
MA200: ₹1,979.20 — Sell signal.
Summary: Out of 12 moving averages, 8 indicate a buy signal, and 4 indicate a sell signal, suggesting a generally bullish trend.
📌 Support & Resistance Levels
Immediate Support: ₹1,963
Immediate Resistance: ₹1,985
🧠 Trend Analysis
Trend: Bullish
Momentum: Positive
Volatility: Moderate
Conclusion: Kotak Mahindra Bank's stock is exhibiting a bullish trend with positive momentum and moderate volatility. The technical indicators suggest potential for upward movement, with key support at ₹1,963 and resistance at ₹1,985. Traders may consider these levels for potential entry or exit points.

Options OI Trade Outlook — Bullish Setups Only________________________________________
📊 Options OI Trade Outlook — Bullish Setups Only
“This analysis is shared purely for educational purposes and market awareness — not a trading recommendation.”
(Educational Purpose | Not Financial Advice | SEBI Compliant)
Hello Traders 👋,
Here are today’s 7 Bullish Option Setups based on OI + Price Action + IV + Greeks study.
This is strictly for learning and educational purposes only.
________________________________________
🟢 1. ITC 410 CALL
LTP: 7.25
Sentiment: Bullish | Trend: Up | Strength: 5/5 (Strong)
IV: 13.3 | Delta: 0.55 | Theta: -0.20 | Vega: 0.46
Buildup: Long Build-up
Why?
410 CE shows a strong Long Build-up with price ↑ 70.6% and OI ↑ 31.2%.
Volume jumped +305.9%, confirming active participation.
Low IV makes premiums attractive. Delta 0.55 indicates higher ITM probability.
________________________________________
🟢 2. CGPOWER 700 CALL
LTP: 23.5
Sentiment: Bullish | Trend: Up | Strength: 5/5 (Strong)
IV: 30.9 | Delta: 0.52 | Theta: -0.65 | Vega: 0.79
Buildup: Long Build-up
Why?
700 CE surged +127% in price with OI ↑ 216.5% — strong long confirmation.
Volume spiked +2962%, showing aggressive buying.
IV rising (+10.3%) supports premium expansion.
________________________________________
🟢 3. COLPAL 2340 CALL
LTP: 61.7
Sentiment: Bullish | Trend: Up | Strength: 5/5 (Strong)
IV: 22.4 | Delta: 0.53 | Theta: -1.52 | Vega: 2.64
Buildup: Long Build-up
Why?
2340 CE gained +89.8% in price with OI ↑ 146.9%.
Volume surged +2357%, indicating strong trader interest.
Moderate IV gives a balanced risk-reward setup.
________________________________________
🟢 4. LT 3600 CALL
LTP: 76.25
Sentiment: Bullish | Trend: Up | Strength: 5/5 (Strong)
IV: 15.9 | Delta: 0.55 | Theta: -2.34 | Vega: 4.06
Buildup: Long Build-up
Why?
3600 CE rose +29.2% with OI ↑ 3.6%.
Volume ↑ 71%, confirming active participation.
Delta 0.55 signals higher ITM chances with bullish momentum.
________________________________________
🟢 5. BRITANNIA 5800 CALL
LTP: 172
Sentiment: Bullish | Trend: Up | Strength: 5/5 (Strong)
IV: 21.6 | Delta: 0.57 | Theta: -3.46 | Vega: 6.52
Buildup: Long Build-up
Why?
5800 CE rallied +49.6% with OI ↑ 16.5%.
Volume jumped +566%, confirming buying momentum.
IV rising (+9.4%) shows strong premium expansion potential.
________________________________________
🟢 6. ASIANPAINT 2500 CALL
LTP: 77
Sentiment: Bullish | Trend: Up | Strength: 3.9/5 (Strong)
IV: 20.8 | Delta: 0.59 | Theta: -1.40 | Vega: 2.79
Buildup: Short Covering
Why?
2500 CE benefited from short covering — price ↑ 21% while OI ↓ 21.6%.
This indicates shorts exiting, fueling bullish momentum.
Volume dipped (-15.9%), so position sizing should be careful.
________________________________________
🟢 7. DMART 4800 CALL
LTP: 101
Sentiment: Bullish | Trend: Up | Strength: 5/5 (Strong)
IV: 20.2 | Delta: 0.50 | Theta: -3.53 | Vega: 5.40
Buildup: Long Build-up
Why?
4800 CE rose +12.1% with OI ↑ 17.5% — strong long confirmation.
Volume ↑ 159.9% adds conviction.
IV easing (-6.1%) ensures better fills with controlled risk.
________________________________________
⚠️ Disclaimer – Please Read Carefully
The information shared here is meant purely for learning and awareness.
It is not a buy or sell recommendation and should not be taken as investment advice.
📌 I am not a SEBI-registered investment advisor.
📌 All views expressed are based on personal study, chart patterns, and publicly available data.
📌 Trading in stocks or options carries risk. Markets can move unexpectedly. Losses can exceed capital.
📌 Past setups do not guarantee future outcomes.
👉 Beginners: Use this for study & paper trading only.
👉 Experienced traders: Apply your own risk management & strategy filters.
👉 Always consult a SEBI-registered financial advisor before real trades.
________________________________________
💬 Found this useful?
🔼 Boost this post to help more traders learn.
✍️ Share your thoughts/setups in comments — let’s grow together.
🔁 Share with fellow traders & learners.
👉 Follow for more clean, structured breakdowns with discipline at the core.
🚀 Stay Calm. Stay Clean. Trade With Patience.
Trade Smart | Learn Zones | Be Self-Reliant 📊
________________________________________

Options Watchlist — An Educational View of OI & Price Action________________________________________
📊 Options OI Trade Outlook — Bearish Setups Only
“This analysis is shared purely for educational purposes and market awareness — not a trading recommendation.”
(Educational Purpose | Not Financial Advice | SEBI Compliant)
Hello Traders 👋,
Here are 4 Bearish option setups based on today’s OI + Price Action + IV + Greeks study.
This is strictly for learning and educational purposes.
________________________________________
🔴 1. TCS 3200 PUT
LTP: 118.15
Sentiment: Bearish | Trend: Down | Strength: 5/5 (Strong)
IV: 17.7 | Delta: -0.63 | Theta: -0.93 | Vega: 3.5
Buildup: Long Build-up
Why?
3200 PE shows a Long Build-up with price up 40.4% and OI up 33.6%, confirming strong bearish positioning.
Volume surged +65%, showing active participation. IV eased (-5.4%), keeping premiums cheaper. Delta -0.63 signals high sensitivity to downside moves.
________________________________________
🔴 2. SBIN 820 PUT
LTP: 21.65
Sentiment: Bearish | Trend: Down | Strength: 5/5 (Strong)
IV: 14.8 | Delta: -0.56 | Theta: -0.31 | Vega: 0.95
Buildup: Long Build-up
Why?
820 PE reflects a Long Build-up with price rising 20.6% and OI also increasing — a textbook bearish confirmation.
Low IV (14.8) makes premiums attractive. Delta -0.56 shows quick reactivity to price moves.
________________________________________
🔴 3. INFY 1520 PUT
LTP: 42.80
Sentiment: Bearish | Trend: Down | Strength: 5/5 (Strong)
IV: 20.8 | Delta: -0.51 | Theta: -0.63 | Vega: 1.79
Buildup: Long Build-up
Why?
1520 PE shows heavy Long Build-up, with price up 36.5% and OI exploding 106%.
Volume spiked strongly, reflecting aggressive bearish positioning. IV is moderate (20.8), while Delta -0.51 indicates solid responsiveness to further downside.
________________________________________
🔴 4. LT 3600 PUT
LTP: 81.0
Sentiment: Bearish | Trend: Down | Strength: 2.5/5 (Moderate)
IV: 16.9 | Delta: -0.50 | Theta: -1.58 | Vega: 4.26
Buildup: Short Build-up
Why?
3600 PE shows a Short Build-up, with price falling 10.3% while OI rose 41%, pointing to fresh shorts.
Volume surged +29%, confirming activity. IV is steady at 16.9, and Delta -0.50 indicates balanced downside exposure.
________________________________________
⚠️ Disclaimer – Please Read Carefully
The information shared here is meant purely for learning and awareness.
It is not a buy or sell recommendation and should not be taken as investment advice.
📌 I am not a SEBI-registered investment advisor.
📌 All views expressed are based on personal study, chart patterns, and publicly available data.
📌 Trading — whether in stocks or options — carries risk. Markets can move unexpectedly, and losses can exceed capital.
📌 Past setups do not guarantee future outcomes.
👉 Beginners: use this to learn market behavior, practice with paper trades before risking money.
👉 Experienced traders: apply your own risk management, sizing, and strategy filters.
👉 Always consult a SEBI-registered financial advisor before real trades.
By engaging with this content, you acknowledge full responsibility for your own trading and investments.
________________________________________
💬 Found this useful?
🔼 Boost this post to help more traders learn.
✍️ Share your thoughts/setups in comments — let’s grow together.
🔁 Share with fellow traders & learners.
👉 “Follow for more clean, structured breakdowns with discipline at the core.”
🚀 Stay Calm. Stay Clean. Trade With Patience.
Trade Smart | Learn Zones | Be Self-Reliant 📊
________________________________________
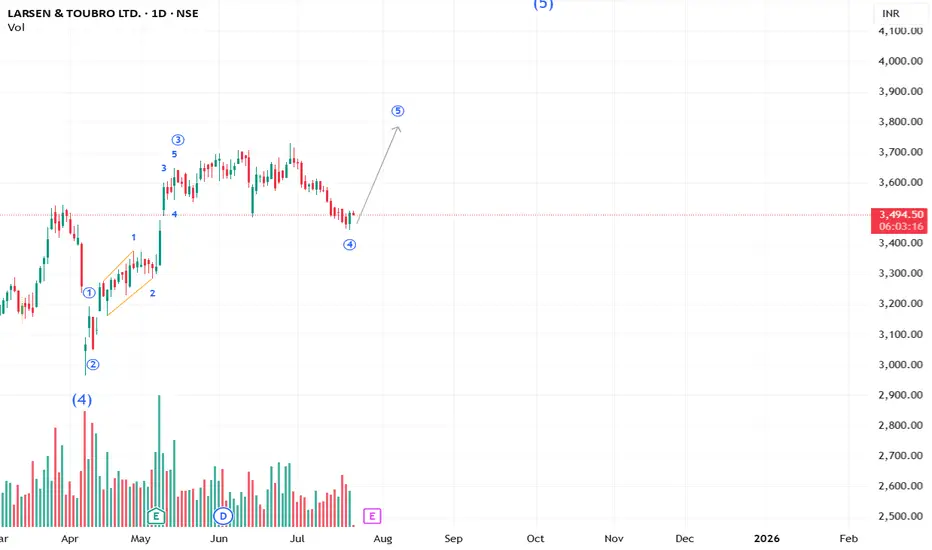
The last move on the way in LT? #LT We may see an upside in LT to finish the last wave 5 to go above 3732. Don't risk more than 2% of your capital on any trade.
**This analysis is based on the Elliott Wave Principle.
This analysis is for educational purposes only and not investment advice.
Please consult your SEBI-registered advisor before making any investment decisions. Markets are subject to risk.**
LT ready to touch 4000CUP pattern in W.
Taken support on the MA and broken them.
RSI is strong with divergence.
waiting for few days of consolidation before boom.

Larsen And Toubro Positional Short Trade Setup!L&T Sell Positional - 3420, With Stop - 3455, For Target - 3250.

L&T breaking outL&T came out of the channel breakout and testing the support, it should be a good buy if price close above 3650

LT - Long SetupCMP 3947 on 09.12.24
Since January 2022, the stock has been traveling in a rising wedge pattern. For the last many days, the price has been moving in a range (shown as a rectangular shape). This time looks like breaking the upper levels.
Immediate supports seem to be around 3860 and 3740.
One may start buying from the current price to as low as 3860, multiple times.
Always keep the position size in accordance with risk management.
The setup fails if the price sustains below 3730.
All this illustration is my own view, shared only for learning and observation purposes. It is not a piece of trading advice in any form.
All the best.

Ashoka Buildcon for 60% gainsDate: 15 Oct’24
Symbol: ASHOKA
Timeframe: Daily
Ashoka Buildcon seems to be in Wave 4 which is likely to see one more leg down before it starts to move up in Wave 5 towards 370 (~60% from end of Wave 4) as seen in the chart. Company’s market cap (~7000 cr) to sales (10,000+ cr) ratio is at 0.68 while the industry average is 4 times higher at 2.24.
This is not a trade recommendation. Please do your own analysis. I have the right to be wrong.
Aisa lagta hai ki Ashoka Buildcon Wave 4 mein hai, jiske Wave 5 mein 370 (Wave 4 ke ant se ~ 60% adhik) ki taraf badhane se pahale ek aur baar neeche jane ki sambhavna hai, jaisa ki chart mein dekh sakte hain. Company ka market cap (~7000 crore) aur sales (10,000+ crore) ratio 0.68 hai jabki industry ka average 4 guna adhik 2.24 hai.
Yah koi trade lene ki salah nahin hai. Kripya apna vishleshan khud karein. Aur mujhe galat hone ka adhikaar hai.

LT stock in bullish modeCleary visible & a very high probability that stock will break out from the long resistance area and further move towards 4000 levels. keep the stock in your watch list.

LT continues its consolidation phase within the symmetrical triaAs LT continues its consolidation phase within the symmetrical triangle formation, traders should closely monitor the price action around the key levels of resistance at 3700 and support at 3500. A breakout above 3700 could signal a bullish trend, potentially leading to higher targets, while a breakdown below 3500 might indicate further downside risk. Keeping an eye on volume and momentum indicators as the price approaches these boundaries can provide additional insights into the potential direction and strength of the move.


Larsen & Toubro Ltd - Breakout OpportunityDate : 29-Jul-2024
LTP : Rs. 3,774.95
Next Resistances: (1) Rs. 3,919 --> (2) Rs. 4,380
SL : Rs. 3,460 on daily close basis
Technical View:
• NSE:LT is in it's primary uptrend and was recently going through it's secondary downtrend.
• After touching the high of 3,919.90 on 3-Jun-2024, it has retraced 19% to 3,175.05 level.
• On 29-Jul-2024, NSE:LT has broke out from its secondary down trend with higher than average volume.
• NSE:LT is trading above 21 DEMA, 20 DMA and 50 DMA.
• RSI has formed bullish cross over on 26-Jul-2024 and trading at 62.36.
• MACD has formed bullish cross over on 29-Jul-2024 and trading at 19.36. Both RSI and MACD are indicating bullish momentum in coming days.
• Looking strong to start a new swing from here.
Disclaimer : I am not a SEBI registered analyst/consultant and not recommending anyone to take any BUY or SELL position in stock market. Investing in stock market is risky and one should do a self analysis and validation before investing in stock market. My ideas are published for learning purpose only and are available to everyone at no cost/charge.

LT is waiting for something called BigHello Traders,
There is High Traffic Jam in LT now days. Seems that it could not define the way but something big is planning out there.
Once it has been revealed be prepared for the results. Be cautious there could some accidents can occur too.
Because the accumulation is going on too serious that is results can make a History.
Possibility & higher chances are that it can open the Range for the upside because the strong Rejection from below levels have seen & a very rough hardcore volatility has been seen.
Be Patience
Thank You
Prince

L&T INTRADAY ALL SET TO BREAKOUT 8 DAY RANGEL&T is All set to about to break the 3650 levels & once we get the closing above the Level we can plan out for a Trade with the minimal stop loss.
Targets are define on basis of Fibonacci extention
Target 1 is 3700 & Target 2 is 3780.
HAPPY TRADING
PRINCE

L&T weekly Update 14/JUN/24HELLO TRADERS.
A very good evening.
As we can see The big infra giant is In consolidation from Last few weeks after a great Rally.
The Giant is Taking rest for Some Time in order to Give the next big move.
As we can see that The giant has entered a BEARISH territory few weeks ago, same has been covered & shifted to the BULLISH ZONE again.
Formed a HH pattern & Bullish Harami Candle has been Formed inclusions of Last week.
Its Not worth taking the Directional Position in this zone.
Let it Accumulate & Close above 3950 levels.
HAPPY TRADING

L&T Weekly update 07/JUN/2024LARSEN & TUBRO infra giants trading in the Range from past few weeks.
BELOW 4100 levels is not good spot for going long.
But the WEEKLY RSI spot the BULLISH HIDDEN DIVERGENCE. Wait for the Pattern creation & Multiple Confirmations.
MONTHLY RSI > 60
WEEKLY RSI < 60
wait for the Weekly closing of RSI above 60 levels. So the trade can be Planned out on DAILY TIMEFRAME.
Seems to be the Breakout to be done with INVERSE HEAD & SHOULDER pattern.
HAPPY TRADING

Right time to accumulate this stock for swing tradingCompany:- Infosys Ltd.
Sector:- IT (Information & Technology)
M Cap :- 6.14T
Technical Analysis:- The stock has experienced a notable decline of 15% from its recent peak. Delving into the intricate dynamics of its price movements, an examination of the hourly chart reveals a completion of correction within wave 12345. Furthermore, a meticulous observation of the daily chart showcases the emergence of an inside candle, signaling a potential breakout imminent in today's trading session.
Of particular note is the breakout of bullish divergence coupled with a period of consolidation evident on the hourly chart. This confluence of indicators suggests a compelling trajectory for the stock, with a projected upward movement towards the levels of 1575 and subsequently 1620 in the foreseeable future.
Disclamer:- Before taking any trade or investment do your own analysis or cunsult your financial advisor.

LARSEN & TOUBRO BULLISH VIEWLT looks like a bullish
which forms a cup handle pattern
the previous high was broken and a retest was also done
a small flag pattern also form
Entry@CMP
Stop loss@3670
1st target@4040
2nd target@4400
Disclaimer:
I am not a SEBI Registered Analyst. Anything posted here is my own analysis and views. This is created for educational purposes only. Always consult your Financial Advisor before taking any decision or trade.
Happy trading.
so please keep LT in your watchlist for long term investment.
If you like my view, do support it with a boost whitch is valuable inspiration for me to post ideas like this in future. thank you friends!
