Laurus Labs Limited - Breakout Setup, Move is ON...#LAURUSLABS trading above Resistance of 1091
Next Resistance is at 1512
Support is at 806
Here are previous charts:
Chart is self explanatory. Levels of breakout, possible up-moves (where stock may find resistances) and support (close below which, setup will be invalidated) are clearly defined.
Disclaimer: This is for demonstration and educational purpose only. This is not buying or selling recommendations. I am not SEBI registered. Please consult your financial advisor before taking any trade.
LAURUSLABS

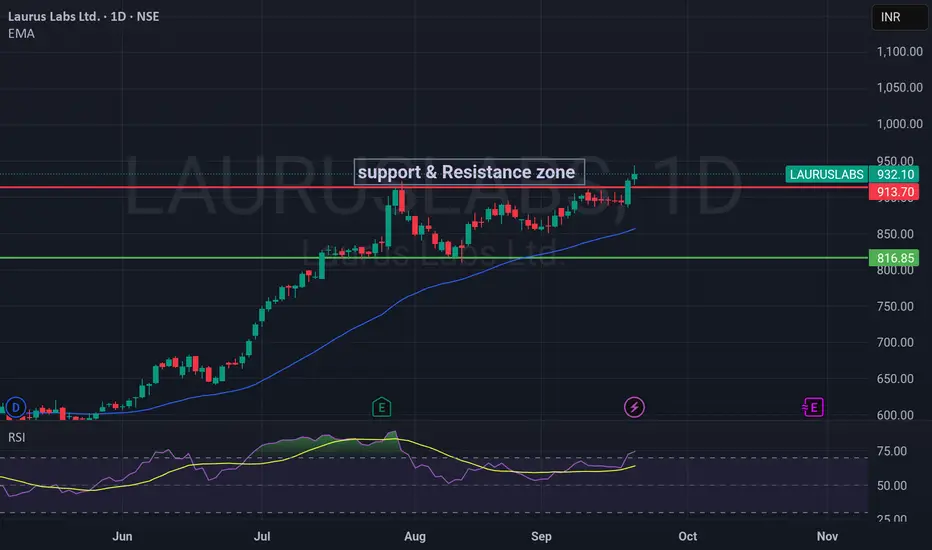
LAURUSLABS - Bullish Trend Intact; Watch for Break Above 9501. Executive Summary
Laurus Labs is in a strong bullish momentum phase, trading well above its key Exponential Moving Average (EMA). The stock faces a decisive resistance at 950. A breakout above this level could signal the next leg up, while the trend remains supported on any pullback towards the 856-917 zone. The high RSI suggests caution for immediate entries; prefer buying on dips.
2. Key Technical Observations:
Price Action: The stock closed positively at 932.10 (+0.96%), near the day's high of 944, indicating strong buying interest at lower levels.
Trend Analysis: The price is trading significantly above the EMA (856.88), confirming a robust medium-term UPTREND.
Momentum (RSI): The RSI is at 74.73, indicating the stock is in OVERBOUGHT territory. This suggests the possibility of a short-term consolidation or pullback before the next potential move higher.
Key Levels:
Resistance: 950 (Immediate & Crucial)
Support: 917 (Today's Low) -> 856 (EMA & Strong Trend Support)
3. Trading Plan:
Bullish Scenario (Primary Bias):
Entry Trigger 1 (Aggressive): A breakout and sustained close above 950 with high volume.
Entry Trigger 2 (Conservative): A pullback towards the support zone between 917 - 870 (ideally near the 856 EMA) for a better risk-reward entry.
Stop-Loss: Below 850 (A break below the EMA would invalidate the bullish structure).
Target 1: 1000
Target 2: 1025 - 1050
Bearish Scenario (Caution Signal):
A break below the 856 EMA support could lead to a deeper correction towards 800.
This is not the primary expectation but a key level to watch for risk management.
LAURUSLABS : Breakout Stock#LAURUSLABS #vcppattern #vcpbreakout #breakoutstock #trendingstock
LAURUSLABS : Swing Trade / Short Term
>> Rally - Base - now ready for RAlly
>> Base = Beautiful Vcp pattern
>> VCP pattern Breakout with Volumes
>> Trending stock in Momentum
>> Good Strength & Volumes
Swing Traders can lock profit at 10% and keep Trailing
Please Boost, comment and follow us for more Learnings.
Disc : Charts shared are for learning purpose only, not a Trade recommendation. Do your own research and consult your financial advisor before taking any position.

LAURUSLABS Price ActionLaurus Labs Ltd showed strong bullish momentum today, closing near ₹920 and touching an intraday high of ₹921.50. The stock rallied nearly 3% over the previous session, with support coming in at ₹885–890 and sustained buying interest driving it to fresh 52-week and all-time highs. Volumes were robust, and Laurus Labs remains above both its short- and long-term moving averages, reflecting continued upward trend strength.
Technical indicators are positive, with the price firmly above the 50- and 200-day averages and momentum readings remaining supportive. Resistance is expected around ₹922–925; a breakout could pave the way for higher targets, while immediate support sits at ₹885 and then ₹860. The stock’s price-to-earnings ratio sits on the higher end, signaling premium valuation thanks to growth expectations and strong fundamentals.
In summary, Laurus Labs is in a strong uptrend with bullish technicals and fresh highs, offering positive sentiment unless it drops below key support levels.

Lauruslabs-It can fly towards ATH again!Lauruslabs has given a good breakout of trendline and horizontal resistance with volume.
Stock is looking strong for a reversal and can fly towards ATH if market supports.
Keep in watchlist.

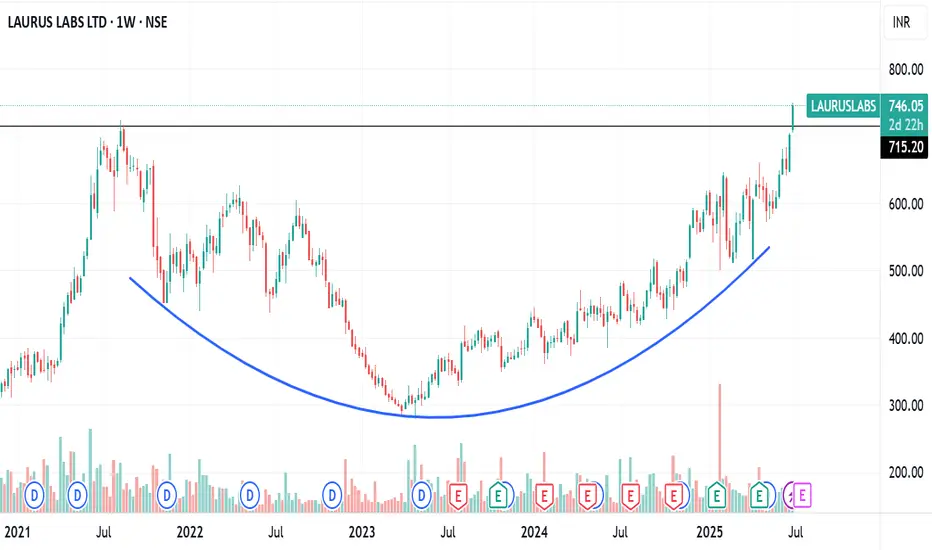
LAURUSLAB ROUNDING BOTTOM BREAKOUTLauruslab breaking rounding bottom pattern
weekly basis with good volume
trading at ATH,multiyear breakout
may retest then start moving upside
NO BUY/SELL RECOMENDATION
Laurus Labs Limited - Breakout Setup, Move is ON...#LAURUSLABS trading above Resistance of 553
Next Resistance is at 699
Support is at 420
Here are previous charts:
Chart is self explanatory. Levels of breakout, possible up-moves (where stock may find resistances) and support (close below which, setup will be invalidated) are clearly defined.
Disclaimer: This is for demonstration and educational purpose only. This is not buying or selling recommendations. I am not SEBI registered. Please consult your financial advisor before taking any trade.

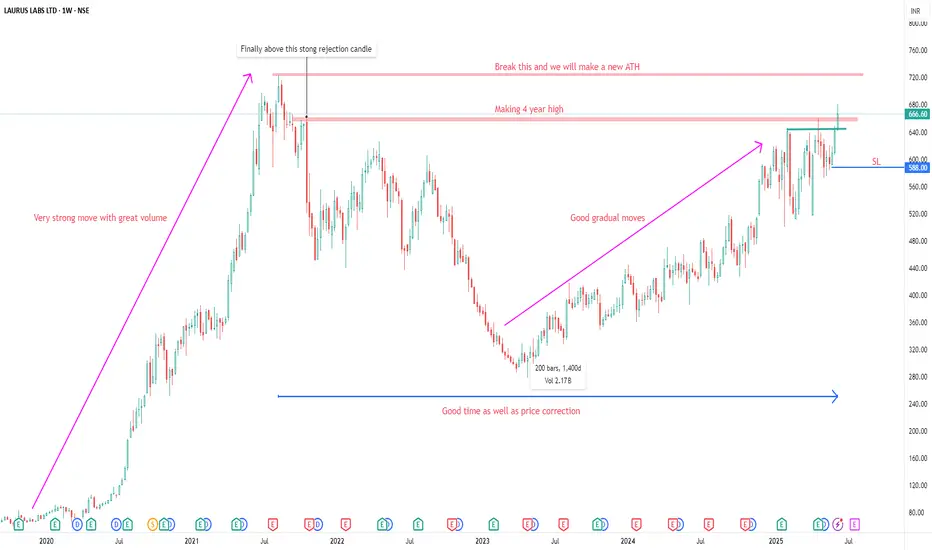
LAURUS LABS LTD ANALYSISFOR LEARNING PURPOSE
LAURUS LABS LTD - The current price of LAURUS LABS LTD is 666.60 rupees
I am going to buy this stock because of the reasons as follows-
1. Its coming out from a good consolidation base
2. It broke a strong resistance zone and making 4 year high
3. It is showing better relative strength as it stood strong in volatile times
4. The risk and reward is favourable
5. The stock is famous and it belongs to a sector which is defensive and has not done much in last weeks so I am expecting some move from that.
6. The stock was very strong in 2020-2021 and it needed a good rest which it got in last 4 years
7. The stock has been outperforming major Index as well as Sectoral Index which is a good sign
I will buy it with minimum target of 35-40% and then will trail after that.
My SL is at 588 rupees
I will be managing my risk.
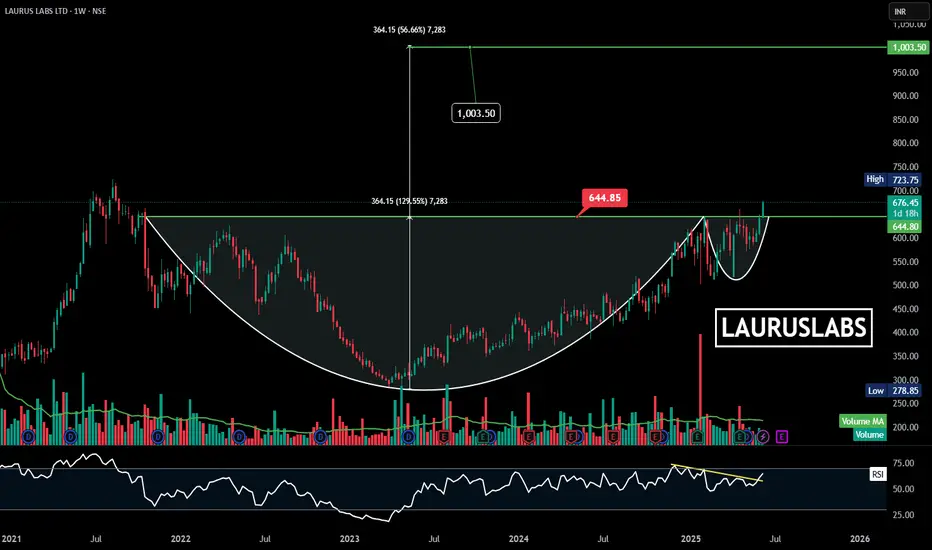
LAURUSLABS | Cup and Handle | Weekly | Breakout
### 📈 **Weekly Chart Overview:**
✅ **Cup and Handle breakout pattern**
* **Cup base:** ₹278.85
* **Resistance breakout:** ₹644.85
* **Current price:** ₹676.45 (+5.36% move)
* **Measured move target:** ₹1,003.50 (approx. 56–57% projected upside).
---
### 📊 **Key Chart Signals:**
* **Cup and Handle formation:** Clear bottom rounding out and handle consolidation breakout above ₹644.85.
* **Volume spike** near breakout confirms buying strength.
* **RSI:** Just breaking out of a long-term descending trendline, hinting at fresh momentum.
---
### 🔍 **Next Key Levels:**
* **Immediate resistance:** ₹700 zone (weekly highs)
* **Measured move target:** ₹1,003–1,005
* **Support zone:** ₹644–645 (handle breakout level).
---
### 💡 **Key Takeaway:**
The **weekly Cup and Handle breakout** suggests **strong long-term momentum** for Laurus Labs, with a projected target near ₹1,000. It’s important to watch for **confirmation above ₹700**, which would further support the bullish move.
Parallel channel breakout with retest in Laurus LabsNSE:LAURUSLABS
A bullish parallel channel breakout has happened with a retest at 550 levels.
Currently on a weekly level stock can go past 600 with a buying price at 570-580 levels & subsequently increase beyond 600.
A SL of 450 with a higher target of 700, 900 & 1100 can be achievable in 1 1-year time frame.

Laurus Labs cmp 636.80 by Weekly Chart viewLaurus Labs cmp 636.80 by Weekly Chart view
- Support Zone at 532 to 556 Price Band
- Resistance Zone at 616 to 642 Price Band
- Falling Resistance Trendline Breakout seems sustained
- Rising Support Trendline been traversed by the Stock Price
- Volumes seem going well in sync along the average traded quantity
- Positive trends seen for the Technical Indicators like EMA, MACD, RSI
- Weekly Support at 565 > 500 > 425 with Resistance at 684 > ATH 723.75
- Repeat Bullish Rounding Bottoms with longest been close to 2 1/2 years with Resistance Zone neckline

LAURUSLABS - Cup-and-handle - BO - wklyLAURUSLABS
This chart depicts **Laurus Labs Ltd.** and showcases a **cup-and-handle** breakout pattern.
### Observations:
1. **Cup-and-Handle Pattern**:
- The stock formed a rounded "cup" with a resistance around ₹516.70.
- A brief consolidation (the "handle") followed, leading to a breakout above ₹516.70.
2. **Breakout Confirmation**:
- The price closed at ₹567.15 (+10.64%), indicating a strong breakout.
- The breakout is supported by high volume, confirming buying interest.
3. **Measured Target**:
- The height of the cup (~₹237) added to the breakout point (₹516.70) gives a target of **₹753.00**.
- This represents a potential upside of ~46% from the breakout level.
4. **Support Levels**:
- The breakout level at ₹516.70 now acts as immediate support.
- Stronger support lies near ₹440 (handle base).
5. **Volume Spike**:
- Significant volume during the breakout signals strong momentum, increasing the likelihood of the price reaching the target.
### Potential Strategy:
- **For Bulls**:
- Entry on pullbacks near ₹516.70 or on dips above ₹550.
- Target: ₹753.00.
- Stop-loss: Below ₹500 (to account for false breakouts).

LAURUSLAB PARRELEL CHANNEL BREAKOUTLauruslab breaking parrelel channel weekly basis
with volume spike and strong rsi
target mentioned in chart
trading above 20 ema
NO BUY/SELL RECOMENDATION

LAURUS LABS - Expecting towards all time highCurrently breaking out the ascending channel. Looking good for upmove. Have Patience, it will take months. :-)

Uptrend Cont. Forward in Lauruslabs on Weekly TF.NSE:LAURUSLABS is in a beautiful Uptrend lately on a Weekly Timeframe, With Aggressive Delivery based Buying and a Long Buildup in Futures today.
🙋♀️🙋♂️If you have any questions about this stock, feel free to reach out to me.
📌Thank you for exploring my idea! I hope you found it valuable.
🙏FLLOW for more
👍BOOST if useful
✍️COMMENT Below your views.
Meanwhile, check out my other stock ideas below until this trade is activated. I would love your feedback.
Disclaimer: This analysis is intended solely for informational and educational purposes and should not be interpreted as financial advice. It is advisable to consult a qualified financial advisor or conduct thorough research before making investment decisions.

LAURUS LABThe Channel is being respected here
With a steady rise. Low downside potential
Taking Good Support for 200 EMA and channel.
BONUS... Entire Sector is hitting the uptrend.

LAURUSLABS - Cup and Handle - Breakout - DailyName - LAURUSLABS
Pattern - Cup and Handle breakout
Timeframe - Daily
Volume - Very Good
Cmp - 506
Target - 679
SL - 482
Always welcome for any comments with your feedback or give it a like if you find it useful.

Laurus Lab breakout of trendlineLaurus Lab done abc correction and break out of trendline
giving Positive momentum with good volume.
Currently trading in upside moving channel..
looking good potential for upside for 600-700 targets in short term.
Disclaimer : study is for educational purpose. I am not SEBI registered.

Lauras Labs now looking bullishLaurus Labs now looking bullish after completing the breakout. Watch this stock for long term, this views are my personal and also only for educational purpose. Please consult your financial advisor before taking any decision.

Laurus Labs cmp 489 by Weekly Chart viewLaurus Labs cmp 489 by Weekly Chart view
- Support Zone at 445 to 460 Price Band
- Volumes are increasing week after week
- Price sustaining over the Rising Support Trendline
- Price sustaining above the Falling Resistance Trendline
- Weekly basis : Support at 415 > 365 > 306 with Resistance at 530 > 589 > 660 > ATH 723.75
- *Bullish Cup & Handle formed with price closure above Support Zone and needs to sustain for breakout to continue*

Laurus Labs and Fine Organic - Reversal Breakout Alert!
In the past, the stock found strong support around the 450 level, but when the price dropped below this support zone, it experienced a significant decline.
The stock started to move upwards within a parallel channel after finding support around the 290 level.
A recent bullish candle allowed the price to break through its trendline resistance with strong volume support.
The stock also broke through the upper Bollinger Band and has been able to sustain its position above it.
With the price showing strong upward momentum, there is potential for an upward movement from the current level.
The stock price reached an all-time high of nearly 7,330 before dropping sharply to around 4,100.
After the decline, the price entered a consolidation phase and traded in a Box pattern.
A breakout has occurred recently, with the stock surpassing its previous range and trying to maintain its position.
The rising volume suggests the possibility of an upward movement from the current level.

Technical Analysis for Laurus Labs:Chart Pattern: Breakout of Supply Zone
Volume: Good volumes with a bullish candle closing
Trendline: Breakout of trendline as well
Entry Strategy: Buy at Current Market Price (CMP) ₹477
Stop Loss (SL): ₹410 for risk management
Target: ₹711
Trade Duration: Swing Trade for 3-6 months

Laurus Labs - Cup & Handle Breakout A nice one and half year pattern breakout
Breakout Zone : 475
Support Zone - 410-415
Target : 575 - 675
Looks good for Medium Term
