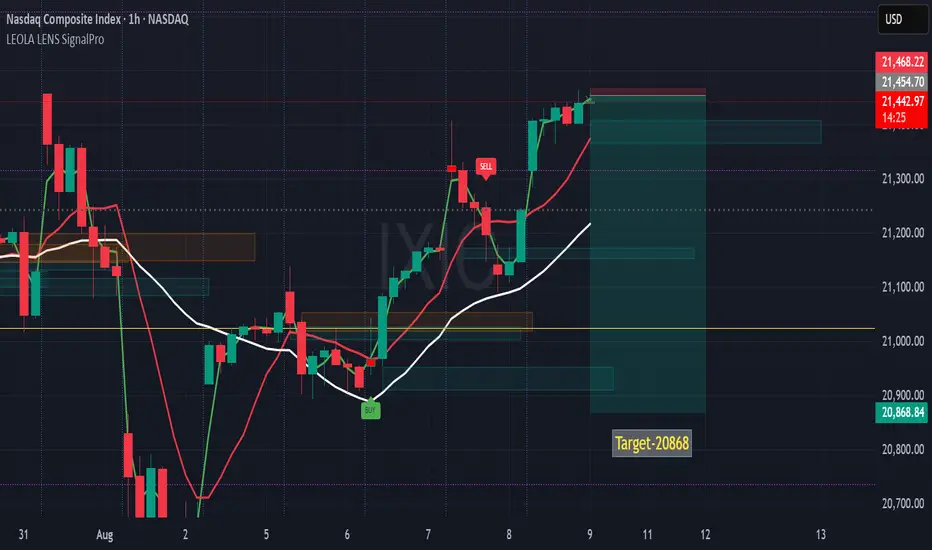
NASDAQ Composite (IXIC)- 1hr Reversal Setup Targeting 20,868This 1-hour chart shows a potential short-term reversal on the NASDAQ Composite, identified using Leola Lens SignalPro.
🔍 Technical Notes:
🟢 Price recently tested the upper red supply zone near 21,454, where prior SELL pressure emerged.
⚪ The white trendline (mid-term bias) is still below price, suggesting a test of resilience before reversal.
🔴 Multiple rejections near the supply zone may hint at exhaustion of buying momentum.
📉 Target: 20,868 — aligning with a prior structural pivot and liquidity zone.
🟡 Watch for confirmation via lower timeframe breakdowns before any continuation lower.
The setup reflects a possible supply-zone reaction after an extended rally, with a measured move toward a lower support zone.
⚠️ Disclaimer:
This analysis is for educational purposes only and should not be taken as financial advice. Always do your own research and consult a licensed financial advisor before making any trading decisions.
Lcbbox
Nifty50 Intraday Rebound-Sets Eyes For Long 🔍 Key Observations:
✅ A fresh Buy label has printed after a series of lower lows — suggesting potential momentum shift.
🔴 Previous Sell cluster accurately marked the swing high near 25,145 zone.
⚪ Price is still trading below the 200 EMA, but attempting to reclaim short-term trendlines.
🟫 Minor Liquidity Box indicates supply pressure ahead, aligning with previous structure resistance.
📊 Risk-to-reward suggests the move could extend towards 25,145.35, if price holds above 24,707.
🎯 Setup Summary:
Bias: Cautiously bullish, short-term retracement within broader downtrend
Target Zone: 25,145 – matching previous support turned resistance
Invalidation: Below 24,647 where recent demand may fail
🧠 Educational Insight:
This setup highlights a classic counter-trend bounce from oversold levels, often seen when market participants begin profit-taking or short-covering. Momentum confirmation is crucial beyond the red zone to validate follow-through.
⏱ Timeframe:
15-Minute (Intraday)

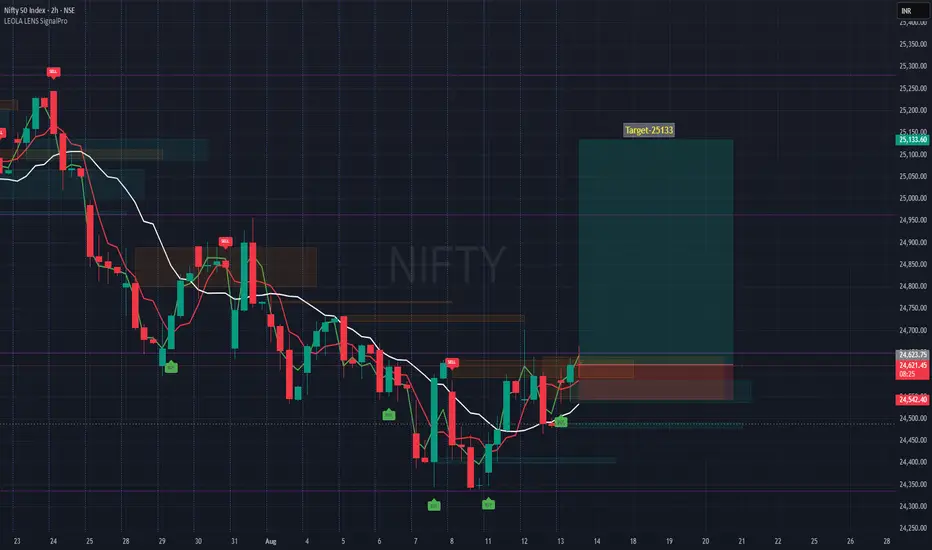
NIFTY Eyes Long on 25133- Bullish Breakout WatchTimeframe: 2-hour (H2)
Entry Zone: Around current breakout level of 24,619
Target: 25,133 – aligns with a prior reaction high and measured move projection from recent swing range.
Stop-Loss: 24,542 – just below the most recent higher low, protecting the setup if momentum fails.
Reasoning:
Price has been forming higher lows since August 7, indicating gradual strength building.
Moving averages have turned upward, confirming short-term trend change.
Previous sell-side liquidity zones have been cleared, reducing overhead resistance until the 25,133 area.
Volume profile shows a gap zone between 24,650 and 25,100, often filled quickly in trending conditions.
Risk Management:
This is a swing-style setup within an ongoing uptrend on the lower timeframe but still needs confirmation from follow-through buying.
Disclaimer:
This chart is for educational discussion only and does not constitute financial advice or a recommendation to trade. Markets carry risk, and decisions should be based on your own analysis and risk tolerance.
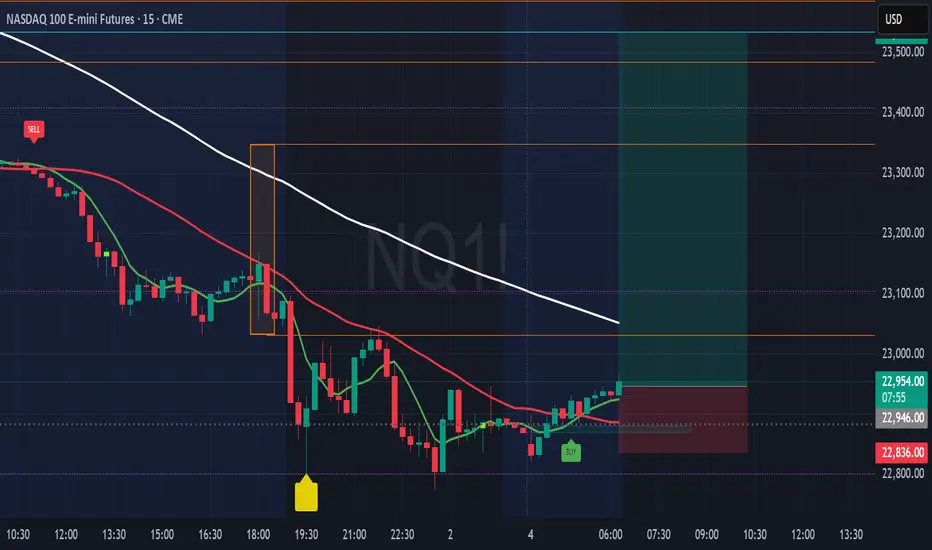
NQ100 - Eyes Long Towards 23531📌 NQ100 Futures 15-min — Buy Signal After Momentum Exhaustion & Trap Zone
Technical Structure Insights (15m):
🟡 A caution label printed near the evening session, highlighting a potential trap zone after short-term buyers were absorbed near the white moving average (trend resistance).
🔻 Price broke lower, completing a strong impulse leg to the downside.
🟢 BUY Signal has since appeared after price based out near 22,830 — coinciding with the purple reaction line.
📈 Current price is climbing back toward dynamic resistance levels (red and white moving averages).
🔍 Price must reclaim and sustain above 23,000 for upward continuation to remain structurally valid.
Otherwise, this may evolve into a lower high setup within the broader trend context.
Disclaimer: This chart is for educational purposes only and does not constitute financial advice. Always perform your own analysis and manage your trading risk responsibly
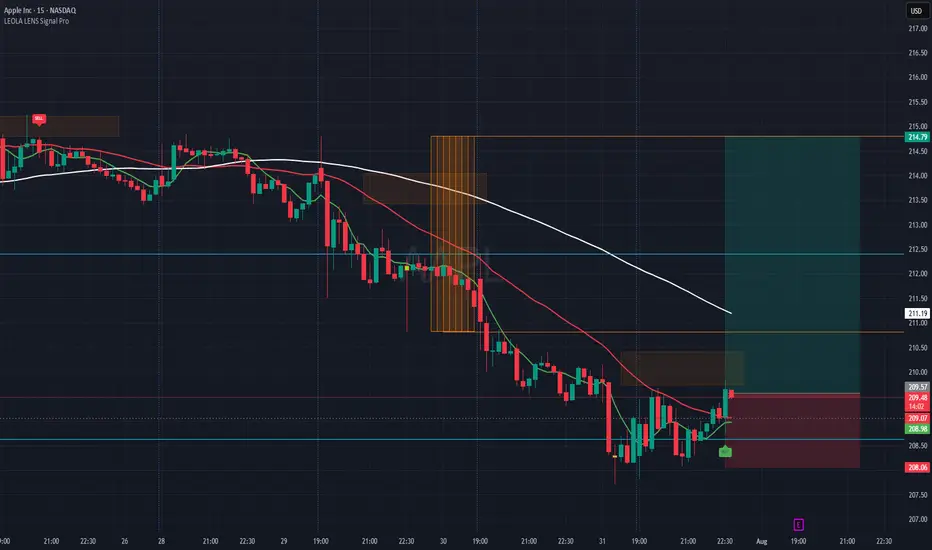
AAPL-Reaction Setup Lower Structure Zone-Eyes LongThis chart captures a structure-aware buy setup on Apple Inc. (AAPL), using Leola Lens SignalPro with momentum overlays and risk visualization.
What the Chart Shows:
🟢 A new BUY label appeared after price tapped a previously marked liquidity zone.
📉 Prior bearish momentum exhausted near 208.50–208.90 area — forming a potential base.
🟥 Overhead resistance is clearly defined, aligning with a recent rejection block and moving average confluence.
✅ A well-defined Risk:Reward setup is plotted — aiming for continuation toward 214.79, with risk below 208.06.
Key Levels to Monitor:
🔺 Break and hold above 210.50 could shift bias toward bullish continuation.
⚠️ Failure to hold above 209.00 could invalidate the current intraday structure.
This view is for educational purposes only — illustrating how price reacts around structure, liquidity, and confirmation signals.
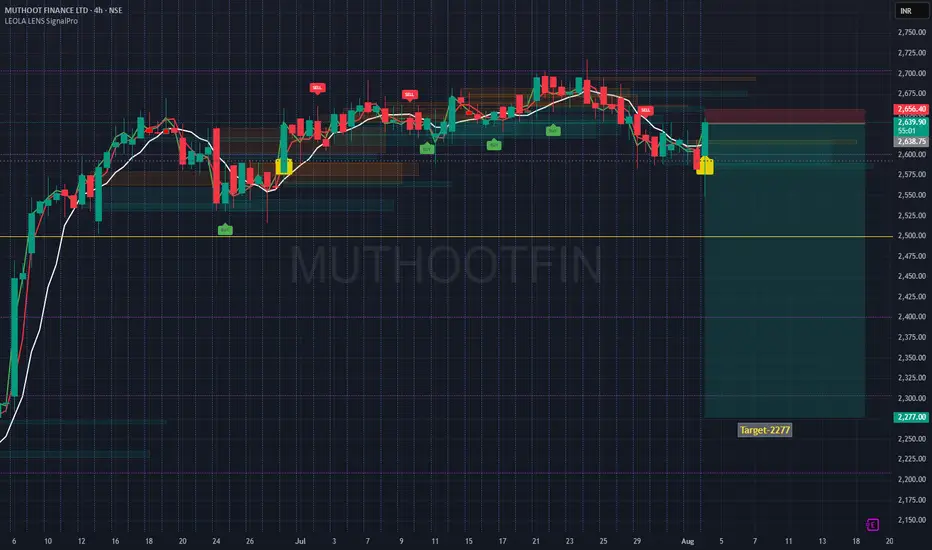
MUTHOOTFIN Structure Breakdown- 2277- Step Towards a Fall 🔍 Technical Structure Breakdown:
🟡 Caution label printed after extended distribution — often a signal for upcoming directional shift.
🔴 Price rejected strongly from the upper red supply zone near ₹2,656, confirming resistance from prior SELL cluster.
⚪ Structure broke below a multi-session accumulation zone, flipping the bias to bearish.
🟢 Current rebound is testing the underside of broken structure — often a key area for rejection or continuation.
📉 Target: ₹2,277, aligning with a major historical reaction zone and potential liquidity pocket.
This setup reflects a classic breakdown-retest structure where price may revisit lower order blocks if it fails to reclaim the broken support zone.
⚠️ Disclaimer:
This post is intended solely for educational purposes and does not constitute financial advice. Please do your own research and consult a licensed financial advisor before making any investment or trading decisions.
EURUSD Eyes Short Structure Break📌 EURUSD 15-min — Structure Breakdown After Consolidation Near Resistance
Technical Chart Breakdown (15m):
🔴 SELL Signal triggered after price rejected upper boundary of a tight consolidation box.
🟠 Multiple rejections formed just below 1.158 — suggesting local supply absorption.
🔻 Price broke below the red moving average and consolidation low, confirming momentum shift.
🟡 Leola Lens caution structure (box cluster) marked a potential pause before breakdown.
📉 Downside focus remains valid as long as price stays below 1.158.
🔍 Structural target zone extends toward 1.15, with intermediate reaction levels visible.
Disclaimer: This chart is shared for educational purposes only and does not constitute financial advice or a recommendation to trade. Always conduct your own analysis and manage risk appropriately.

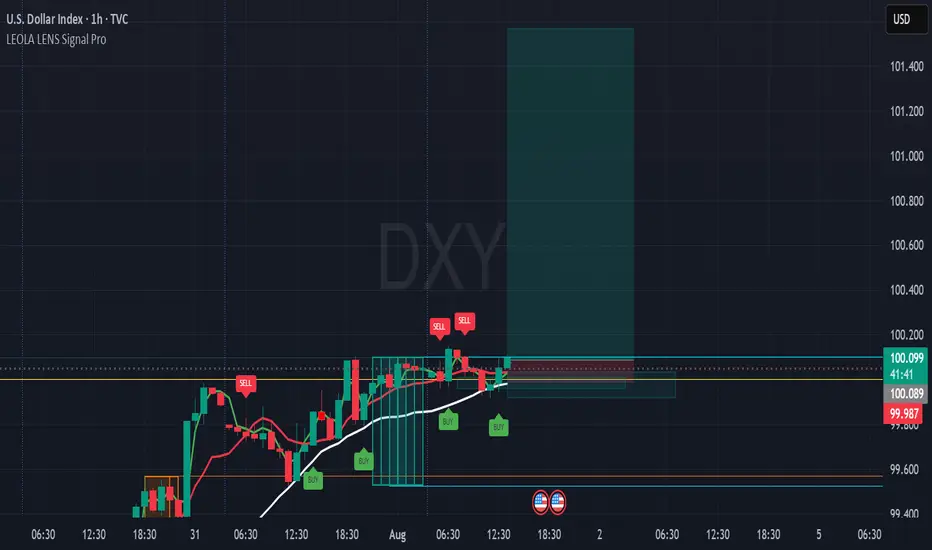
DXY Long Setup Forming After Structure Reclaim-101.567This intraday chart on DXY (U.S. Dollar Index) showcases a structure-aware long setup using Leola Lens SignalPro on the 1H timeframe.
⚙️ Key Technical Highlights:
🟢 Multiple BUY signals appeared near 99.98–100.00 zone after reclaiming short-term structure.
⚪ Price holds above the white adaptive base trendline — suggesting support strength.
🟥 Liquidity Control Box defines a clear invalidation zone under 99.98.
🔁 Prior SELL signals failed to follow through, indicating weakening bearish momentum.
📊 Target projection: 101.567 (based on structural extension and signal alignment).
📌 What to Monitor:
🔎 A decisive candle close above 100.10–100.15 can confirm bullish intent.
🎯 Reward-to-risk favored on clean setups post-breakout, aligning with momentum model.
📉 Invalid if structure re-breaks below base zone with volume.
⚠️ Educational use only. Not financial advice. Structure zones visualize behavior — not prediction.
🔐 Invite-only tool — access details in author bio.
ES1- Reversal After Extended SelloffPrice has experienced a clean, directional drop with consistent Sell signals and EMA slope confirmation.
Current Buy signal has appeared near potential support, offering a short-term reversal watch.
EMAs still show downward pressure, so caution is warranted until breakout confirmation occurs.
🔍 Educational Setup Observation:
Observed Entry Zone: Near 6,408.00
Stop Level: Below 6,399.25 (below structural low)
Potential Target Area: 6,442.75 — prior imbalance and reaction zone
🧠 SignalPro Highlights:
This is the first Buy signal after a strong sell sequence — often used as a potential momentum shift marker.
Short-term reversal setups like this often require clear candle confirmation above moving averages to validate direction.
⚠️ This chart and setup is for educational purposes only. It is not financial advice. Always conduct your own due diligence and apply proper risk management.

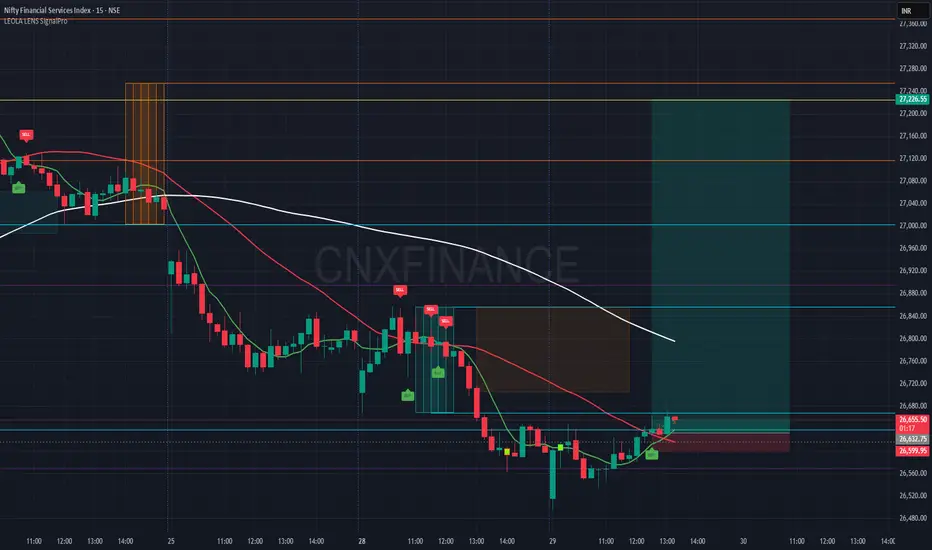
Nifty Financial Services Index-Reversal Set-Long Eyes ONLeolaLens SignalPro has triggered a fresh Buy indication on the 15-minute chart after a prolonged downtrend. This signal has emerged near a possible reversal zone, with defined risk and potential reward setup.
Entry: Around 26,660
Stop Loss: 26,599
🎯 Target 1: 26,880
🎯 Target 2: 27,040
🎯 Target 3 (Extended): 27,240
Key Observations:
Price attempting short-term EMA crossover
Favorable risk-reward ratio setup
Chart structure suggests potential for short-term reversal
🛑 Disclaimer:
This chart is shared strictly for educational purposes. This is not financial advice or a buy/sell recommendation. Please do your own research and consult a registered financial advisor before making any trading decisions.
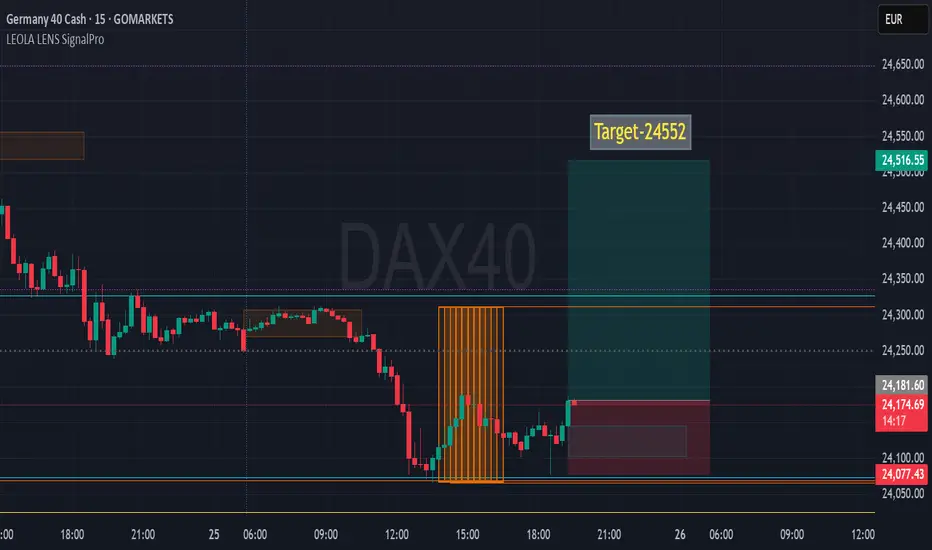
DAX40 Recovery Setup-Potential Upside to 24552After a significant intraday selloff, DAX40 shows signs of a potential recovery as price reclaims the earlier support zone with strength.
🔍 Key Observations:
✅ Yellow box marks a cluster of bars after a strong downtrend, hinting at accumulation or exhaustion.
⚠️ Support retest held — recent candles show signs of rejection from the lower bound near 24,077.
📈 Leola Lens SignalPro structure suggests a potential shift in bias — upside projection mapped to 24,552 as the next key level.
📊 Clean invalidation zone below recent wick lows.
💡 Educational Insight:
This setup emphasizes the importance of price structure, volume balance zones, and trend exhaustion for anticipating reversals. Traders can study how institutional-style tools like SignalPro help highlight such shift moments with visual clarity.