Everything seems to be built in BSE Share prices. Lets wait ~#bseindia shares on 🔥!
Posted blockbuster earnings yesterday — outshining even NSE! 📈
Stock’s flying high with no resistance in sight,but wait..
💡 Fundamentally? Looks pricey vs NSE & global peers
⚡ Valuation driven by growth hype
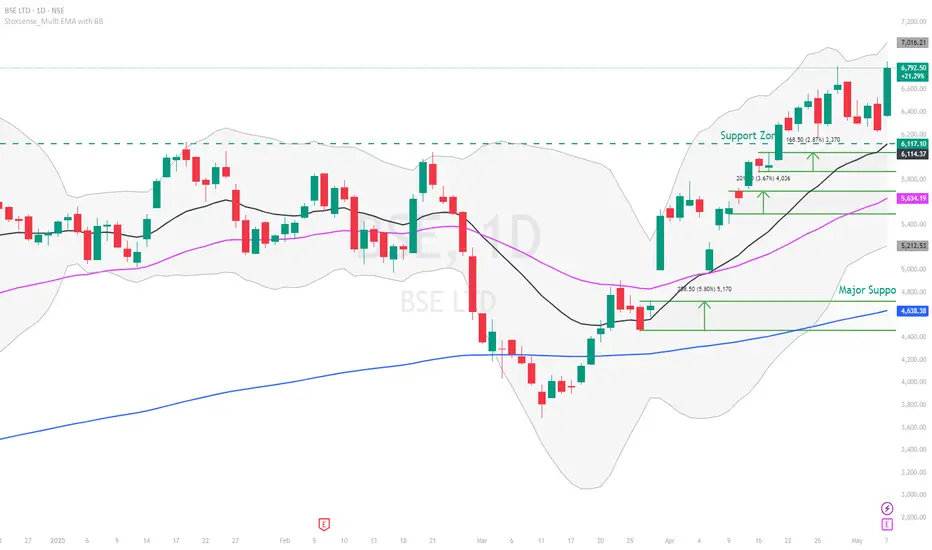
🧱 Key support zones:
• ₹6000–6100 (short-term)
• ₹5450–5600 (next level)
• ₹4400–4600 (long-term)
📉 Already rallied big pre-results — upside may be capped
🔍 Smart move? WAIT for a dip before buying in!
#BSE #StockMarketIndia #Trading #Nifty #InvestingTips #StocksToWatch #learntradingwithsudhir
Learntradingwithsudhir
Dabur : Best avoided at the moment ? | Whats your view ?#dabur is taking a hit today after negative commentary on margin reduction & muted volume growth 📉.
🔴 Downside Alert: No strong support in sight even on the monthly chart, with the ₹420-400 zone as the first solid safety net.
🟢 Upside Hurdle: ₹525-540 is the key short-term resistance—only a strong breakout here can push it past ₹600, which looks unlikely for now.
📊 Fundamentals:
Trading at P/E ~46 vs. a 5-year avg of ~55. With muted growth outlook & rising commodity costs could keep margins under pressure 🚨
💡 Final Verdict: Sit tight! ⚠️ No clear revival signs yet—best to avoid unless sentiment improves. 👀
#StockMarket #dabur #Investing #MarketUpdate #Stocks #StocksToWatch #Stocks #stoxsense #learntradingwithsudhir 👇

Indus Ind Bank : Sideways with negative BiasIndusInd Bank Share Prices : Make-or-Break Levels 🚨
📉 IndusInd Bank has been trading sideways with a slight negative bias for weeks.
🔻 Strong Support Zone: ₹830 - ₹770 is a rock-solid support area, backed by both Weekly & Monthly levels. Breaking below? Highly Unlikely!
🚀 Key Resistance Ahead: ₹1050 - ₹1100 is the BIG test. A breakout above could spark a trend reversal & a strong upside move!
💰 Fundamentally Undervalued: Currently trading at a P/B ratio of just 1.2 vs. its 5-year avg. of 1.8— making it one of the cheapest private banks in the market! (Downside may be limited!)
#StockMarket #TechnicalAnalysis #learn_at_stoxsense #Learntradingwithsudhir #StockMarketIndia #Optiontrading #learntrading #sebiregisteredra #INDUSINDBK #IndusindBank

IRCTC : Is it a BUY now ?#IRCTC Share Price are UP today. Why so?
📊 Earnings Recap: IRCTC delivered decent Q3 numbers and sweetened the deal with a dividend announcement! But the real game-changer? Maha Kumbh-driven travel surge could fuel an even stronger Q1 performance! 🚆🔥
📉 Currently bouncing from its weekly support zone (₹650-625), but the real demand zone sits at ₹580-540 if the broader market correction continues.
📈 Upside Potential: Resistance at ₹710, then ₹720-740—but for any sustainable breakout, IRCTC must cross & HOLD ₹700 convincingly!
💰 Valuation Check:
Trading cheaper vs its 5-year average, but the ₹580 support remains the best accumulation zone for long-term investors.
🎯 Key Levels to Watch:
✅ Support: ₹650 → ₹625 → ₹580-540
🚀 Resistance: ₹710 → ₹720-740
💡 Sustained breakout only above ₹700!
#IRCTC #StockMarket #TechnicalAnalysis #learn_at_stoxsense #Learntradingwithsudhir #StockMarketIndia #Optiontrading #learntrading #sebiregisteredra

Reliance : Good Entry Point🚨 #Reliance Share – Opportunity or Caution? 🚨
📉 Why the Dip today ? Reliance shares are under pressure today, largely due to a potential ₹125 Cr fine for not setting up the battery unit.
📊 Key Levels to Watch:
🔻 Support: The stock is trading in a strong monthly demand zone of ₹1110-₹1180, with another support zone below. If it can hold ₹1000 in the coming months, a potential reversal rally could be on the cards.
🔺 Resistance: On the upside, ₹1330-₹1360 is a critical supply zone, aligned with the 20W EMA—a breakout above this could signal a trend reversal.
🚀 What’s the Catalyst?
The highly anticipated Reliance Retail IPO in 2025 could act as a strong fundamental support, reducing the chances of a major sell-off.
📌 Bottom Line: If Reliance defends key support levels, this dip could be an accumulation opportunity for long-term investors!
💬 What’s your take—Buy the dip or wait for confirmation? ⬇️
#learn_at_stoxsense #Learntradingwithsudhir #StockMarketIndia #Optiontrading #learntrading #sebiregisteredra #reliance

TCS : Heading DOWN Closer to SupportNifty IT index is in a downtrend, and another 4-5% fall in the index seems imminent, before some relief. Inspite of decent results and forecast, the TCS share prices are taking a beating too.
- It has decisively broken it Monthly support of 20month EMA line, and also the weekly support pivot, and is trading below it now. So, in the short term stock is expected to remain under pressure.
- TCS stock prices may find support near 3500 to 3700 zone now, where 200 week EMA and weekly support pivot is located, and just below it 3300 to 3400 levels are also strong support zone
- In case of any bounce, traders may decide to sell the stock again and level of 4000 to 4100 is also going to act as strong resistance in the TCS stock.
- RSI indicator is also suggesting weakness in the stock in short term.
- As volatility in the stock is inching UP, an option trade might be the best bet to trade this stock with lower risk.
#stoxsense #learntradingwithsudhir #learn_at_stoxsense #TCS #NiftyIT

Gold : Still going strong🚀 Gold prices are on fire! In 2025 alone, gold is UP over 12%! The big question—how high can it go? 📈💰
At StoxSense, we believe ₹1,00,000 per 10g is possible this year itself!
So, what’s driving this rally? 🤔
🔹 Uncertainty in stocks & bonds
🔹 Central banks adjusting interest rates
🔹 US dollar movements
🔹 Trump’s tariff war & Eurozone crisis
🔹 Strong Indian gold demand
🔹 Stock market risks pushing investors to safe assets
📊 Technical charts show gold is in a strong uptrend, but a short-term pullback is possible. Key support levels to watch:
👉 ₹84,000 – ₹83,500 (short term)
👉 ₹80,000 (strong long-term support)
🎯 Gold is a solid hedge against stock market risks!
💡 Disclaimer: I’ve been invested in gold since last year. Do your own research before investing!
#Gold #StockMarket #Investment #Bullion #GoldPrice

BSE : Trading Sideways with HIGH IV- Current Ratios : P/E ~ 84 (5 yr average of ~37.5), PEG ~ 5, P/BV ~ 21 (5 yr average of 3.2)
- Technically, BSE has gone into a consolidation within a range of 6200 to 5000 since Dec-2024..
- Yesterday’s bounce was due to Goldman-Sachs purchase in the stock, and momentum can push it to test 6000-6200 levels soon.
- A significant direction in BSE stock prices will only emerge, once it breaks this consolidation range.
- However, this seems like a nice setup for Option traders to trade this range., as the Implied Volatility has also jumped significantly.
#stoxsense #bse #learntradingwithsudhir

Natco : Weaker forecast hitting it hard technically- Q3 results were out Yesterday, and were week with significant weaker forecast !
- Technically, Natco Pharma should test it’s quarterly + monthly demand area of 800 - 740, and go in time correction thereafter with minor bounce
- On any bounce, 1200 - 1300 is going to act as very strong resistance in the stock & cap upside.
- What works for Natco is the cheap valuation vs its historical average, BUT unless forecasts improve, it may not find many takers
#stoxsense #sudhir #natcopharma

Varun Beverages Limited : Good results, BUT technically weak-Q3 results were out today, and looked good prima-facie !
-Technically, Varun Beverages stock prices are trading below all moving averages in daily time, while on weekly also it has resistance around 600 zone. 650 - 670 is strong resistance in VBL.
-It has bounced from 20M-EMA once, but if market weakness persists then it may fall down.
-With P/E ratio of ~ 71.4 (< 5 year average of 66) the PIIND stock prices need to show consistent performance to maintain it’s P/E ratios. Highly likely that VBL may consolidate again.
#stoxsense #VBL

PIIND : Below Averege results, upside may be capped
Q3 results are out. Volatility (IVP) is still high in the stock
Zone of 3300 seems strong support (followed by 300 zone)
On upside, 3700 then 3800-3900 looks like strong resistance
Max Call OI build up at 3700 levels too (as of today) and Max Put OI seems to be around 3500, then 3400/3300 too.
Completely sideways trend, with no trend strength either.
#stoxsense

SBI : Coming close to good value BUYSBI Q3 results are due later today, but expectation is of overall flattish to positive results.
- Technically, SBI has strong support in Monthly charts from 600 - 650 zone, followed by another zone of 540 -580 (from which breakout happened earlier)..
- Similarly, the zone of840 - 870 will act as a strong resistance in short term for the stock too.
- With P/E ratio of ~ 8.8 (< 5 year average of 11.1) & P/B ratio close to 5 year average. It offers comfort of NOT a big downside risk in SBI stock prices.
#SBI #Stoxsense

ONGC : Skewed premium of Puts - Nice sideways setup
Volatility (IVP) is very low in the stock
Zone of 235-240 seems strong support (reversal at high volumes)
On upside, 200D-EMA and Pivot of 270-275 is good resistance
Max Call OI build up at 270 / 265 levels too
Can be volatile but mostly sideways action for Feb Series
Trend strength is not there in either direction
#stoxsense #learntradingwithsudhir #ongc

CG Power : Showing signs of reversal#CGpower is showing signs of reversal - will it sustain ?
- The volatility in the stock has shot up significantly in past 2 days !
- Technically, the CG Power solutions has given early signs of reversal in weekly charts, with 530-540 acting as support zone, while 640, followed by 680 - 700 will act as strong resistance for Feb series
- On the fundamental side, CG Power share price is trading at P/E ratio of ~ 99 (high), and may limit big upside for time being.
- Any -ve news can hammer the stock back to 420- 450 zone (series of supports are placed !)
#learn_at_stoxsense #Learntradingwithsudhir #StockMarketIndia #Optiontrading #learntrading

Siemens : Data Centre Theme - Looks heading downSiemens is a thematic play on data-center, and recent fall is due to Deep-seek announcement.
- Technically, siemens share price is a free fall now, with 4700 as first major support, followed by 4000 to 4500 zone as a long term Quarterly/Monthly/Weekly supports (expected to hold).
- Incase siemens moves up, 6300 - 6500 will act as a very strong resistance zone, and can easily halt further upside in the stock.
- Unless something fundamentally changes again - it may remain sideway for next few months.
#learn_at_stoxsense #Learntradingwithsudhir #StockMarketIndia #Optiontrading #learntrading

BEL - Good buy ?-Q3 result was good, and future expectations was also positive yesterday.
-Technically, election day low has series of strong support around 230 - 200 zone, and can act as a very very strong support, in case the stocks falls significantly. While the level of 300-310 followed by all time high of 340 can act as short term resistance.
-The recent correction has removed froth in the stock (now ~ 40P/E ratio), and looks to be the strongest stock in the Defence sector (followed by HAL).

JSW Energy : Entering a Quarterly Demand Area#jswenergy - Q3 result was NOT great, and pressure may remain on solar energy related stock (oversupply)
-Technically, it is entering a demand area in Quarterly/Monthly chart and can consolidate now in this range of 350 - 450, while on upside the level of 630 - 670 will be strong resistance. Look for reversa l/ breakout in weekly charts to confirmation of base formation.
- The recent correction in jsw energy share price removed froth in the stock (now ~ 40P/E ratio), may offer better opportunity to trade on long side on major support of 420-425 level in weekly 200D-EMA
#learn_at_stoxsense #Learntradingwithsudhir #StockMarketIndia #Optiontrading #learntrading

ICICI Bank : Good HOLD in current market- Q3 results was good and stock can open with a bounce tomorrow morning.
- Technically, it is trading in a downward regression channel, and at 200D-EMA (support), and can give a upside breakout. The zone of 1300-1330 can act as a resistance in short term, while downside seems to be capped at 1000 (worst case) with strong support at 1170-1150 level.
- The stock is expensive fundamentally, BUT can remain trading so given improved performance and is one of the safe against market volatility too in short term.
