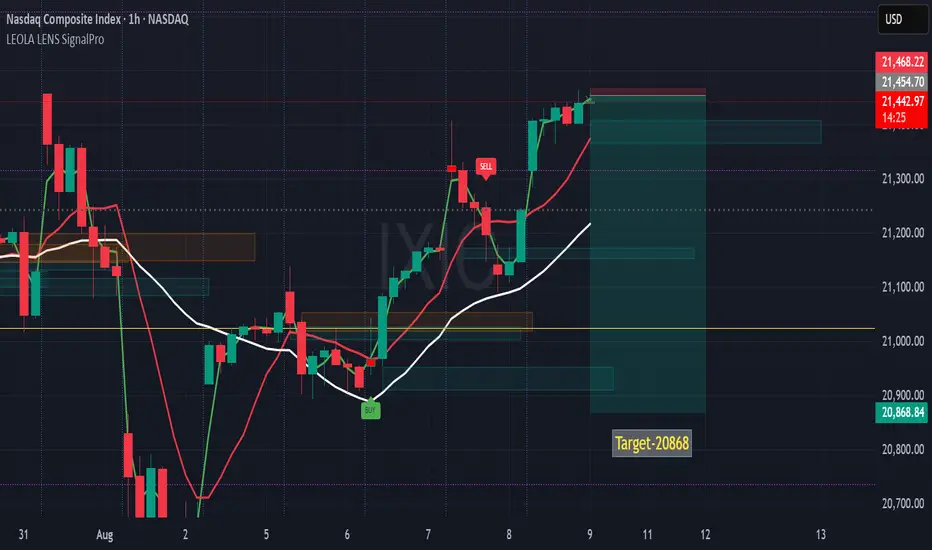
NASDAQ Composite (IXIC)- 1hr Reversal Setup Targeting 20,868This 1-hour chart shows a potential short-term reversal on the NASDAQ Composite, identified using Leola Lens SignalPro.
🔍 Technical Notes:
🟢 Price recently tested the upper red supply zone near 21,454, where prior SELL pressure emerged.
⚪ The white trendline (mid-term bias) is still below price, suggesting a test of resilience before reversal.
🔴 Multiple rejections near the supply zone may hint at exhaustion of buying momentum.
📉 Target: 20,868 — aligning with a prior structural pivot and liquidity zone.
🟡 Watch for confirmation via lower timeframe breakdowns before any continuation lower.
The setup reflects a possible supply-zone reaction after an extended rally, with a measured move toward a lower support zone.
⚠️ Disclaimer:
This analysis is for educational purposes only and should not be taken as financial advice. Always do your own research and consult a licensed financial advisor before making any trading decisions.
Leolalens
Nifty50 Intraday Rebound-Sets Eyes For Long 🔍 Key Observations:
✅ A fresh Buy label has printed after a series of lower lows — suggesting potential momentum shift.
🔴 Previous Sell cluster accurately marked the swing high near 25,145 zone.
⚪ Price is still trading below the 200 EMA, but attempting to reclaim short-term trendlines.
🟫 Minor Liquidity Box indicates supply pressure ahead, aligning with previous structure resistance.
📊 Risk-to-reward suggests the move could extend towards 25,145.35, if price holds above 24,707.
🎯 Setup Summary:
Bias: Cautiously bullish, short-term retracement within broader downtrend
Target Zone: 25,145 – matching previous support turned resistance
Invalidation: Below 24,647 where recent demand may fail
🧠 Educational Insight:
This setup highlights a classic counter-trend bounce from oversold levels, often seen when market participants begin profit-taking or short-covering. Momentum confirmation is crucial beyond the red zone to validate follow-through.
⏱ Timeframe:
15-Minute (Intraday)

ETHUSD Lowers High Formation After Recent Peak Eyes 4010📊 Key Observations:
Trend Shift: After peaking near 4,700, ETH rejected strongly with a caution signal at the top, marking a possible exhaustion zone.
Sell Signals: Multiple sell triggers emerged after the top, showing sellers defending resistance levels.
Liquidity Zone: Price is consolidating under the 4,434 – 4,480 area, which is acting as fresh resistance.
Moving Averages: Short-term averages have crossed downward, aligning with bearish momentum.
📉 Current Setup:
Entry region: Around 4,408 – 4,434 (resistance rejection area).
Target zone: 4,009 – 4,040 (highlighted objective area).
Stop level: Above 4,480 (recent supply zone).
🔎 Reasoning:
Lower highs are forming after the recent peak.
Strong sell presence above 4,400s.
Breakdown structure suggests continuation toward the 4,200 handle, with an extended target closer to 4,009.
Market caution markers confirm a potential trend reversal zone already formed earlier.
✅ETHUSD is in a bearish continuation phase unless bulls reclaim 4,480+. Watching the 4,200 and 4,009 levels as key downside objectives.
⚠️ Disclaimer:
This analysis is for educational purposes only and does not constitute financial advice. Always do your own research and manage risk before making trading decisions.

EURUSD-Possible Reversal Forming After Extended DowntrendEURUSD has been in a strong downtrend, consistently respecting the short-term and long-term EMAs.
Recent Buy signals from SignalPro have appeared at the base, showing early signs of buyer interest.
The most recent Sell signal failed to continue the move lower — suggesting momentum may be fading.
🔍 Setup Structure:
Entry Zone: Watching for confirmation above 1.15510 (EMA breakout + structure shift)
Stop Loss: Below 1.15199 (beneath local swing low)
Target Area: 1.17224 — aligned with previous inefficiency and potential liquidity magnet
⚙️ SignalPro Insights:
Yellow caution zone (if it appears next) often precedes higher-probability directional changes.
Multiple signals have triggered near historical demand zones — aligning with possible institutional activity.
⚠️ This chart and analysis are for educational purposes only. Not financial advice. Past performance does not guarantee future results. Always conduct your own analysis and manage risk accordingly.

ETHUSD-Potential Reversal Eyes LongETHUSD declined into a previously tested support zone, triggering a new Buy signal from SignalPro.
Price is currently attempting to reclaim short-term structure but remains under EMA resistance.
The recent Sell signal failed to create a lower low, potentially signaling bearish exhaustion.
🔍 Educational Setup Observation:
Reclaim Zone: Near 3,790.00
Stop Reference: Below 3,744.71 (beneath structural low)
Target Zone: 4,223.47 — aligned with prior imbalance and resistance from previous high-volume node
If price can decisively reclaim above EMAs, momentum shift may accelerate.
⚠️ This analysis is for educational purposes only. It does not constitute financial advice. Always do your own analysis and apply proper risk management.

BTCUSD-Eyes on Bullish PullbackPrice action formed a clean pullback into prior support after an earlier rally.
Multiple Buy signals have appeared at the lows, with the latest near a previous Liquidity Control Box.
The yellow caution label triggered near the top earlier, signaling possible short-term exhaustion — now invalidated as price re-approaches structure.
🔍 Trade Structure (Educational Reference):
Observed Entry Zone: Near 117,840 after reclaiming short-term EMA
Stop Level: Below 117,379 (beneath structure low)
Potential Target: 121,102 — aligns with higher timeframe imbalance and previous untested levels
🧠 SignalPro Notes:
The earlier Sell signals followed by failed downside continuation show weakening bearish control.
EMA realignment in progress — continued strength above white EMA could accelerate momentum.
⚠️ This chart and analysis are for educational purposes only. It is not financial advice. Please perform your own analysis and manage risk carefully.

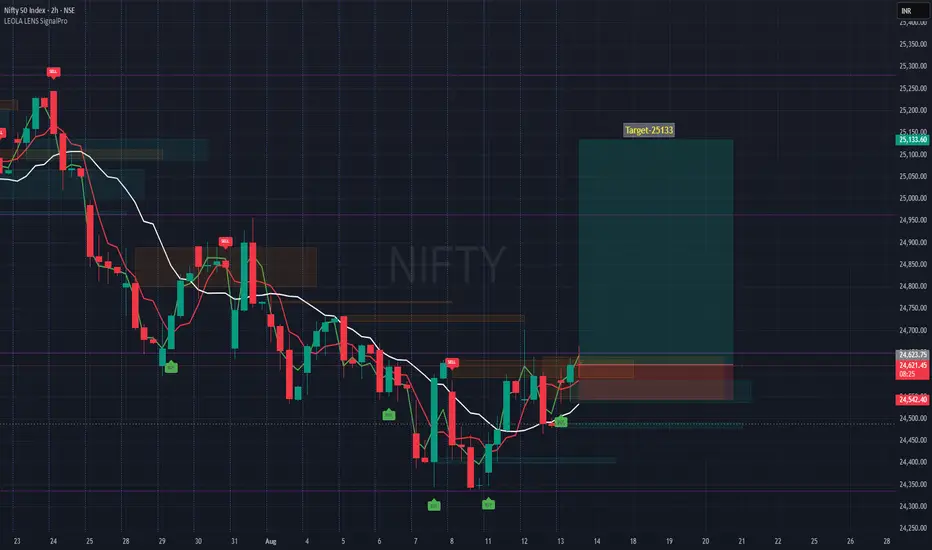
NIFTY Eyes Long on 25133- Bullish Breakout WatchTimeframe: 2-hour (H2)
Entry Zone: Around current breakout level of 24,619
Target: 25,133 – aligns with a prior reaction high and measured move projection from recent swing range.
Stop-Loss: 24,542 – just below the most recent higher low, protecting the setup if momentum fails.
Reasoning:
Price has been forming higher lows since August 7, indicating gradual strength building.
Moving averages have turned upward, confirming short-term trend change.
Previous sell-side liquidity zones have been cleared, reducing overhead resistance until the 25,133 area.
Volume profile shows a gap zone between 24,650 and 25,100, often filled quickly in trending conditions.
Risk Management:
This is a swing-style setup within an ongoing uptrend on the lower timeframe but still needs confirmation from follow-through buying.
Disclaimer:
This chart is for educational discussion only and does not constitute financial advice or a recommendation to trade. Markets carry risk, and decisions should be based on your own analysis and risk tolerance.
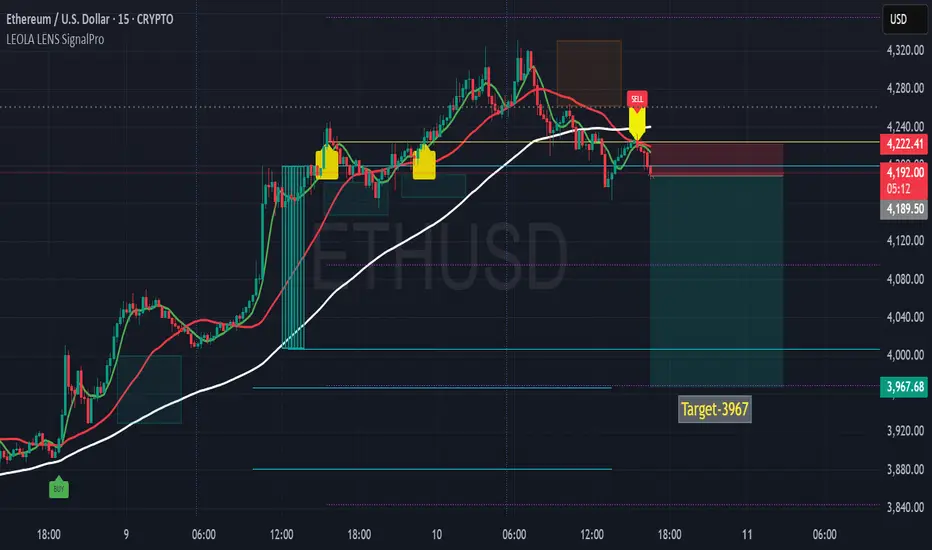
ETHUSD-15MIN SHORT Setup After Supply RejectionThis chart highlights a potential short trade opportunity on ETHUSD following rejection at the overhead supply zone.
Technical Notes:
Yellow caution markers signaled earlier high-probability trend shift points.
Price tested the zone near 4,240, where prior selling pressure emerged.
The recent SELL marker aligned with a break below the moving average, confirming bearish bias.
Liquidity levels below remain untested, offering a possible draw toward the 3,967 target.
Stop-loss placed above recent highs to maintain favorable risk-to-reward.
Bias: Bearish toward target area unless price reclaims and sustains above supply zone.
Disclaimer: This analysis is for educational purposes only and does not constitute financial advice. Trading and investing involve risk, and past performance is not indicative of future results. Always conduct your own research before making trading decisions.
BTCUSD Eyes Lowest Support Retest-Weakness PersistsThis 15-minute chart on BTCUSD reflects sustained bearish conditions, with clear rejection patterns and sell momentum guided by Leola Lens SignalPro overlays.
🔍 Technical Structure Highlights
🔻 Multiple SELL signals continue to appear below compression zones — indicating persistent supply.
🟡 Caution Labels marked each major swing low, capturing high-probability trend reversal zones, but no structural breakout followed.
🟥 Price remains trapped beneath both adaptive red and white base trendlines, confirming dominant downside bias.
🟩 A brief BUY signal appeared inside a narrow range, but failed to follow through — highlighting overall market weakness.
🔁 What to Watch
A clean move above $113,374 is needed to shift momentum toward the $114,800–$116,000 resistance band.
If rejection holds, price may rotate back toward the lower support zone near $112,713, or further.
🧠 This chart illustrates a structure-first approach using Leola Lens SignalPro. For educational analysis only. Trade safe.
#BTCUSD #Bitcoin #Crypto #LeolaLens #StructureTrading #SmartContext #PriceAction

ETHUSD EYES FOR LONG - Intraday ViewThis 15-minute chart on ETHUSD highlights a potential structure-aware reversal zone, guided by Leola Lens SignalPro overlays and trend context.
🔍 Technical Structure Highlights:
🟡 Caution Labels Active — Market is transitioning with signs of indecision. High-probability trend change zones are being tested.
🔻 Price remains below both the adaptive red and white base trendlines, signaling bearish pressure is still dominant.
🟥 Recent SELL signal held well, driving price lower into the Liquidity Control Box, which has now acted as a local support area.
🟢 Multiple attempts to reclaim structure are visible — but the price is still trading under key compression zone near $3,513.
🔁 What to Watch:
A clean break and hold above $3,513 could indicate a potential squeeze toward the $3,600–$3,720 zone.
Rejection from current levels could retest the base support near $3,455 or lower if trend resumes.
🧠 This chart is a visual study of structure, momentum, and reaction using Leola Lens SignalPro tools. All views are for educational purposes only. Trade safe.
#ETHUSD #Crypto #Ethereum #LeolaLens #PriceAction #SmartContext

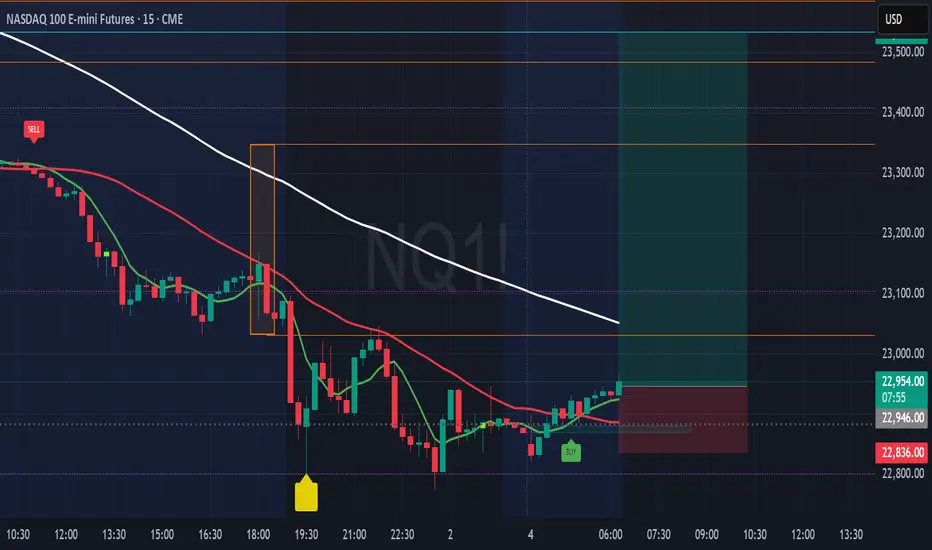
NQ100 - Eyes Long Towards 23531📌 NQ100 Futures 15-min — Buy Signal After Momentum Exhaustion & Trap Zone
Technical Structure Insights (15m):
🟡 A caution label printed near the evening session, highlighting a potential trap zone after short-term buyers were absorbed near the white moving average (trend resistance).
🔻 Price broke lower, completing a strong impulse leg to the downside.
🟢 BUY Signal has since appeared after price based out near 22,830 — coinciding with the purple reaction line.
📈 Current price is climbing back toward dynamic resistance levels (red and white moving averages).
🔍 Price must reclaim and sustain above 23,000 for upward continuation to remain structurally valid.
Otherwise, this may evolve into a lower high setup within the broader trend context.
Disclaimer: This chart is for educational purposes only and does not constitute financial advice. Always perform your own analysis and manage your trading risk responsibly
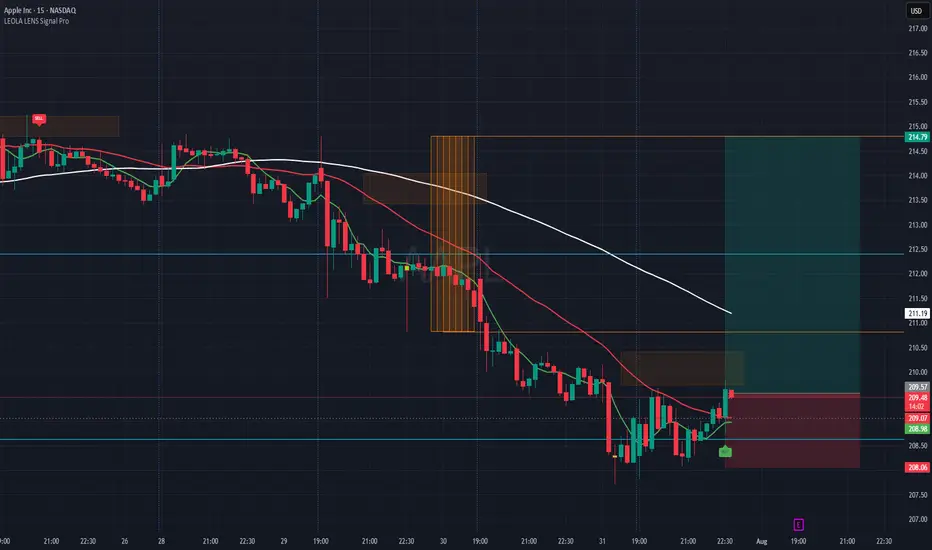
AAPL-Reaction Setup Lower Structure Zone-Eyes LongThis chart captures a structure-aware buy setup on Apple Inc. (AAPL), using Leola Lens SignalPro with momentum overlays and risk visualization.
What the Chart Shows:
🟢 A new BUY label appeared after price tapped a previously marked liquidity zone.
📉 Prior bearish momentum exhausted near 208.50–208.90 area — forming a potential base.
🟥 Overhead resistance is clearly defined, aligning with a recent rejection block and moving average confluence.
✅ A well-defined Risk:Reward setup is plotted — aiming for continuation toward 214.79, with risk below 208.06.
Key Levels to Monitor:
🔺 Break and hold above 210.50 could shift bias toward bullish continuation.
⚠️ Failure to hold above 209.00 could invalidate the current intraday structure.
This view is for educational purposes only — illustrating how price reacts around structure, liquidity, and confirmation signals.
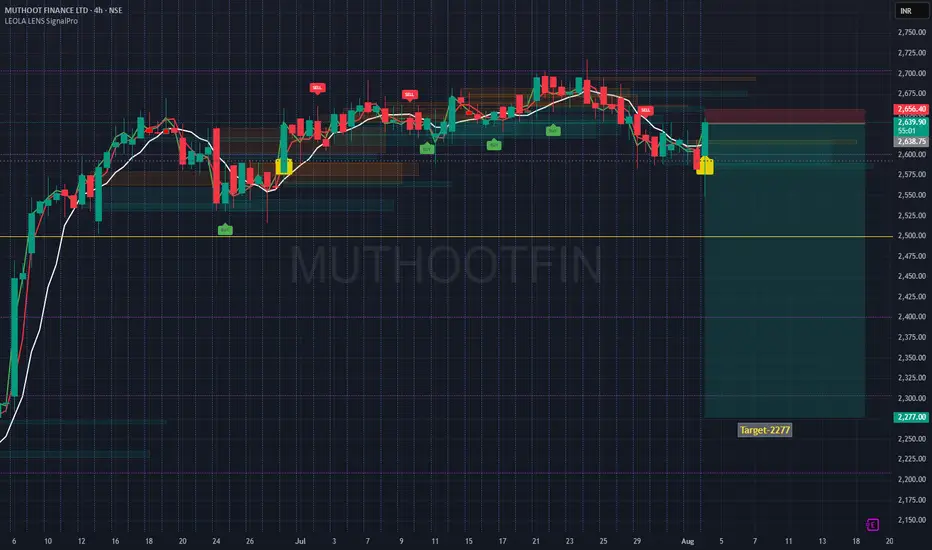
MUTHOOTFIN Structure Breakdown- 2277- Step Towards a Fall 🔍 Technical Structure Breakdown:
🟡 Caution label printed after extended distribution — often a signal for upcoming directional shift.
🔴 Price rejected strongly from the upper red supply zone near ₹2,656, confirming resistance from prior SELL cluster.
⚪ Structure broke below a multi-session accumulation zone, flipping the bias to bearish.
🟢 Current rebound is testing the underside of broken structure — often a key area for rejection or continuation.
📉 Target: ₹2,277, aligning with a major historical reaction zone and potential liquidity pocket.
This setup reflects a classic breakdown-retest structure where price may revisit lower order blocks if it fails to reclaim the broken support zone.
⚠️ Disclaimer:
This post is intended solely for educational purposes and does not constitute financial advice. Please do your own research and consult a licensed financial advisor before making any investment or trading decisions.
XAUUSD - Intraday Eyes Short 📌 XAUUSD 45-min — Sell Signal at Supply After Aggressive Impulse Rally
Technical Structure Notes (45m):
🔺 A strong impulsive leg lifted price from sub-3320 zones toward 3360 — completing a breakout from accumulation.
🔴 SELL Signal triggered near prior rejection zone after signs of exhaustion.
🔻 Price is currently reacting to short-term supply, with the red moving average acting as a dynamic decision point.
🟫 Supply zone aligns with previous resistance, suggesting potential rejection unless price reclaims 3362.
📍 If price fails to hold above 3353, a pullback toward 3315–3320 becomes technically plausible.
Disclaimer: This chart is shared strictly for educational purposes and is not financial advice. Always perform your own analysis and manage risk before taking any trading decisions.

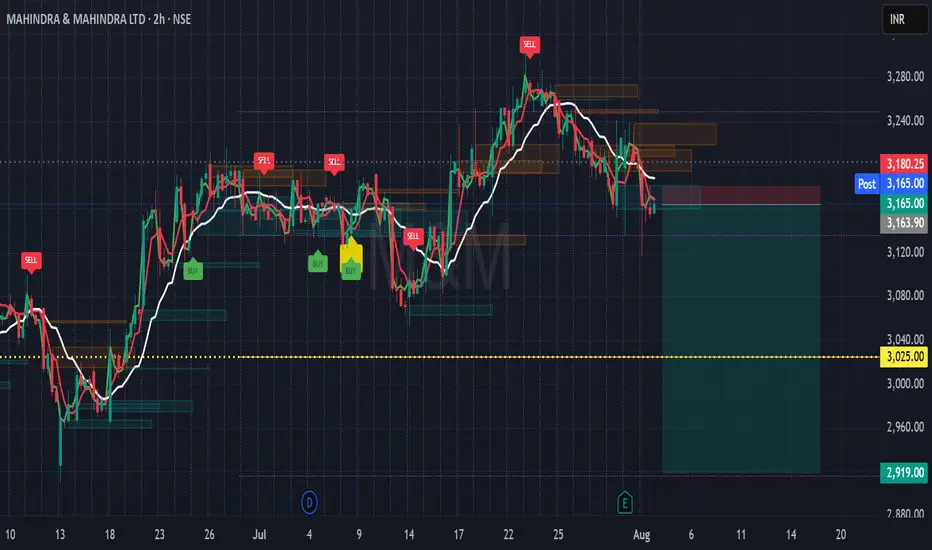
M&M Short Setup-Rejection from Supply Zone + Trend ConfirmationThis 2H chart on Mahindra & Mahindra Ltd. reflects a structure-aware short opportunity, based on price rejection from a key resistance zone and alignment with Leola Lens SignalPro logic.
🔎 Technical Structure Highlights:
🔴 SELL signal confirmed as price failed to sustain above recent supply clusters.
🟤 Multiple rejection blocks visible near ₹3,180 — now acting as resistance.
⚪ Price broke below the adaptive white base trendline, turning it into overhead pressure.
🟡 Prior yellow caution marker (trend shift risk) proved meaningful as momentum faded.
🟥 Defined invalidation level above ₹3,180.25.
🟢 Bearish targets align with previous demand zones near ₹3,025 and ₹2,919.
📌 Context Note:
Trend has shifted from congestion to downside acceleration. A clean break of recent structure suggests caution for longs. Watch for volatility around upcoming earnings.
📚 This is a technical case study — for educational use only.
Always trade with risk controls and your own judgment.
#M&M #Mahindra #NSEStocks #PriceAction #ShortSetup #StructureTrading #TechnicalAnalysis #SignalPro
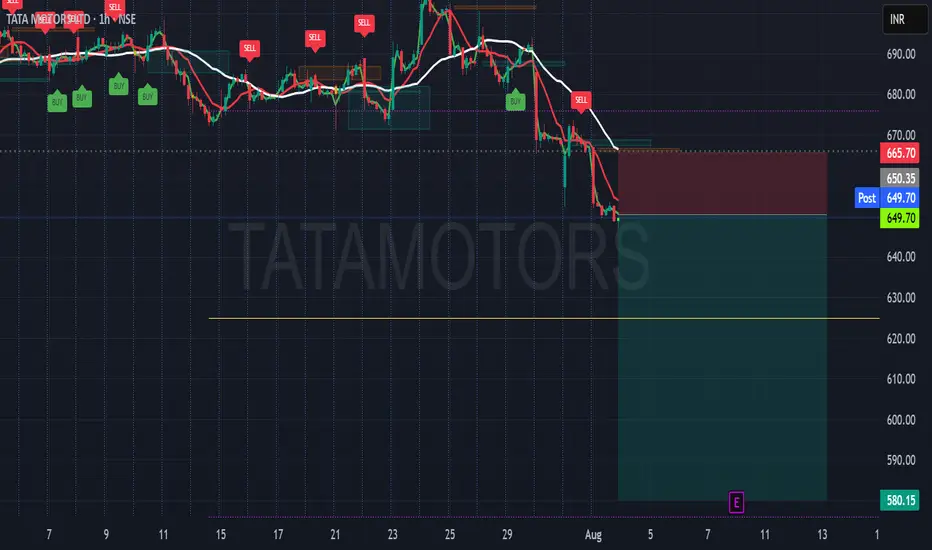
TATAMOTORS Breakdown Watch-Structure Rejection & MomentumThis 1H chart on Tata Motors highlights a structure-aware short setup, guided by the Leola Lens SignalPro overlay.
🔍 Technical Breakdown:
🔴 A fresh SELL signal appeared after price lost the adaptive trendline and failed to reclaim the resistance block.
⚪ Price retested the liquidity rejection zone near ₹650–₹652 before continuing lower.
🟣 The white base trendline is now acting as overhead pressure.
🟥 The Liquidity Control Box serves as invalidation above ₹665.70.
🟢 Potential target zones extend toward the ₹620–₹580 region, aligning with prior demand clusters.
🧠 Context Note:
The setup follows a clear structure rejection after a failed bullish attempt. Momentum confirms the shift, but risk management remains essential due to volatility and earnings
📌 For educational purposes only.
Always manage risk and confirm with your own strategy.
#TataMotors #ShortSetup #StructureTrading #IndianStocks #NSE #PriceAction #TechnicalAnalysis
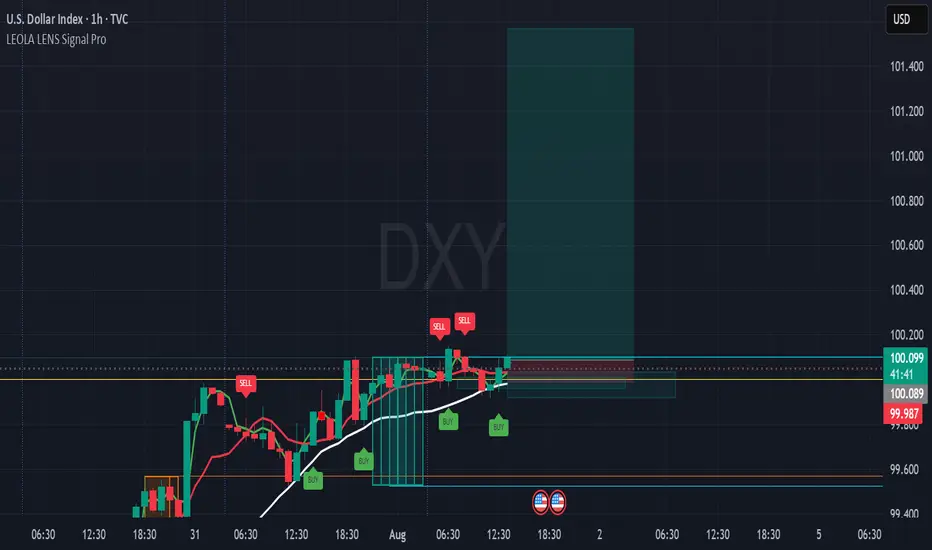
DXY Long Setup Forming After Structure Reclaim-101.567This intraday chart on DXY (U.S. Dollar Index) showcases a structure-aware long setup using Leola Lens SignalPro on the 1H timeframe.
⚙️ Key Technical Highlights:
🟢 Multiple BUY signals appeared near 99.98–100.00 zone after reclaiming short-term structure.
⚪ Price holds above the white adaptive base trendline — suggesting support strength.
🟥 Liquidity Control Box defines a clear invalidation zone under 99.98.
🔁 Prior SELL signals failed to follow through, indicating weakening bearish momentum.
📊 Target projection: 101.567 (based on structural extension and signal alignment).
📌 What to Monitor:
🔎 A decisive candle close above 100.10–100.15 can confirm bullish intent.
🎯 Reward-to-risk favored on clean setups post-breakout, aligning with momentum model.
📉 Invalid if structure re-breaks below base zone with volume.
⚠️ Educational use only. Not financial advice. Structure zones visualize behavior — not prediction.
🔐 Invite-only tool — access details in author bio.
ES1- Reversal After Extended SelloffPrice has experienced a clean, directional drop with consistent Sell signals and EMA slope confirmation.
Current Buy signal has appeared near potential support, offering a short-term reversal watch.
EMAs still show downward pressure, so caution is warranted until breakout confirmation occurs.
🔍 Educational Setup Observation:
Observed Entry Zone: Near 6,408.00
Stop Level: Below 6,399.25 (below structural low)
Potential Target Area: 6,442.75 — prior imbalance and reaction zone
🧠 SignalPro Highlights:
This is the first Buy signal after a strong sell sequence — often used as a potential momentum shift marker.
Short-term reversal setups like this often require clear candle confirmation above moving averages to validate direction.
⚠️ This chart and setup is for educational purposes only. It is not financial advice. Always conduct your own due diligence and apply proper risk management.

UK100-Short Setup After Supply Zone RejectionPrice rallied sharply from the lows after a Buy signal, showing strong momentum into resistance.
After the rally, a Sell signal has emerged near local highs and beneath a defined structure zone.
Price has started to reject from the zone, with EMAs flattening out — hinting at short-term weakness.
🔍 Educational Setup (Short Bias):
Observed Entry Area: Near 9,146.80
Stop Reference: Above 9,155.96 (supply invalidation point)
Target Zone: 9,092.29 — aligned with previous demand base and structural retest
🧠 SignalPro Observations:
Earlier Buy sequence led to momentum burst — now fading as price meets resistance
EMA behavior suggests potential for mean reversion or short-term correction
Liquidity cluster below may act as a draw in the near term
⚠️ This chart and analysis are for educational purposes only. This is not financial advice. Please conduct your own analysis and manage risk before making any trading decisions.

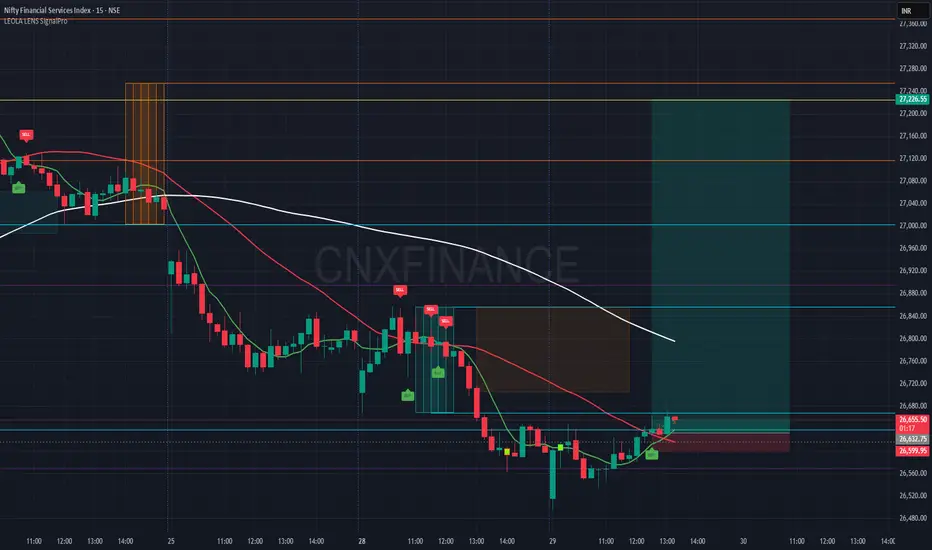
Nifty Financial Services Index-Reversal Set-Long Eyes ONLeolaLens SignalPro has triggered a fresh Buy indication on the 15-minute chart after a prolonged downtrend. This signal has emerged near a possible reversal zone, with defined risk and potential reward setup.
Entry: Around 26,660
Stop Loss: 26,599
🎯 Target 1: 26,880
🎯 Target 2: 27,040
🎯 Target 3 (Extended): 27,240
Key Observations:
Price attempting short-term EMA crossover
Favorable risk-reward ratio setup
Chart structure suggests potential for short-term reversal
🛑 Disclaimer:
This chart is shared strictly for educational purposes. This is not financial advice or a buy/sell recommendation. Please do your own research and consult a registered financial advisor before making any trading decisions.
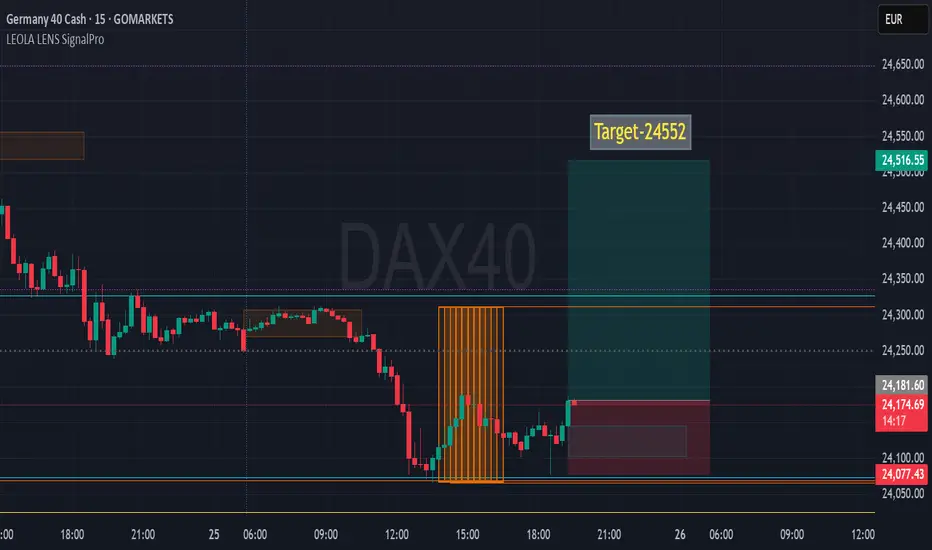
DAX40 Recovery Setup-Potential Upside to 24552After a significant intraday selloff, DAX40 shows signs of a potential recovery as price reclaims the earlier support zone with strength.
🔍 Key Observations:
✅ Yellow box marks a cluster of bars after a strong downtrend, hinting at accumulation or exhaustion.
⚠️ Support retest held — recent candles show signs of rejection from the lower bound near 24,077.
📈 Leola Lens SignalPro structure suggests a potential shift in bias — upside projection mapped to 24,552 as the next key level.
📊 Clean invalidation zone below recent wick lows.
💡 Educational Insight:
This setup emphasizes the importance of price structure, volume balance zones, and trend exhaustion for anticipating reversals. Traders can study how institutional-style tools like SignalPro help highlight such shift moments with visual clarity.
BTCUSD-Eyes 120000 after Liquidity Sweep & Support RetestPrice action on the 15-min chart shows Bitcoin forming a potential bullish continuation after a liquidity sweep below short-term support. Here’s what stands out:
🔹 Triple Tap Support: Price respected a key zone multiple times, hinting at strong buyer interest.
🔹 Post-Sweep Reaction: Sharp recovery followed by consolidation suggests demand re-entered the market.
🔹 SignalPro Context: Leola Lens™ SignalPro highlighted key zones (yellow + orange), offering caution and trend context.
🔹 Projected Path: With price stabilizing above the reclaimed zone, potential upside target aligns with the 120000 region.
📌 Educational Note:
This setup highlights how liquidity collection below support and subsequent recovery can offer clues to short-term directional intent. Always manage risk based on volatility and session context.

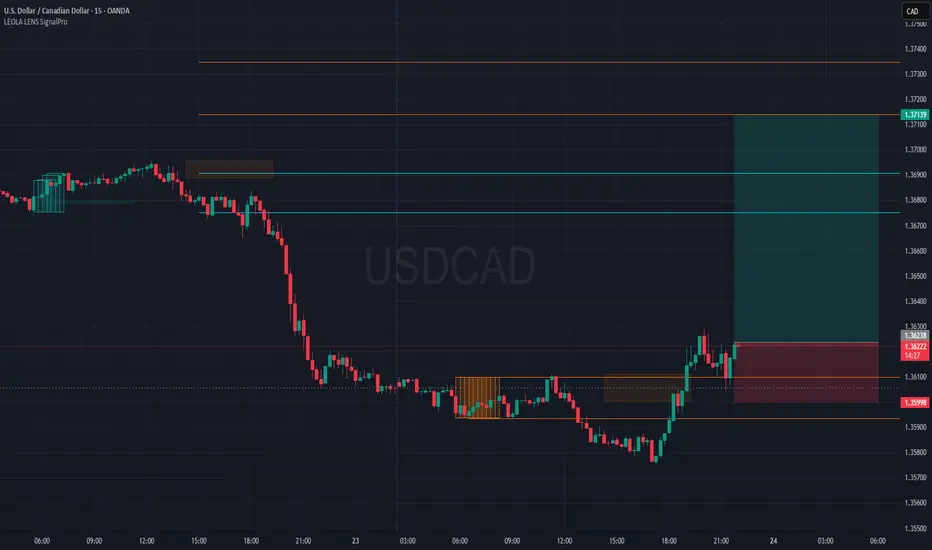
USDCAD Bullish Setup-Shift from Accumulation to ExpansionPrice has broken above recent accumulation range marked by Liquidity Control Boxes.
SignalPro long setup activated with:
🔶 Smart accumulation zone breakout
🔁 Minor retest at 1.361 area holding
🎯 Targeting upper liquidity levels around 1.37139
Price structure shows a bullish microtrend reversal with risk capped below last demand block.
Key Elements on Chart:
📦 Leola Lens SignalPro's control zones provided context for consolidation and breakout
📈 Breakout aims toward untested supply zones above
⏳ Timeframe: 15-min
🧠 Educational Use Only – No financial advice.
Tool used: Leola Lens SignalPro