Nifty Intraday Levels | 30-04-2024The Green line is marked for breakout
The Red line is marked for breakdown
The Black line is for the target on the upside
stay tuned, if any levels occur will update in the comment section.
Levels

BSE ltd positional trading ideaATH breakout of BSE. BSE just broke the upper resistance level of 2600. the volume of the breaout candle is also good. but it didnt consolidate before breakout. so there is a chance that BSE will move in a range for a few days after breakout. and after that if it makes a positive price action, we may go for a long entry.
Disclaimer: All information provided here is for educational purposes and not a recommendation, advice, research report, or stock tip of any nature. Analysis Posted here is just our view/personal study method on the stocks, commodities or other instruments and assets.

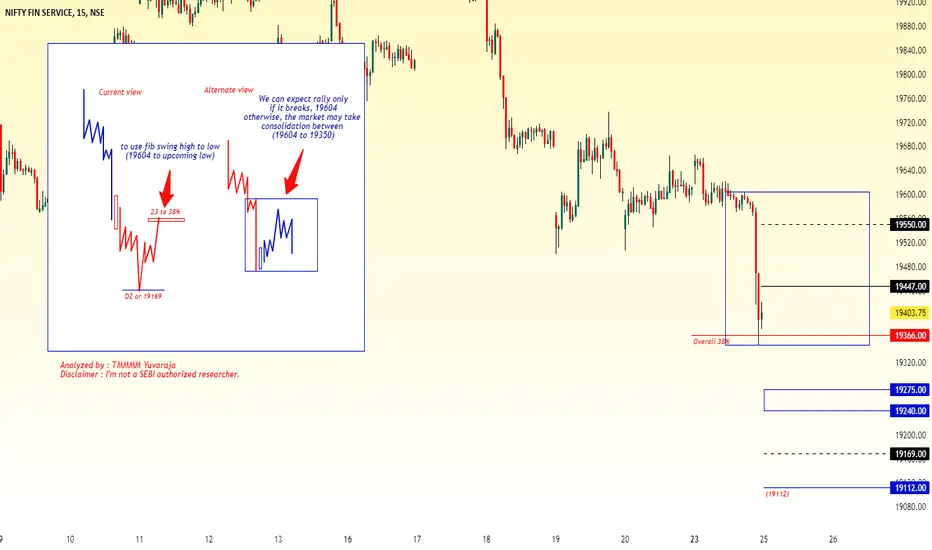
#Banknifty directions and levels for March 4thBanknifty also has the same sentiment. If the gap-up sustains, then we can expect a minor rally. Once it rejects the immediate resistance levels, then we can expect a minimum correction of 23 to 38%. Alternatively, if the gap-up doesn't sustain, then we can expect a 23 to 38% correction initially, indicating that the 4th wave may continue further.

19 Feb ’24 — BankNifty is still not bullish, 47016 has to break.BankNifty Analysis - Stance Neutral ➡️
Even though the 4mts chart looks bullish as the moving averages have a positive slope, the reality is quite different. BankNifty has not managed to find the fire to go “BOOM BOOM”, it is totally lazy and lethargic at its current levels. Today we ended up gaining 150 points ~ 0.32% but a few of the major banks like HDFC Bank, Kotak, and AXIS were not that excited. ICICI on the other hand was totally on another orbit today. If you look at the chart below you can see the fear of heights (blue markers). The best way to get through is with a mega gap-up, which will force the weak hands to run for cover.
4mts chart
Make no mistake, BN has rallied 2094 points ~ 4.69% from the recent swing low. But visually that rally is not bullish yet, that is because the time factor is at play. BN is very near the top of the bearish channel. A break above 47016 and then 47465 will give it sufficient momentum to surge through. The biggest factor that is holding up is HDFC Bank which has fallen after its results. We guess the bulls are waiting for HDFCBK to regain its footing so that the index itself can break free. The only way Nifty can get past 22500 is with the help of BankNifty. We do not remember the last time where Nifty50 kept making new highs without the support of BN.
63mts chart
Algo Trading
Our BankNifty algo trades ended today with a gain of Rs3793.

BTC breaking the Resistance Level BITCOIN_UPDATE
If Bitcoin (BTC) breaks a resistance level and successfully retests it, there's a possibility of a significant upward price movement. Watch closely for confirmation of the successful retest, as it could lead to a strong bullish momentum.

NIFTY INTRADAY LEVELS FOR 28/12/2023BUY ABOVE - 21670
SL - 21590
TARGETS - 21740,21820,21910
SELL BELOW - 21590
SL - 21670
TARGETS - 21490,21410,21330
NO TRADE ZONE - 21590 to 21670
Previous Day High - 21670
Previous Day Low - 21490
I am sharing NIFTY levels this levels acts as important support & resistance for intraday. if you want to trade with this levels wait for 15 min Candle closing above that levels. You can trade with breakout and reversal both.
In this channel, I share my expertise in trading strategies, technical analysis, and market trends to help you make informed decisions in your trading ventures.
Stay tuned for daily updates, in-depth market analyses, and real-time trading scenarios to witness firsthand how we transform from Zero to Hero in the trading world. My Only aim is to empower you with the knowledge and skills necessary to navigate the complexities of the financial markets successfully.
Based on price action major support & resistance's are here, the red lines acts as resistances, the green lines acts as supports. If the price breaks the support/resistance, it will move to the next support/resistance line. White lines indicates previous day high & low, high acts as a resistance & low acts as a support for next day.
Please NOTE: this levels are for intraday trading only.
Disclaimer - All information on this page is for educational purposes only,
we are not SEBI Registered, Please consult a SEBI registered financial advisor for your financial matters before investing And taking any decision. We are not responsible for any profit/loss you made.
Request your support and engagement by liking and commenting & follow to provide encouragement
HAPPY TRADING 👍

BANK NIFTY INTRADAY LEVELS FOR 28/12/2023BUY ABOVE - 48350
SL - 48200
TARGETS - 48600,48800,49000
SELL BELOW - 48030
SL - 48200
TARGETS - 47820,47650,47420
NO TRADE ZONE - 48030 to 48350
Previous Day High - 48350
Previous Day Low - 47820
I am sharing BANK NIFTY levels this levels acts as important support & resistance for intraday. if you want to trade with this levels wait for 15 min Candle closing above that levels. You can trade with breakout and reversal both.
In this channel, I share my expertise in trading strategies, technical analysis, and market trends to help you make informed decisions in your trading ventures.
Stay tuned for daily updates, in-depth market analyses, and real-time trading scenarios to witness firsthand how we transform from Zero to Hero in the trading world. My Only aim is to empower you with the knowledge and skills necessary to navigate the complexities of the financial markets successfully.
Based on price action major support & resistance's are here, the red lines acts as resistances, the green lines acts as supports. If the price breaks the support/resistance, it will move to the next support/resistance line. White lines indicates previous day high & low, high acts as a resistance & low acts as a support for next day.
Trendlines are also significant to price action. If the price is above/below the trendlines, can expect an UP/DOWN with aggressive move.
Please NOTE: this levels are for intraday trading only.
Disclaimer - All information on this page is for educational purposes only,
we are not SEBI Registered, Please consult a SEBI registered financial advisor for your financial matters before investing And taking any decision. We are not responsible for any profit/loss you made.
Request your support and engagement by liking and commenting & follow to provide encouragement
HAPPY TRADING 👍

BANKNIFTY Levels for 7 Dec 2023If Bank Nifty opens between 46950 and 46725
If breaks 46950 then Targets are 47075, 47200, 47500
On the Downside if breaks 46725 then Targets are 46475, 46235, 45820

#finnifty directions and levels for oct25"Good morning, friends! As of October 25th, the global market sentiment is moderately bearish, as indicated by the Dow Jones. However, our market is also bearish. It may open with a slight gap-up. After that, if the gap-up doesn't sustain, we can expect a continuation of the correction with minor pullbacks. On the other hand, if the gap-up sustains, we can expect a range-bound market between the previous stock. We can anticipate a rally only if it breaks the top of the minor correction starting point."
Finnifty direction and levels for #October18th"Good morning, friends! As of October 18th, the global market sentiment is neutral to slightly negative, as indicated by the Dow Jones. However, our market is still within a range. It may open neutrally. If it breaks the previous day's low, the 50% Fibonacci level will act as strong support. If the market finds support there, we can expect the range market to continue its rally. However, if it breaks or consolidates, the correction will likely continue. On the other hand, if the market breaks the previous day's high, we can set our target at the next resistance level."

BANK NIFTY INTRADAY LEVELS FOR 18/09/2023" HAPPY GANESH CHATHURTHI "
" MAY THIS GANESH CHATHURTHI REMOVE ALL YOUR HURDLES BRING YOU PROFITS "
BUY - 46300
SL - 46200
TARGETS - 46430,46550,46630
SELL - 46150
SL - 46250
TARGETS - 46030,45820,45630
NO TRADE ZONE - 46150 to 46300
Previous Day High - 46300
Previous Day Low - 46030
I am sharing BANK NIFTY levels this levels acts as important support & resistance for intraday. if you want to trade with this levels wait for 15 min Candle closing above that levels. You can trade with breakout and reversal both.
In this channel, I share my expertise in trading strategies, technical analysis, and market trends to help you make informed decisions in your trading ventures.
Stay tuned for daily updates, in-depth market analyses, and real-time trading scenarios to witness firsthand how we transform from Zero to Hero in the trading world. My Only aim is to empower you with the knowledge and skills necessary to navigate the complexities of the financial markets successfully.
Based on price action major support & resistance's are here, the red lines acts as resistances, the green lines acts as supports. If the price breaks the support/resistance, it will move to the next support/resistance line. White lines indicates previous day high & low, high acts as a resistance & low acts as a support for next day.
Trendlines are also significant to price action. If the price is above/below the trendlines, can expect an UP/DOWN with aggressive move.
Please NOTE: this levels are for intraday trading only.
Disclaimer - All information on this page is for educational purposes only,
we are not SEBI Registered, Please consult a SEBI registered financial advisor for your financial matters before investing And taking any decision. We are not responsible for any profit/loss you made.
Request your support and engagement by liking and commenting & follow to provide encouragement
HAPPY TRADING 👍

NIFTY INTRADAY LEVELS FOR 18/09/2023 (HAPPY GANESH CHATHURTHI)" HAPPY GANESH CHATHURTHI "
" MAY THIS GANESH CHATHURTHI REMOVE ALL YOUR HURDLES BRING YOU PROFITS "
BUY - 20200
SL - 20170
TARGETS - 20280,20380,20470
SELL - 20140
SL - 20170
TARGETS - 20110,20040,19950
NO TRADE ZONE - 20140 to 20200
Previous Day High - 20222
Previous Day Low - 20134
I am sharing NIFTY levels this levels acts as important support & resistance for intraday. if you want to trade with this levels wait for 15 min Candle closing above that levels. You can trade with breakout and reversal both.
In this channel, I share my expertise in trading strategies, technical analysis, and market trends to help you make informed decisions in your trading ventures.
Stay tuned for daily updates, in-depth market analyses, and real-time trading scenarios to witness firsthand how we transform from Zero to Hero in the trading world. My Only aim is to empower you with the knowledge and skills necessary to navigate the complexities of the financial markets successfully.
Based on price action major support & resistance's are here, the red lines acts as resistances, the green lines acts as supports. If the price breaks the support/resistance, it will move to the next support/resistance line. White lines indicates previous day high & low, high acts as a resistance & low acts as a support for next day.
Please NOTE: this levels are for intraday trading only.
Disclaimer - [/b ] All information on this page is for educational purposes only,
we are not SEBI Registered, Please consult a SEBI registered financial advisor for your financial matters before investing And taking any decision. We are not responsible for any profit/loss you made.
Request your support and engagement by liking and commenting & follow to provide encouragement
HAPPY TRADIN G 👍

BankniftyNSE:BANKNIFTY Here, is the chart, Trade the levels accordingly...
and Yes, Trade only after closing of the candle either side

05 Sep ’23 Post Mortem on FinNifty | Weekly Expiry AnalysisFinNifty Weekly Expiry Analysis
Between the last expiry and today, Finnifty has only fallen 0.21% ~ 41pts. From a headline level the fall of 1.83% ~ 365 pts and its recovery is not obvious. Moreover FinNifty has respected the support level of 19421 and is trading at a safe distance from it.
As it stands Finnifty is not showing any directional sentiment, this was the reason the options premium were very less today. In fact Nifty50 and BankNifty far OTM options had good juice today, I am assuming it would be because the liquidity was sucked out by the FinNifty expiry traders.

Nifty Futures levels 05.09.2023Go through the charts...levels targets....check previous charts and let m know if you want to understand these levels and markings.

Bank Nifty Futures levels 05.09.23Go through the charts...levels targets....check previous charts and let m know if you want to understand these levels and markings.

Market Reject From Higher Levels As Per Data Already tomorrow We discussed that the market shows bullish and that happened Market opened today Gapup and Rejected From Higher Levels Market Fell 200 points from Opening
For Tommorw We Can
Trade Bullish Above 44640
For Downside Big Support 44300
AS Per OI Data BIG Resistance 44500
BIG Support 44300/44200/44000
If the Market Break Again at 44300 then it falls Possible
Watch Market Data

NIFTY FUTURES 28th August 2023Go through the charts...levels targets....check previous charts and let m know if you want to understand these levels and markings.
Note how beautifully the levels work

Bank Nifty Futures 28th August 2023Go through the charts...levels targets....check previous charts and let m know if you want to understand these levels and markings.
Note how beautifully the levels work

Nifty Futures 21st August 2023Go through the charts...levels targets....check previous charts and let m know if you want to understand these levels and markings.
Note how beautifully the levels work

Bank Nifty Futures 21st August 2023Go through the charts...levels targets....check previous charts and let m know if you want to understand these levels and markings.
Note how beautifully the levels work

Nifty Futures levels 18th August 2023Go through the charts...levels targets....check previous charts and let m know if you want to understand these levels and markings.
Note how beautifully the levels work

Bank Nifty Futures 18th August 2023Go through the charts...levels targets....check previous charts and let m know if you want to understand these levels and markings.
Note how beautifully the levels work
