How to use Head n Shoulder / Inv. Head n Shoulder Chart Pattern.Hello Friends,
Welcome to RK_Chaarts,
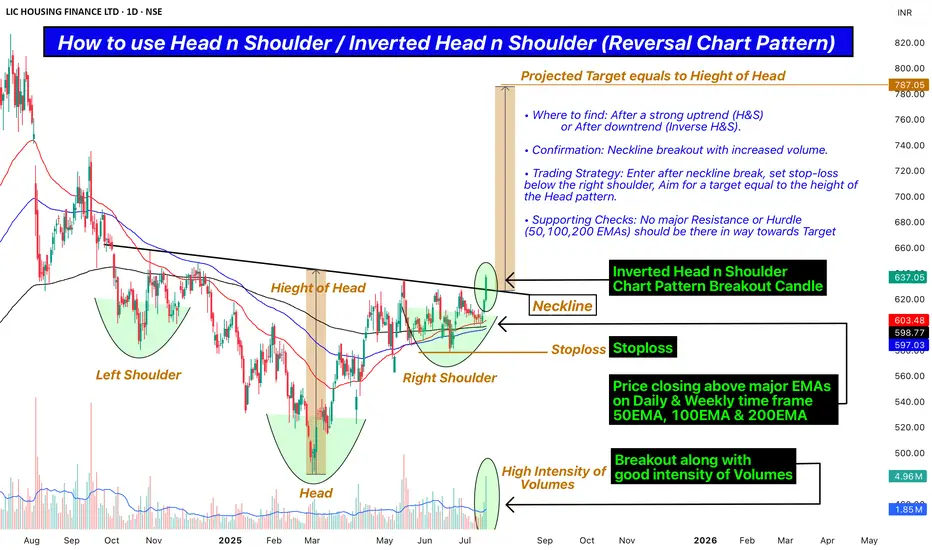
Today we are going to Learn how to use Head n Shoulder / Inverted Head n Shoulder (Reversal Chart Pattern) as a Professional Trader along with real terms to check, Confirm and apply.
• Where to find: After a strong uptrend (H&S) or After downtrend (Inverse H&S).
• Confirmation: Neckline breakout with increased volume.
• Trading Strategy: Enter after neckline break, set stop-loss below the right shoulder, Aim for a target equal to the height of the Head pattern.
• Supporting Checks: No major Resistance or Hurdle (50,100,200 EMAs) should be there in way towards Target.
This post is shared purely for educational purpose & it’s Not a trading advice.
I am not Sebi registered analyst.
My studies are for educational purpose only.
Please Consult your financial advisor before trading or investing.
I am not responsible for any kinds of your profits and your losses.
Most investors treat trading as a hobby because they have a full-time job doing something else.
However, If you treat trading like a business, it will pay you like a business.
If you treat like a hobby, hobbies don't pay, they cost you...!
Hope this post is helpful to community
Thanks
RK💕
Disclaimer and Risk Warning .
The analysis and discussion provided on in.tradingview.com is intended for educational purposes only and should not be relied upon for trading decisions. RK_Chaarts is not an investment adviser and the information provided here should not be taken as professional investment advice. Before buying or selling any investments, securities, or precious metals, it is recommended that you conduct your own due diligence. RK_Chaarts does not share in your profits and will not take responsibility for any losses you may incur. So Please Consult your financial advisor before trading or investing.
Lichousing
LIC Housing in consolidating, Base Breakout above 618.LIC Housing: in consolidation. Base breakout above 618 sustained closing basis.
Support/SL at 590/551.
Resistance at 658/717/808.

LIC Housing Finance Swing Long- LIC Housing Finance is currently trading at 723
- I can see an FVG in LIC Housing Finance that can make LIC Housing Finance retract lower
- I will be possibly looking for entries around that area
- Invalidation below the long-short ratio

swing trade activated 1Dit is a swing trade for 2-3 months.
entry activated you can go long
risk reward 1:4
target and stop loss is mentioned there
follow risk management
do your own analysis
do workout
do meditation
start reading books

Lic Housing Finance Strength :-
Growth in Net Profit with increasing Profit Margin (QoQ)
Book Value per share Improving for last 2 years
Company with Zero Promoter Pledge
FII / FPI or Institutions increasing their shareholding
Tiredness :-
Red Flag: High Interest Payments Compared to Earnings
Negative Breakdown Third Support (LTP < S3)
Companies with High Debt
Inefficient use of capital to generate profits - RoCE declining in the last 2 years
Decline in Quarterly Net Profit with falling Profit Margin (YoY)
Declining Net Cash Flow : Companies not able to generate net cash
Recent Results: Declining Operating Profit Margin and Net Profits (YoY)
Weak Momentum: Price below Short, Medium and Long Term Averages
Happiness :-
Companies with current TTM PE Ratio less than 3 Year, 5 Year and 10 Year PE
Negative to Positive growth in Sales and Profit with Strong Price momentum
Stock with Low PE (PE < = 10)

long on lichousing finance go long on lic housing finance with best risk reward ratio.
SL 390 clsb cmp 394.20 target 410 418 424 428 430 above new range

LIC housing near monthly demand zoneLIC housing near monthly demand zone between 287.10 to 262.25
Good to buy zone.

LIC HOUSING BREAKOUTLIC housing seems good on weekly chart by breaking falling trendline and closed above on that, looking bullish on RSI indicator too giving positive bullish divergence by breaking previous resistance on it so we can see a good up move in this counter.
Cause of long-:
1- Falling trendline breakout.
2- RSI breakout.

LIC Technical Analysis for Tomorrow LIC Technical Analysis for Intraday
Sell at :- 399
Target :- 395 , 391
Stop loss :- 402

LIC HOUSING : Bullish Flag BreakoutLICHOUSING stock has given a breakout of the Bullish FLAG on the lower time frame . One should go long with SL of 320 & look for the target of 355/360


LICHSGFIN LIC HousingLICHSGFIN LIC Housing ..........................................................................................

BUY LIC HOUSING FINANCE ABOVE 406LIC Housing Finance looks good to buy if sustain above 406 for the upper marked targets on the chart.
To motivate me, Please like the idea If you agree with the analysis.
Happy Trading!
InvestPro India Team

LIC Housing Finance BreakoutJust trying it for first Time. LIC has given a breakout with huge volume so one can take the entry at CMP. Marked some of the Important levels my first target is 425 and then second target could be 450 it can also touch its 52 week high. keep a eye.

LIC HOUSING FINANCERespecting a Trendline in Hourly.
Looks good above 357.
Wait for the breakout to take entry.
Levels are mentioned in the Chart.

✔️LIC Housing Finance-Overall analysiseverything mentioned in the chart.
something fishy
This is not a stock recommendation.Try to read the chart.

LICHSGFIN Trade Setup For TomorrowIntraday pick for Tomorrow - 03-01-2022
Stock name : LICHSGFIN
Time frame : 15 minutes
Wait for proper breakout and retest for entry.
For more trading content follow us on ( @tradechefofficial )

LICHSGFIN possible reversalHello traders, deepakntr achieved its target when gave a breakout of the H&S pattern in a single day.
Next stock I am focused on is lichsgfin, it has seen a good correction in the past weeks and have retraced back to the golden ration or zone.
On weekly timeframe it took support on 61.8% fib and bounced back
Above the flip level
Bounced back from demand zone
RSI is above 45
MACD above signal line
Buy above 370
Targets mentioned in the chart above
Please LIKE, COMMENT and SHARE to motivate and support me. I'll keep on posting new ideas on Indices & Stocks. Be sure to follow so that you don't miss any good trades that might have been rewarding.
Any comments and critiques will be appreciated even if it's of opposite view as a trader can also be right so many times.

LIC Housing Finance Formed Head & ShoulderLIC Housing Finance Formed Head & Shoulder.. It was trading below 21, 100, 200 WEMA . Aggressive Bearish if its close below 360 DCB

LICHSGFIN - Monthly chart analysisLICHSGFIN as per monthly chart analysis has good support at 385 level even in three previous occasions for the stock to reverse and it has three major resistance 443, 460 and 490 level. once all these are broken then the stock will fly up to 550 - 600 levels.

LIC HOUSING : BearishSock has completed its 5 waves up move & is now correcting for three waves down in ABC format, of which A & B has already been completed & now the wave c is unfolding. The complete corrective pattern is unfolding as a ZIGZAG correction.
Trading strategy :
Sell on cmp or any rise , keeping SL of 440 , look for the downside target of 395/375/350/300

LIC HOUSING FINANCE GOING TO TOUCH 450 LEVEL SOONOn the weekly chart, the Share bounces back after hold a major support level at 373. If he holds it and momentum continues upward as per the chart then it going to test again at 450 levels in the near future.
Short term target is 450 from the current level
Long term target is 520 in 12 months

